
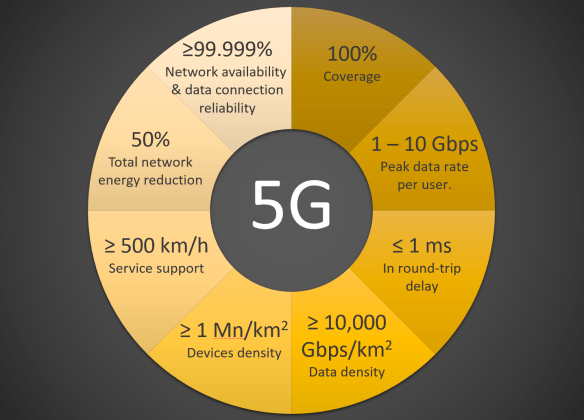
100% COVERAGE.
100% 5G coverage is not going to happen with 30 – 300 GHz millimeter-wave frequencies alone.
The “NGMN 5G white paper” , which I will in the subsequent parts refer to as the 5G vision paper, require the 5G coverage to be 100%.
At 100% cellular coverage it becomes somewhat academic whether we talk about population coverage or geographical (area) coverage. The best way to make sure you cover 100% of population is covering 100% of the geography. Of course if you cover 100% of the geography, you are “reasonably” ensured to cover 100% of the population.
While it is theoretically possible to cover 100% (or very near to) of population without covering 100% of the geography, it might be instructive to think why 100% geographical coverage could be a useful target in 5G;
- Network-augmented driving and support for varous degrees of autonomous driving would require all roads to be covered (however small).
- Internet of Things (IoT) Sensors and Actuators are likely going to be of use also in rural areas (e.g., agriculture, forestation, security, waterways, railways, traffic lights, speed-detectors, villages..) and would require a network to connect to.
- Given many users personal area IoT networks (e.g., fitness & health monitors, location detection, smart-devices in general) ubiquitous becomes essential.
- Internet of flying things (e.g., drones) are also likely to benefit from 100% area and aerial coverage.
However, many countries remain lacking in comprehensive geographical coverage. Here is an overview of the situation in EU28 (as of 2015);

For EU28 countries, 14% of all house holds in 2015 still had no LTE coverage. This was approx.30+ million households or equivalent to 70+ million citizens without LTE coverage. The 14% might seem benign. However, it covers a Rural neglect of 64% of households not having LTE coverage. One of the core reasons for the lack of rural (population and household) coverage is mainly an economic one. Due to the relative low number of population covered per rural site and compounded by affordability issues for the rural population, overall rural sites tend to have low or no profitability. Network sharing can however improve the rural site profitability as site-related costs are shared.
From an area coverage perspective, the 64% of rural households in EU28 not having LTE coverage is likely to amount to a sizable lack of LTE coverage area. This rural proportion of areas and households are also very likely by far the least profitable to cover for any operator possibly even with very progressive network sharing arrangements.
Fixed broadband, Fiber to the Premises (FTTP) and DOCSIS3.0, lacks further behind that of mobile LTE-based broadband. Maybe not surprisingly from an business economic perspective, in rural areas fixed broadband is largely unavailable across EU28.
The chart below illustrates the variation in lack of broadband coverage across LTE, Fiber to the Premises (FTTP) and DOCSIS3.0 (i.e., Cable) from a total country perspective (i.e., rural areas included in average).

We observe that most countries have very far to go on fixed broadband provisioning (i.e., FTTP and DOCSIS3.0) and even on LTE coverage lacks complete coverage. The rural coverage view (not shown here) would be substantially worse than the above Total view.
The 5G ambition is to cover 100% of all population and households. Due to the demographics of how rural households (and populations) are spread, it is also likely that fairly large geographical areas would need to be covered in order to come true on the 100% ambition.
It would appear that bridging this lack of broadband coverage would be best served by a cellular-based technology. Given the fairly low population density in such areas relative higher average service quality (i.e., broadband) could be delivered as long as the cell range is optimized and sufficient spectrum at a relative low carrier frequency (< 1 GHz) would be available. It should be remembered that the super-high 5G 1 – 10 Gbps performance cannot be expected in rural areas. Due to the lower carrier frequency range need to provide economic rural coverage both advanced antenna systems and very large bandwidth (e.g., such as found in the mm-frequency range) would not be available to those areas. Thus limiting the capacity and peak performance possible even with 5G.
I would suspect that irrespective of the 100% ambition, telecom providers would be challenged by the economics of cellular deployment and traffic distribution. Rural areas really sucks in profitability, even in fairly aggressive sharing scenarios. Although multi-party (more than 2) sharing might be a way to minimize the profitability burden on deep rural coverage.

The above chart shows the relationship between traffic distribution and sites. As a rule of thumb 50% of revenue is typically generated by 10% of all sites (i.e., in a normal legacy mobile network) and approx. 50% of (rural) sites share roughly 10% of the revenue. Note: in emerging markets the distribution is somewhat steeper as less comprehensive rural coverage typically exist. (Source: The ABC of Network Sharing – The Fundamentals.).
Irrespective of my relative pessimism of the wider coverage utility and economics of millimeter-wave (mm-wave) based coverage, there shall be no doubt that mm-wave coverage will be essential for smaller and smallest cell coverage where due to density of users or applications will require extreme (in comparison to today’s demand) data speeds and capacities. Millimeter-wave coverage-based architectures offer very attractive / advanced antenna solutions that further will allow for increased spectral efficiency and throughput. Also the possibility of using mm-wave point to multipoint connectivity as last mile replacement for fiber appears very attractive in rural and sub-urban clutters (and possible beyond if the cost of the electronics drop according the expeced huge increase in demand for such). This last point however is in my opinion independent of 5G as Facebook with their Terragraph development have shown (i.e., 60 GHz WiGig-based system). A great account for mm-wave wireless communications systems can be found in T.S. Rappaport et al.’s book “Millimeter Wave Wireless Communications” which not only comprises the benefits of mm-wave systems but also provides an account for the challenges. It should be noted that this topic is still a very active (and interesting) research area that is relative far away from having reached maturity.
In order to provide 100% 5G coverage for the mass market of people & things, we need to engage the traditional cellular frequency bands from 600 MHz to 3 GHz.
1 – 10 Gbps PEAK DATA RATE PER USER.
Getting a Giga bit per second speed is going to require a lot of frequency bandwidth, highly advanced antenna systems and lots of additional cells. And that is likely going to lead to a (very) costly 5G deployment. Irrespective of the anticipated reduced unit cost or relative cost per Byte or bit-per-second.
At 1 Gbps it would take approx. 16 seconds to download a 2 GB SD movie. It would take less than a minute for the HD version (i.e., at 10 Gbps it just gets better;-). Say you have a 16GB smartphone, you loose maybe up to 20+% for the OS, leaving around 13GB for things to download. With 1Gbps it would take less than 2 minutes to fill up your smartphones storage (assuming you haven’t run out of credit on your data plan or reached your data ceiling before then … of course unless you happen to be a customer of T-Mobile US in which case you can binge on = you have no problems!).
The biggest share of broadband usage comes from video streaming which takes up 60% to 80% of all volumetric traffic pending country (i.e., LTE terminal penetration dependent). Providing higher speed to your customer than is required by the applied video streaming technology and smartphone or tablet display being used, seems somewhat futile to aim for. The Table below provides an overview of streaming standards, their optimal speeds and typical viewing distance for optimal experience;

Source: 5G Economics – An Introduction (Chapter 1).
So … 1Gbps could be cool … if we deliver 32K video to our customers end device, i.e., 750 – 1600 Mbps optimal data rate. Though it is hard to see customers benefiting from this performance boost given current smartphone or tablet display sizes. The screen size really have to be ridiculously large to truly benefit from this kind of resolution. Of course Star Trek-like full emersion (i.e., holodeck) scenarios would arguably require a lot (=understatement) bandwidth and even more (=beyond understatement) computing power … though such would scenario appears unlikely to be coming out of cellular devices (even in Star Trek).
1 Gbps fixed broadband plans have started to sell across Europe. Typically on Fiber networks although also on DOCSIS3.1 (10Gbps DS/1 Gbps US) networks as well in a few places. It will only be a matter of time before we see 10 Gbps fixed broadband plans being offered to consumers. Irrespective of compelling use cases might be lacking it might at least give you the bragging rights of having the biggest.
From European Commissions “Europe’s Digital Progress Report 2016”, 22 % of European homes subscribe to fast broadband access of at least 30 Mbps. An estimated 8% of European households subscribe to broadband plans of at least 100 Mbps. It is worth noticing that this is not a problem with coverage as according with the EC’s “Digital Progress Report” around 70% of all homes are covered with at least 30 Mbps and ca. 50% are covered with speeds exceeding 100 Mbps.
The chart below illustrates the broadband speed coverage in EU28;

Even if 1Gbps fixed broadband plans are being offered, still majority of European homes are at speeds below the 100 Mbps. Possible suggesting that affordability and household economics plays a role as well as the basic perceived need for speed might not (yet?) be much beyond 30 Mbps?
Most aggregation and core transport networks are designed, planned, built and operated on a assumption of dominantly customer demand of lower than 100 Mbps packages. As 1Gbps and 10 Gbps gets commercial traction, substantial upgrades are require in aggregation, core transport and last but not least possible also on an access level (to design shorter paths). It is highly likely distances between access, aggregation and core transport elements are too long to support these much higher data rates leading to very substantial redesigns and physical work to support this push to substantial higher throughputs.
Most telecommunications companies will require very substantial investments in their existing transport networks all the way from access to aggregation through the optical core switching networks, out into the world wide web of internet to support 1Gbps to 10 Gbps. Optical switching cards needs to be substantially upgraded, legacy IP/MPLS architectures might no longer work very well (i.e., scale & complexity issue).
Most analysts today believe that incumbent fixed & mobile broadband telecommunications companies with a reasonable modernized transport network are best positioned for 5G compared to mobile-only operators or fixed-mobile incumbents with an aging transport infrastructure.
What about the state of LTE speeds across Europe? OpenSignal recurrently reports on the State of LTE, the following summarizes LTE speeds in Mbps as of June 2017 for EU28 (with the exception of a few countries not included in the OpenSignal dataset);

The OpenSignal measurements are based on more than half a million devices, almost 20 billion measurements over the period of the 3 first month of 2017.
The 5G speed ambition is by todays standards 10 to 30+ times away from present 2016/2017 household fixed broadband demand or the reality of provided LTE speeds.
Let us look at cellular spectral efficiency to be expected from 5G. Using the well known framework;

In essence, I can provide very high data rates in bits per second by providing a lot of frequency bandwidth B, use the most spectrally efficient technologies maximizing η, and/or add as many cells N that my economics allow for.
In the following I rely largely on Jonathan Rodriquez great book on “Fundamentals of 5G Mobile Networks” as a source of inspiration.
The average spectral efficiency is expected to be coming out in the order of 10 Mbps/MHz/cell using advanced receiver architectures, multi-antenna, multi-cell transmission and corporation. So pretty much all the high tech goodies we have in the tool box is being put to use of squeezing out as many bits per spectral Hz available and in a sustainable matter. Under very ideal Signal to Noise Ratio conditions, massive antenna arrays of up to 64 antenna elements (i.e., an optimum) seems to indicate that 50+ Mbps/MHz/Cell might be feasible in peak.
So for a spectral efficiency of 10 Mbps/MHz/cell and a demanded 1 Gbps data rate we would need 100 MHz frequency bandwidth per cell (i.e., using the above formula). Under very ideal conditions and relative large antenna arrays this might lead to a spectral requirement of only 20 MHz at 50 Mbps/MHz/Cell. Obviously, for 10 Gbps data rate we would require 1,000 MHz frequency bandwidth (1 GHz!) per cell at an average spectral efficiency of 10 Mbps/MHz/cell.
The spectral efficiency assumed for 5G heavily depends on successful deployment of many-antenna segment arrays (e.g., Massive MiMo, beam-forming antennas, …). Such fairly complex antenna deployment scenarios work best at higher frequencies, typically above 2GHz. Also such antenna systems works better at TDD than FDD with some margin on spectral efficiency. These advanced antenna solutions works perfectly in the millimeter wave range (i.e., ca. 30 – 300 GHz) where the antenna segments are much smaller and antennas can be made fairly (very) compact (note: resonance frequency of the antenna proportional to half the wavelength with is inverse proportional to the carrier frequency and thus higher frequencies need smaller material dimension to operate).
Below 2 GHz higher-order MiMo becomes increasingly impractical and the spectral efficiency regress to the limitation of a simple single-path antenna. Substantially lower than what can be achieved at much high frequencies with for example massive-MiMo.
So for the 1Gbps to 10 Gbps data rates to work out we have the following relative simple rationale;
- High data rates require a lot of frequency bandwidth (>100 MHz to several GHz per channel).
- Lots of frequency bandwidth are increasingly easier to find at high and very high carrier frequencies (i.e., why millimeter wave frequency band between 30 – 300 GHz is so appealing).
- High and very high carrier frequencies results in small, smaller and smallest cells with very high bits per second per unit area (i.e., the area is very small!).
- High and very high carrier frequency allows me to get the most out of higher order MiMo antennas (i.e., with lots of antenna elements),
- Due to fairly limited cell range, I boost my overall capacity by adding many smallest cells (i.e., at the highest frequencies).
We need to watch out for the small cell densification which tends not to scale very well economically. The scaling becomes a particular problem when we need hundreds of thousands of such small cells as it is expected in most 5G deployment scenarios (i.e., particular driven by the x1000 traffic increase). The advanced antenna systems required (including the computation resources needed) to max out on spectral efficiency are likely going to be one of the major causes of breaking the economical scaling. Although there are many other CapEx and OpEx scaling factors to be concerned about for small cell deployment at scale.
Further, for mass market 5G coverage, as opposed to hot traffic zones or indoor solutions, lower carrier frequencies are needed. These will tend to be in the usual cellular range we know from our legacy cellular communications systems today (e.g., 600 MHz – 2.1 GHz). It should not be expected that 5G spectral efficiency will gain much above what is already possible with LTE and LTE-advanced at this legacy cellular frequency range. Sheer bandwidth accumulation (multi-frequency carrier aggregation) and increased site density is for the lower frequency range a more likely 5G path. Of course mass market 5G customers will benefit from faster reaction times (i.e., lower latencies), higher availability, more advanced & higher performing services arising from the very substantial changes expected in transport networks and data centers with the introduction of 5G.
Last but not least to this story … 80% and above of all mobile broadband customers usage, data as well as voice, happens in very few cells (e.g., 3!) … representing their Home and Work.

Source: Slideshare presentation by Dr. Kim “Capacity planning in mobile data networks experiencing exponential growth in demand.”
As most of the mobile cellular traffic happen at the home and at work (i.e., thus in most cases indoor) there are many ways to support such traffic without being concerned about the limitation of cell ranges.
The giga bit per second cellular service is NOT a service for the mass market, at least not in its macro-cellular form.
≤ 1 ms IN ROUND-TRIP DELAY.
A total round-trip delay of 1 or less millisecond is very much attuned to niche service. But a niche service that nevertheless could be very costly for all to implement.
I am not going to address this topic too much here. It has to a great extend been addressed almost to ad nauseam in 5G Economics – An Introduction (Chapter 1) and 5G Economics – The Tactile Internet (Chapter 2). I think this particular aspect of 5G is being over-hyped in comparison to how important it ultimately will turn out to be from a return on investment perspective.
Speed of light travels ca. 300 km per millisecond (ms) in vacuum and approx. 210 km per ms in fiber (some material dependency here). Lately engineers have gotten really excited about the speed of light not being fast enough and have made a lot of heavy thinking abou edge this and that (e.g., computing, cloud, cloudlets, CDNs,, etc…). This said it is certainly true that most modern data centers have not been build taking too much into account that speed of light might become insufficient. And should there really be a great business case of sub-millisecond total (i.e., including the application layer) roundtrip time scales edge computing resources would be required a lot closer to customers than what is the case today.
It is common to use delay, round-trip time or round-trip delay, or latency as meaning the same thing. Though it is always cool to make sure people really talk about the same thing by confirming that it is indeed a round-trip rather than single path. Also to be clear it is worthwhile to check that all people around the table talk about delay at the same place in the OSI stack or network path or whatever reference point agreed to be used.
In the context of the 5G vision paper it is emphasized that specified round-trip time is based on the application layer (i.e., OSI model) as reference point. It is certainly the most meaningful measure of user experience. This is defined as the End-2-End (E2E) Latency metric and measure the complete delay traversing the OSI stack from physical layer all the way up through network layer to the top application layer, down again, between source and destination including acknowledgement of a successful data packet delivery.
The 5G system shall provide 10 ms E2E latency in general and 1 ms E2E latency for use cases requiring extremely low latency.
The 5G vision paper states “Note these latency targets assume the application layer processing time is negligible to the delay introduced by transport and switching.” (Section 4.1.3 page 26 in “NGMN 5G White paper”).
In my opinion it is a very substantial mouthful to assume that the Application Layer (actually what is above the Network Layer) will not contribute significantly to the overall latency. Certainly for many applications residing outside the operators network borders, in the world wide web, we can expect a very substantial delay (i.e., even in comparison with 10 ms). Again this aspect was also addressed in my two first chapters.
Very substantial investments are likely needed to meet E2E delays envisioned in 5G. In fact the cost of improving latencies gets prohibitively more expensive as the target is lowered. The overall cost of design for 10 ms would be a lot less costly than designing for 1 ms or lower. The network design challenge if 1 millisecond or below is required, is that it might not matter that this is only a “service” needed in very special situations, overall the network would have to be designed for the strictest denominator.
Moreover, if remedies needs to be found to mitigate likely delays above the Network Layer, distance and insufficient speed of light might be the least of worries to get this ambition nailed (even at the 10 ms target). Of course if all applications are moved inside operator’s networked premises with simpler transport paths (and yes shorter effective distances) and distributed across a hierarchical cloud (edge, frontend, backend, etc..), the assumption of negligible delay in layers above the Network Layer might become much more likely. However, it does sound a lot like America Online walled garden fast forward to the past kind of paradigm.
So with 1 ms E2E delay … yeah yeah … “play it again Sam” … relevant applications clearly need to be inside network boundary and being optimized for processing speed or silly & simple (i.e., negligible delay above the Network Layer), no queuing delay (to the extend of being in-efficiency?), near-instantaneous transmission (i.e., negligible transmission delay) and distances likely below tenth of km (i.e., very short propagation delay).
When the speed of light is too slow there are few economic options to solve that challenge.
≥ 10,000 Gbps / Km2 DATA DENSITY.
The data density is maybe not the most sensible measure around. If taken too serious could lead to hyper-ultra dense smallest network deployments.
This has always been a fun one in my opinion. It can be a meaningful design metric or completely meaningless.
There is of course nothing particular challenging in getting a very high throughput density if an area is small enough. If I have a cellular range of few tens of meters, say 20 meters, then my cell area is smaller than 1/1000 of a km2. If I have 620 MHz bandwidth aggregated between 28 GHz and 39 GHz (i.e., both in the millimeter wave band) with a 10 Mbps/MHz/Cell, I could support 6,200 Gbps/km2. That’s almost 3 Petabyte in an hour or 10 years of 24/7 binge watching of HD videos. Note given my spectral efficiency is based on an average value, it is likely that I could achieve substantially more bandwidth density and in peaks closer to the 10,000 Gbps/km2 … easily.
Pretty Awesome Wow!
The basic; a Terabit equals 1024 Gigabits (but I tend to ignore that last 24 … sorry I am not).
With a traffic density of ca. 10,000 Gbps per km2, one would expect to have between 1,000 (@ 10 Gbps peak) to 10,000 (@ 1 Gbps peak) concurrent users per square km.
At 10 Mbps/MHz/Cell one would expect to have a 1,000 Cell-GHz/km2. Assume that we would have 1 GHz bandwidth (i.e., somewhere in the 30 – 300 GHz mm-wave range), one would need 1,000 cells per km2. On average with a cell range of about 20 meters (smaller to smallest … I guess what Nokia would call an Hyper-Ultra-Dense Network;-). Thus each cell would minimum have between 1 to 10 concurrent users.
Just as a reminder! 1 minutes at 1 Gbps corresponds to 7.5 GB. A bit more than what you need for a 80 minute HD (i.e., 720pp) full movie stream … in 1 minutes. So with your (almost) personal smallest cell what about the remaining 59 minutes? Seems somewhat wasteful at least until kingdom come (alas maybe sooner than that).
It would appear that the very high 5G data density target could result in very in-efficient networks from a utilization perspective.
≥ 1 MN / Km2 DEVICE DENSITY.
One million 5G devices per square kilometer appears to be far far out in a future where one would expect us to be talking about 7G or even higher Gs.
1 Million devices seems like a lot and certainly per km2. It is 1 device per square meter on average. A 20 meter cell-range smallest cell would contain ca. 1,200 devices.
To give this number perspective lets compare it with one of my favorite South-East Asian cities. The city with one of the highest population densities around, Manila (Philippines). Manila has more than 40 thousand people per square km. Thus in Manila this would mean that we would have about 24 devices per person or 100+ per household per km2. Overall, in Manila we would then expect approx. 40 million devices spread across the city (i.e., Manila has ca. 1.8 Million inhabitants over an area of 43 km2. Philippines has a population of approx. 100 Million).
Just for the curious, it is possible to find other more populated areas in the world. However, these highly dense areas tends to be over relative smaller surface areas, often much smaller than a square kilometer and with relative few people. For example Fadiouth Island in Dakar have a surface area of 0.15 km2 and 9,000 inhabitants making it one of the most pop densest areas in the world (i.e., 60,000 pop per km2).
I hope I made my case! A million devices per km2 is a big number.
Let us look at it from a forecasting perspective. Just to see whether we are possibly getting close to this 5G ambition number.
IHS forecasts 30.5 Billion installed devices by 2020, IDC is also believes it to be around 30 Billion by 2020. Machina Research is less bullish and projects 27 Billion by 2025 (IHS expects that number to be 75.4 Billion) but this forecast is from 2013. Irrespective, we are obviously in the league of very big numbers. By the way 5G IoT if at all considered is only a tiny fraction of the overall projected IoT numbers (e.g., Machine Research expects 10 Million 5G IoT connections by 2024 …that is extremely small numbers in comparison to the overall IoT projections).
A consensus number for 2020 appears to be 30±5 Billion IoT devices with lower numbers based on 2015 forecasts and higher numbers typically from 2016.
To break this number down to something that could be more meaningful than just being Big and impressive, let just establish a couple of worldish numbers that can help us with this;
- 2020 population expected to be around 7.8 Billion compared to 2016 7.4 Billion.
- Global pop per HH is ~3.5 (average number!) which might be marginally lower in 2020. Urban populations tend to have less pop per households ca. 3.0. Urban populations in so-called developed countries are having a pop per HH of ca. 2.4.
- ca. 55% of world population lives in Urban areas. This will be higher by 2020.
- Less than 20% of world population lives in developed countries (based on HDI). This is a 2016 estimate and will be higher by 2020.
- World surface area is 510 Million km2 (including water).
- of which ca. 150 million km2 is land area
- of which ca. 75 million km2 is habitable.
- of which 3% is an upper limit estimate of earth surface area covered by urban development, i.e., 15.3 Million km2.
- of which approx. 1.7 Million km2 comprises developed regions urban areas.
- ca. 37% of all land-based area is agricultural land.
Using 30 Billion IoT devices by 2020 is equivalent to;
- ca. 4 IoT per world population.
- ca. 14 IoT per world households.
- ca. 200 IoT per km2 of all land-based surface area.
- ca. 2,000 IoT per km2 of all urban developed surface area.
If we limit IoT’s in 2020 to developed countries, which wrongly or rightly exclude China, India and larger parts of Latin America, we get the following by 2020;
- ca. 20 IoT per developed country population.
- ca. 50 IoT per developed country households.
- ca. 18,000 IoT per km2 developed country urbanized areas.
Given that it would make sense to include larger areas and population of both China, India and Latin America, the above developed country numbers are bound to be (a lot) lower per Pop, HH and km2. If we include agricultural land the number of IoTs will go down per km2.
So far far away from a Million IoT per km2.
What about parking spaces, for sure IoT will add up when we consider parking spaces!? … Right? Well in Europe you will find that most big cities will have between 50 to 200 (public) parking spaces per square kilometer (e.g., ca. 67 per km2 for Berlin and 160 per km2 in Greater Copenhagen). Aha not really making up to the Million IoT per km2 … what about cars?
In EU28 there are approx. 256 Million passenger cars (2015 data) over a population of ca. 510 Million pops (or ca. 213 million households). So a bit more than 1 passenger car per household on EU28 average. In Eu28 approx. 75+% lives in urban area which comprises ca. 150 thousand square kilometers (i.e., 3.8% of EU28’s 4 Million km2). So one would expect little more (if not a little less) than 1,300 passenger cars per km2. You may say … aha but it is not fair … you don’t include motor vehicles that are used for work … well that is an exercise for you (too convince yourself why that doesn’t really matter too much and with my royal rounding up numbers maybe is already accounted for). Also consider that many EU28 major cities with good public transportation are having significantly less cars per household or population than the average would allude to.
Surely, public street light will make it through? Nope! Typical bigger modern developed country city will have on average approx. 85 street lights per km2, although it varies from 0 to 1,000+. Light bulbs per residential household (from a 2012 study of the US) ranges from 50 to 80+. In developed countries we have roughly 1,000 households per km2 and thus we would expect between 50 thousand to 80+ thousand lightbulbs per km2. Shops and business would add some additions to this number.
With a cumulated annual growth rate of ca. 22% it would take 20 years (from 2020) to reach a Million IoT devices per km2 if we will have 20 thousand per km2 by 2020. With a 30% CAGR it would still take 15 years (from 2020) to reach a Million IoT per km2.
The current IoT projections of 30 Billion IoT devices in operation by 2020 does not appear to be unrealistic when broken down on a household or population level in developed areas (even less ambitious on a worldwide level). The 18,000 IoT per km2 of developed urban surface area by 2020 does appear somewhat ambitious. However, if we would include agricultural land the number would become possible a more reasonable.
If you include street crossings, traffic radars, city-based video monitoring (e.g., London has approx. 300 per km2, Hong Kong ca. 200 per km2), city-based traffic sensors, environmental sensors, etc.. you are going to get to sizable numbers.
However, 18,000 per km2 in urban areas appears somewhat of a challenge. Getting to 1 Million per km2 … hmmm … we will see around 2035 to 2040 (I have added an internet reminder for a check-in by 2035).
Maybe the 1 Million Devices per km2 ambition is not one of the most important 5G design criteria’s for the short term (i.e., next 10 – 20 years).
Oh and most IoT forecasts from the period 2015 – 2016 does not really include 5G IoT devices in particular. The chart below illustrates Machina Research IoT forecast for 2024 (from August 2015). In a more recent forecast from 2016, Machine Research predict that by 2024 there would be ca. 10 million 5G IoT connections or 0.04% of the total number of forecasted connections;

The winner is … IoTs using WiFi or other short range communications protocols. Obviously, the cynic in me (mea culpa) would say that a mm-wave based 5G connections can also be characterized as short range … so there might be a very interesting replacement market there for 5G IoT … maybe? 😉
Expectations to 5G-based IoT does not appear to be very impressive at least over the next 10 years and possible beyond.
The un-importance of 5G IoT should not be a great surprise given most 5G deployment scenarios are focused on millimeter-wave smallest 5G cell coverage which is not good for comprehensive coverage of IoT devices not being limited to those very special 5G coverage situations being thought about today.
Only operators focusing on comprehensive 5G coverage re-purposing lower carrier frequency bands (i.e., 1 GHz and lower) can possible expect to gain a reasonable (as opposed to niche) 5G IoT business. T-Mobile US with their 600 MHz 5G strategy might very well be uniquely positions for taking a large share of future proof IoT business across USA. Though they are also pretty uniquely position for NB-IoT with their comprehensive 700MHz LTE coverage.
For 5G IoT to be meaningful (at scale) the conventional macro-cellular networks needs to be in play for 5G coverage .,, certainly 100% 5G coverage will be a requirement. Although, even with 5G there maybe 100s of Billion of non-5G IoT devices that require coverage and management.
≤ 500 km/h SERVICE SUPPORT.
Sure why not? but why not faster than that? At hyperloop or commercial passenger airplane speeds for example?
Before we get all excited about Gbps speeds at 500 km/h, it should be clear that the 5G vision paper only proposed speeds between 10 Mbps up-to 50 Mbps (actually it is allowed to regress down to 50 kilo bits per second). With 200 Mbps for broadcast like services.
So in general, this is a pretty reasonable requirement. Maybe with the 200 Mbps for broadcasting services being somewhat head scratching unless the vehicle is one big 16K screen. Although the users proximity to such a screen does not guaranty an ideal 16K viewing experience to say the least.
What moves so fast?
The fastest train today is tracking at ca. 435 km/h (Shanghai Maglev, China).
Typical cruising airspeed for a long-distance commercial passenger aircraft is approx. 900 km/h. So we might not be able to provide the best 5G experience in commercial passenger aircrafts … unless we solve that with an in-plane communications system rather than trying to provide Gbps speed by external coverage means.
Why take a plane when you can jump on the local Hyperloop? The proposed Hyperloop should track at an average speed of around 970 km/h (faster or similar speeds as commercial passengers aircrafts), with a top speed of 1,200 km/h. So if you happen to be in between LA and San Francisco in 2020+ you might not be able to get the best 5G service possible … what a bummer! This is clearly an area where the vision did not look far enough.
Providing services to moving things at a relative fast speed does require a reasonable good coverage. Whether it being train track, hyperloop tunnel or ground to air coverage of commercial passenger aircraft, new coverage solutions would need to be deployed. Or alternative in-vehicular coverage solutions providing a perception of 5G experience might be an alternative that could turn out to be more economical.
The speed requirement is a very reasonable one particular for train coverage.
50% TOTAL NETWORK ENERGY REDUCTION.
If 5G development could come true on this ambition we talk about 10 Billion US Dollars (for the cellular industry). Equivalent to a percentage point on the margin.
There are two aspects of energy efficiency in a cellular based communication system.
- User equipment that will benefit from longer intervals without charging and thus improve customers experience and overall save energy from less frequently charges.
- Network infrastructure energy consumption savings will directly positively impact a telecom operators Ebitda.
Energy efficient Smartphones
The first aspect of user equipment is addressed by the 5G vision paper under “4.3 Device Requirements” sub-section “4.3.3 Device Power Efficiency”; “Battery life shall be significantly increased: at least 3 days for a smartphone, and up tp 15 years for a low-cost MTC device.” (note: MTC = Machine Type Communications).
Apple’s iPhone 7 battery life (on a full charge) is around 6 hours of constant use with 7 Plus beating that with ca. 3 hours (i.e., total 9 hours). So 3 days will go a long way.
From a recent 2016 survey from Ask Your Target Market on smartphone consumers requirements to battery lifetime and charging times;
- 64% of smartphone owners said they are at least somewhat satisfied with their phone’s battery life.
- 92% of smartphone owners said they consider battery life to be an important factor when considering a new smartphone purchase.
- 66% said they would even pay a bit more for a cell phone that has a longer battery life.
Looking at the mobile smartphone & tablet non-voice consumption it is also clear why battery lifetime and not in-important the charging time matters;

Source: eMarketer, April 2016. While 2016 and 2017 are eMarketer forecasts (why dotted line and red circle!) these do appear well in line with other more recent measurements.
Non-voice smartphone & tablet based usage is expected by now to exceed 4 hours (240 minutes) per day on average for US Adults.
That longer battery life-times are needed among smartphone consumers is clear from sales figures and anticipated sales growth of smartphone power-banks (or battery chargers) boosting the life-time with several more hours.
It is however unclear whether the 3 extra days of a 5G smartphone battery life-time is supposed to be under active usage conditions or just in idle mode. Obviously in order to matter materially to the consumer one would expect this vision to apply to active usage (i.e., 4+ hours a day at 100s of Mbps – 1Gbps operations).
Energy efficient network infrastructure.
The 5G vision paper defines energy efficiency as number of bits that can be transmitted over the telecom infrastructure per Joule of Energy.
The total energy cost, i.e., operational expense (OpEx), of telecommunications network can be considerable. Despite our mobile access technologies having become more energy efficient with each generation, the total OpEx of energy attributed to the network infrastructure has increased over the last 10 years in general. The growth in telco infrastructure related energy consumption has been driven by the consumer demand for broadband services in mobile and fixed including incredible increase in data center computing and storage requirements.
In general power consumption OpEx share of total technology cost amounts to 8% to 15% (i.e., for Telcos without heavy reliance of diesel). The general assumption is that with regular modernization, energy efficiency gain in newer electronics can keep growth in energy consumption to a minimum compensating for increased broadband and computing demand.
Note: Technology Opex (including NT & IT) on average lays between 18% to 25% of total corporate Telco Opex. Out of the Technology Opex between 8% to 15% (max) can typically be attributed to telco infrastructure energy consumption. The access & aggregation contribution to the energy cost typically would towards 80% plus. Data centers are expected to increasingly contribute to the power consumption and cost as well. Deep diving into the access equipment power consumption, ca. 60% can be attributed to rectifiers and amplifiers, 15% by the DC power system & miscellaneous and another 25% by cooling.
5G vision paper is very bullish in their requirement to reduce the total energy and its associated cost; it is stated “5G should support a 1,000 times traffic increase in the next 10 years timeframe, with an energy consumption by the whole network of only half that typically consumed by today’s networks. This leads to the requirement of an energy efficiency of x2,000 in the next 10 years timeframe.” (sub-section “4.6.2 Energy Efficiency” NGMN 5G White Paper).
This requirement would mean that in a pure 5G world (i.e., all traffic on 5G), the power consumption arising from the cellular network would be 50% of what is consumed today. In 2016 terms the Mobile-based Opex saving would be in the order of 5 Billion US$ to 10+ Billion US$ annually. This would be equivalent to 0.5% to 1.1% margin improvement globally (note: using GSMA 2016 Revenue & Growth data and Pyramid Research forecast). If energy price would increase over the next 10 years the saving / benefits would of course be proportionally larger.
As we have seen in the above, it is reasonable to expect a very considerable increase in cell density as the broadband traffic demand increases from peak bandwidth (i.e., 1 – 10 Gbps) and traffic density (i.e., 1 Tbps per km2) expectations.
Depending on the demanded traffic density, spectrum and carrier frequency available for 5G between 100 to 1,000 small cell sites per km2 could be required over the next 10 years. This cell site increase will be required in addition to existing macro-cellular network infrastructure.
Today (in 2017) an operator in EU28-sized country may have between ca. 3,500 to 35,000 cell sites with approx. 50% covering rural areas. Many analysts are expecting that for medium sized countries (e.g., with 3,500 – 10,000 macro cellular sites), operators would eventually have up-to 100,000 small cells under management in addition to their existing macro-cellular sites. Most of those 5G small cells and many of the 5G macro-sites we will have over the next 10 years, are also going to have advanced massive MiMo antenna systems with many active antenna elements per installed base antenna requiring substantial computing to gain maximum performance.
It appears with today’s knowledge extremely challenging (to put it mildly) to envision a 5G network consuming 50% of today’s total energy consumption.
It is highly likely that the 5G radio node electronics in a small cell environment (and maybe also in a macro cellular environment?) will consume less Joules per delivery bit (per second) due to technology advances and less transmitted power required (i.e., its a small or smallest cell). However, this power efficiency technology and network cellular architecture gain can very easily be destroyed by the massive additional demand of small, smaller and smallest cells combined with highly sophisticated antenna systems consuming additional energy for their compute operations to make such systems work. Furthermore, we will see operators increasingly providing sophisticated data center resources network operations as well as for the customers they serve. If the speed of light is insufficient for some services or country geographies, additional edge data centers will be introduced, also leading to an increased energy consumption not present in todays telecom networks. Increased computing and storage demand will also make the absolute efficiency requirement highly challenging.
Will 5G be able to deliver bits (per second) more efficiently … Yes!
Will 5G be able to reduce the overall power consumption of todays telecom networks with 50% … highly unlikely.
In my opinion the industry will have done a pretty good technology job if we can keep the existing energy cost at the level of today (or even allowing for unit price increases over the next 10 years).
The Total power reduction of our telecommunications networks will be one of the most important 5G development tasks as the industry cannot afford a new technology that results in waste amount of incremental absolute cost. Great relative cost doesn’t matter if it results in above and beyond total cost.
≥ 99.999% NETWORK AVAILABILITY & DATA CONNECTION RELIABILITY.
A network availability of 5Ns across all individual network elements and over time correspond to less than a second a day downtime anywhere in the network. Few telecom networks are designed for that today.
5 Nines (5N) is a great aspiration for services and network infrastructures. It also tends to be fairly costly and likely to raise the level of network complexity. Although in the 5G world of heterogeneous networks … well its is already complicated.
5N Network Availability.
From a network and/or service availability perspective it means that over the cause of the day, your service should not experience more than 0.86 seconds of downtime. Across a year the total downtime should not be more than 5 minutes and 16 seconds.
The way 5N Network Availability is define is “The network is available for the targeted communications in 99.999% of the locations where the network is deployed and 99.999% of the time”. (from “4.4.4 Resilience and High Availability”, NGMN 5G White Paper).
Thus in a 100,000 cell network only 1 cell is allowed experience a downtime and for no longer than less than a second a day.
It should be noted that there are not many networks today that come even close to this kind of requirement. Certainly in countries with frequent long power outages and limited ancillary backup (i.e., battery and/or diesel) this could be a very costly design requirement. Networks relying on weather-sensitive microwave radios for backhaul or for mm-wave frequencies 5G coverage would be required to design in a very substantial amount of redundancy to keep such high geographical & time availability requirements
In general designing a cellular access network for this kind of 5N availability could be fairly to very costly (i.e., Capex could easily run up in several percentage points of Revenue).
One way out from a design perspective is to rely on hierarchical coverage. Thus, for example if a small cell environment is un-available (=down!) the macro-cellular network (or overlay network) continues the service although at a lower service level (i.e., lower or much lower speed compared to the primary service). As also suggested in the vision paper making use of self-healing network features and other real-time measures are expected to further increase the network infrastructure availability. This is also what one may define as Network Resilience.
Nevertheless, the “NGMN 5G White Paper” allows for operators to define the level of network availability appropriate from their own perspective (and budgets I assume).
5N Data Packet Transmission Reliability.
The 5G vision paper, defines Reliability as “… amount of sent data packets successfully delivered to a given destination, within the time constraint required by the targeted service, divided by the total number of sent data packets.”. (“4.4.5 Reliability” in “NGMN 5G White Paper”).
It should be noted that the 5N specification in particular addresses specific use cases or services of which such a reliability is required, e.g., mission critical communications and ultra-low latency service. The 5G allows for a very wide range of reliable data connection. Whether the 5N Reliability requirement will lead to substantial investments or can be managed within the overall 5G design and architectural framework, might depend on the amount of traffic requiring 5Ns.
The 5N data packet transmission reliability target would impose stricter network design. Whether this requirement would result in substantial incremental investment and cost is likely dependent on the current state of existing network infrastructure and its fundamental design.
Hi,I check your blogs named “5G Economics – The Numbers (Appendix X). | techneconomyblog” on a regular basis.Your humoristic style is witty, keep it up! And you can look our website about اغانى.
These are some pretty serious economic numbers. How on earth did you fix this problem?
Pingback: top 10 hyip
Pingback: 5G Standalone – European Demand & Expectations (Part I). | techneconomyblog
Pingback: 5G Standalone – Network Slicing, a Bigger Slice of the Value Pie (Part II) | techneconomyblog
Pingback: 5G Standalone – European Demand & Expectations (Part I). | techneconomyblog