THE SPACE RACE IS ON.
If all current commercial satellite plans were to be realized within the next decade, we would have more, possibly substantially more, than 65 thousand satellites circling Earth. Today, that number is less than 10 thousand, with more than half that number realized by StarLink’s Low Earth Orbit (LEO) constellation over the last couple of years (i.e., since 2018).
While the “Arms Race” during the Cold War was “a thing” mainly between The USA and the former Soviet Union, the Space Race will, in my opinion, be “battled out” between the commercial interests of the West against the political interest of China (as illustrated in Figure 1 below). The current numbers strongly indicate that Europe, Canada, the Middle East, Africa, and APAC (minus China) will likely and largely be left on the sideline to watch the US and China impose, in theory, a “duopoly” in LEO satellite-based services. However, in practice, it will be a near-monopoly when considering security concerns between the West and the (re-defined) East block.

As of end of 2023, more than 50% of launched and planned commercial LEO satellites are USA-based. Of those, the largest fraction is accounted for by the US-based StarLink constellation (~75%). More than 30% are launched or planned by Chinese companies headed by the state-owned Guo Wang constellation rivaling Elon Musk’s Starlink in ambition and scale. Europe comes in at a distant number 3 with about 8% of the total of fixed internet satellites. Apart from being disappointed, alas, not surprised by the European track record, it is somewhat more baffling that there are so few Indian and African satellite (there are none) constellations given the obvious benefits such satellites could bring to India and the African continent.
India is a leading satellite nation with a proud tradition of innovative satellite designs and manufacturing and a solid track record of satellite launches. However, regarding commercial LEO constellations, India still needs to catch up on some opportunities here. Having previously worked on the economics and operationalizing a satellite ATC (i.e., a satellite service with an ancillary terrestrial component) internet service across India, it is mind-blowing (imo) how much economic opportunity there is to replace by satellite the vast terrestrial cellular infrastructure in rural India. Not to mention a quantum leap in communication broadband services resilience and availability that could be provided. According to the StarLink coverage map, the regulatory approval in India for allowing StarLink (US) services is still pending. In the meantime, Eutelsat’s OneWeb (EU) received regulatory approval in late 2023 for its satellite internet service over India in collaboration with Barthi Enterprises (India), that is also the largest shareholder in the recently formed Eutelsat Group with 21.2%. Moreover, Jio’s JioSpaceFiber satellite internet services were launched in several Indian states at the end of 2023, using the SES (EU) MEO O3b mPower satellite constellation. Despite the clear satellite know-how and capital available, it appears there is little activity for Indian-based LEO satellite development, taking up the competition with international operators.
The African continent is attracting all the major LEO satellite constellations such as StarLink (US), OneWeb (EU), Amazon Kuipers (US), and Telesat Lightspeed (CAN). However, getting regulatory approval for their satellite-based internet services is a complex, time-consuming, and challenging process with Africa’s 54 recognized sovereign countries. I would expect that we will see the Chinese-based satellite constellations (e.g., Guo Wang) taking up here as well due to the strong ties between China and several of the African nations.
This article is not about SpaceX’s StarLink satellite constellation. Although StarLink is mentioned a lot and used as an example. Recently, at the Mobile World Congress 2024 in Barcelona, talking to satellite operators (but not StarLink) providing fixed broadband satellite services, we joked about how long into a meeting we could go before SpaceX and StarLink would be mentioned (~ 5 minutes where the record, I think).
This article is about the key enablers (frequencies, frequency bandwidth, antenna design, …) that make up an LEO satellite service, the LEO satellite itself, the kind of services one should expect from it, and its limitations.
There is no doubt that LEO satellites of today have an essential mission: delivering broadband internet to rural and remote areas with little or no terrestrial cellular or fixed infrastructure to provide internet services. Satellites can offer broadband internet to remote areas with little population density and a population spread out reasonably uniformly over a large area. A LEO satellite constellation is not (in general) a substitute for an existing terrestrial communications infrastructure. Still, it can enhance it by increasing service availability and being an important remedy for business continuity in remote rural areas. Satellite systems are capacity-limited as they serve vast areas, typically with limited spectral resources and capacity per unit area.
In comparison, we have much smaller coverage areas with demand-matched spectral resources in a terrestrial cellular network. It is also easier to increase capacity in a terrestrial cellular system by adding more sectors or increasing the number of sites in an area that requires such investments. Adding more cells, and thus increasing the system capacity, to satellite coverage requires a new generation of satellites with more advanced antenna designs, typically by increasing the number of phased-array beams and more complex modulation and coding mechanisms that boost the spectral efficiency, leading to increased capacity and quality for the services rendered to the ground. Increasing the system capacity of a cellular communications system by increasing the number of cells (i.e., cell splitting) works the same in satellite systems as it does for a terrestrial cellular system.
So, on average, LEO satellite internet services to individual customers (or households), such as those offered by StarLink, are excellent for remote, lowly populated areas with a nicely spread-out population. If we de-average this statement. Clearly, within the satellite coverage area, we may have towns and settlements where, locally, the population density can be fairly large despite being very small over the larger footprint covered by the satellite. As the capacity and quality of the satellite is a shared resource, serving towns and settlements of a certain size may not be the best approach to providing a sustainable and good customer experience as the satellite resources exhaust rapidly in such scenarios. In such scenarios, a hybrid architecture is of much better use as well as providing all customers in a town or settlement with the best service possible leveraging the existing terrestrial communications infrastructure, cellular as well as fixed, with that of a satellite backhaul broadband connection between a satellite ground gateway and the broadband internet satellite. This is offered by several satellite broadband providers (both from GEO, MEO and LEO orbits) and has the beauty of not only being limited to one provider. Unfortunately, this particular finesse, is often overlooked by the awe of massive scale of the StarLink constellation.
AND SO IT STARTS.
When I compared the economics of stratospheric drone-based cellular coverage with that of LEO satellites and terrestrial-based cellular networks in my previous article, “Stratospheric Drones: Revolutionizing Terrestrial Rural Broadband from the Skies?”, it was clear that even if LEO satellites are costly to establish, they provide a substantial cost advantage over cellular coverage in rural and remote areas that are either scarcely covered or not at all. Although the existing LEO satellite constellations have limited capacity compared to a terrestrial cellular network and would perform rather poorly over densely populated areas (e.g., urban and suburban areas), they can offer very decent fixed-wireless-access-like broadband services in rural and remote areas at speeds exceeding even 100 Mbps, such as shown by the Starlink constellation. Even if the provided speed and capacity is likely be substantially lower than what a terrestrial cellular network could offer, it often provides the missing (internet) link. Anything larger than nothing remains infinitely better.
Low Earth Orbit (LEO) satellites represent the next frontier in (novel) communication network architectures, what we in modern lingo would call non-terrestrial networks (NTN), with the ability to combine both mobile and fixed broadband services, enhancing and substituting terrestrial networks. The LEO satellites orbit significantly closer to Earth than their Geostationary Orbit (GEO) counterparts at 36 thousand kilometers, typically at altitudes between 300 to 2,000 kilometers, LEO satellites offer substantially reduced latency, higher bandwidth capabilities, and a more direct line of sight to receivers on the ground. It makes LEO satellites an obvious and integral component of non-terrestrial networks, which aim to extend the reach of existing fixed and mobile broadband services, particularly in rural, un-and under-served, or inaccessible regions as a high-availability element of terrestrial communications networks in the event of natural disasters (flooding, earthquake, …), or military conflict, in which the terrestrial networks are taken out of operation.
Another key advantage of LEO satellite is that the likelihood of a line-of-sight (LoS) to a point on the ground is very high compared to establishing a LoS for terrestrial cellular coverage that, in general, would be very low. In other words, the signal propagation from a LEO satellite closely approximates that of free space. Thus, all the various environmental signal loss factors we must consider for a standard terrestrial-based cellular mobile network do not apply to our satellite with signal propagation largely being determined by the distance between the satellite and the ground (see Figure 2).

Low Earth Orbit (LEO) satellites, compared to GEO and MEO-based higher-altitude satellite systems, in general, have simpler designs and smaller sizes, weights, and volumes. Their design and architecture are not just a function of technological trends but also a manifestation of their operational environment. The (relative) simplicity of LEO satellites also allows for more standardized production, allowing for off-the-shelf components and modular designs that can be manufactured in larger quantities, such as the case with CubeSats standard and SmallSats in general. The lower altitude of LEO satellites translates to a reduced distance from the launch site to the operational orbit, which inherently affects the economics of satellite launches. This proximity to Earth means that the energy required to propel a satellite into LEO is significantly less than needed to reach Geostationary Earth Orbit (GEO), resulting in lower launch costs.
The advent of LEO satellite constellations marks an important shift in how we approach global connectivity. With the potential to provide ubiquitous internet coverage in rural and remote places with little or no terrestrial communications infrastructure, satellites are increasingly being positioned as vital elements in global communication. The LEO satellites, as well as stratospheric drones, have the ability to provide economical internet access, as addressed in my previous article, in remote areas and play a significant role in disaster relief efforts. For example, when terrestrial communication networks may be disrupted after a natural disaster, LEO satellites can quickly re-establish communication links to normal cellular devices or ad-how earth-based satellite systems, enabling efficient coordination of rescue and relief operations. Furthermore, they offer a resilient network backbone that complements terrestrial infrastructure.
The Internet of Things (IoT) benefits from the capabilities of LEO satellites. Particular in areas where there is little or no existing terrestrial communications networks. IoT devices often operate in remote or mobile environments, from sensors in agricultural fields to trackers across shipping routes. LEO satellites provide reliable connectivity to IoT networks, facilitating many applications, such as non- and near real-time monitoring of environmental data, seamless asset tracking over transcontinental journeys, and rapid deployment of smart devices in smart city infrastructures. As an example, let us look at the minimum requirements for establishing a LEO satellite constellation that can gather IoT measurements. At an altitude of 550 km the satellite would take ca. 1.5 hour to return to a given point on its orbit. Earth rotates (see also below) which require us to deploy several orbital planes to ensure that we have continuous coverage throughout the 24 hours of a day (assuming this is required). Depending on the satellite antenna design, the target coverage area, and how often a measurement is required, a satellite constellation to support an IoT business may not require much more than 20 (lower measurement frequency) to 60 (higher measurement frequency, but far from real real-time data collection) LEO satellites (@ 550 km).
For defense purposes, LEO satellite systems present unique advantages. Their lower orbits allow for high-resolution imagery and rapid data collection, which are crucial for surveillance, reconnaissance, and operational awareness. As typically more LEO satellites will be required, compared to a GEO satellite, such systems also offer a higher degree of redundancy in case of anti-satellite (ASAT) warfare scenarios. When integrated with civilian applications, military use cases can leverage the robust commercial infrastructure for communication and geolocation services, enhancing capabilities while distributing the system’s visibility and potential targets.
Standalone military LEO satellites are engineered for specific defense needs. These may include hardened systems for secure communication, resistance to jamming, and interception. For instance, they can be equipped with advanced encryption algorithms to ensure secure transmission of sensitive military data. They also carry tailored payloads for electronic warfare, signal intelligence, and tactical communications. For example, they can host sensors for detecting and locating enemy radar and communication systems, providing a significant advantage in electronic warfare. As the line between civilian and military space applications blurs, dual-use LEO satellite systems are emerging, capable of serving civilian broadband and specialized military requirements. It should be pointed out that there also military applications, such as signal gathering, that may not be compatible with civil communications use cases.
In a military conflict, the distributed architecture and lower altitude of LEO constellations may offer some advantages regarding resilience and targetability compared to GEO and MEO-based satellites. Their more significant numbers (i.e., 10s to 1000s) compared to GEO, and the potential for quicker orbital resupply can make them less susceptible to complete system takedown. However, their lower altitudes could make them accessible to various ASAT technologies, including ground-based missiles or space-based kinetic interceptors.
It is not uncommon to encounter academic researchers and commentators who give the impression that LEO satellites could replace existing terrestrial-based infrastructures and solve all terrestrial communications issues known to man. That is (of course) not the case. Often, such statements appears to be based an incomplete understanding of the capacity limitation of satellite systems. Due to satellites’ excellent coverage with very large terrestrial footprints, the satellite capacity is shared over very large areas. For example, consider an LEO satellite at 550 km altitude. The satellite footprint, or coverage area (aka ground swath), is the area on the Earth’s surface over which the satellite can establish a direct line of sight. The satellite footprint in our example diameter would be ca. five thousand five hundred kilometers. An equivalent area of ca. 23 million square kilometers is more than twice that of the USA (or China or Canada). Before you get too excited, the satellite antenna will typically restrict the surface area the satellite will cover. The extent of the observable world that is seen at any given moment by the satellite antenna is defined as the Field of View (FoV) and can vary from a few degrees (narrow beams, small coverage area) to 40 degrees or higher (wide beams, large coverage areas). At a FoV of 20 degrees, the antenna footprint would be ca. 2 thousand 400 kilometers, equivalent to a coverage area of ca. 5 million square kilometers.
In comparison, for a FoV of 0.8 degrees, the antenna footprint would only be 100 kilometers. If our satellite has a 16-satellite beam capability, it would translate into a coverage diameter of 24 km per beam. For the StarLink system based on the Ku-band (13 GHz) and a cell downlink (Satellite-to-Earth) capacity of ca. 680 Mbps (in 250 MHz) we would have ca. 2 Mbps per km2 unit coverage area. Compared to a terrestrial rural cellular site with 85 MHz (Downlink, Base station antenna to customer terminal), it would deliver 10+ Mbps per km2 unit coverage area.
It is always good to keep in mind that “Satellites mission is not to replace terrestrial communications infrastructures but supplement and enhance them”, and furthermore, “Satellites offer the missing (internet) link in areas where there is no terrestrial communications infrastructure present”. Satellites offer superior coverage to any terrestrial communications infrastructure. Satellites limitations are in providing capacity, and quality, at population scale as well as supporting applications and access technologies requiring very short latencies (e.g., smaller than 10 ms).
In the following, I will focus on terrestrial cellular coverage and services that LEO satellites can provide. At the end of my blog, I hope I have given you (the reader) a reasonable understanding of how terrestrial coverage, capacity, and quality work in a (LEO) satellite system and have given you an impression of key parameters we can add to the satellite to improve those.
EARTH ROTATES, AND SO DO SATELLITES.
Before getting into the details of low earth orbit satellites, let us briefly get a couple of basic topics off the table. Skipping this part may be a good option if you are already into and in the know satellites. Or maybe carry on an get a good laugh of those terra firma cellular folks that forgot about the rotation of Earth 😉
From an altitude and orbit (around Earth) perspective, you may have heard of two types of satellites: The GEO and the LEO satellites. Geostationary (GEO) satellites are positioned in a geostationary orbit at ~36 thousand kilometers above Earth. That the satellite is geostationary means it rotates with the Earth and appears stationary from the ground, requiring only one satellite to maintain constant coverage over an area that can be up to one-third of Earth’s surface. Low Earth Orbit (LEO) satellites are positioned at an altitude between 300 to 2000 kilometers above Earth and move relative to the Earth’s surface at high speeds, requiring a network or constellation to ensure continuous coverage of a particular area.
I have experienced that terrestrial cellular folks (like myself) when first thinking about satellite coverage are having some intuitive issues with satellite coverage. “We are not used to our antennas moving away from the targeted coverage area, and our targeted coverage area, too, is moving away from our antenna“. The geometry and dynamics of terrestrial cellular coverage are simpler than they are for satellite-based coverage. For LEO satellite network planners, it is not rocket science (pun intended) that the satellites move around in their designated orbit over Earth at orbital speeds of ca. 70 to 80 km per second. Thus, at an altitude of 500 km, a LEO satellite orbits Earth approximately every 1.5 hours. Earth, thankfully, rotates. Compared to its GEO satellite “cousin,” the LEO satellite ” is not “stationary” from the perspective of the ground. Thus, as Earth rotates, the targeted coverage area moves away from the coverage provided by the orbital satellite.
We need several satellites in the same orbit and several orbits (i.e., orbital planes) to provide continuous satellite coverage of a target area. This is very different from terrestrial cellular coverage of a given area (needles to say).
WHAT LEO SATELLITES BRING TO THE GROUND.
Anything is infinitely more than nothing. The Low Earth Orbit satellite brings the possibility of internet connectivity where there previously was nothing, either because too few potential customers spread out over a large area made terrestrial-based services hugely uneconomical or the environment is too hostile to build normal terrestrial networks within reasonable economics.

The LEO satellites represent a transformative shift in internet connectivity, providing advantages over traditional cellular and fixed broadband networks, particularly for global access, speed, and deployment capabilities. As described in “Stratospheric Drones: Revolutionizing Terrestrial Rural Broadband from the Skies?”, LEO satellite constellations, or networks, may also be significantly more economical than equivalent cellular networks in rural and remote areas where the economics of coverage by satellite, as depicted in the above Figure 3, is by far better than by traditional terrestrial cellular means.
One of the foremost benefits of LEO satellites is their ability to offer global coverage as well as reasonable broadband and latency performance that is difficult to match with GEO and MEO satellites. The GEO stationary satellite obviously also offers global broadband coverage, the unit coverage being much more extensive than for a LEO satellite, but it is not possible to offer very low latency services, and it is more difficult to provide high data rates (in comparison to a LEO satellite). LEO satellites can reach the most remote and rural areas of the world, places where laying cables or setting up cell towers is impractical. This is a crucial step in delivering communications services where none exist today, ensuring that underserved populations and regions gain access to internet connectivity.
Another significant advantage is the reduction in latency that LEO satellites provide. Since they orbit much closer to Earth, typically at an altitude between 350 to 700 km, compared to their geostationary counterparts that are at 36 thousand kilometers altitude, the time it takes for a communications signal to travel between the user and the satellite is significantly reduced. This lower latency is crucial for enhancing the user experience in real-time applications such as video calls and online gaming, making these activities more enjoyable and responsive.
An inherent benefit of satellite constellations is their ability for quick deployment. They can be deployed rapidly in space, offering a quicker solution to achieving widespread internet coverage than the time-consuming and often challenging process of laying cables or erecting terrestrial infrastructure. Moreover, the network can easily be expanded by adding more satellites, allowing it to dynamically meet changing demand without extensive modifications on the ground.
LEO satellite networks are inherently scalable. By launching additional satellites, they can accommodate growing internet usage demands, ensuring that the network remains efficient and capable of serving more users over time without significant changes to ground infrastructure.
Furthermore, these satellite networks offer resilience and reliability. With multiple satellites in orbit, the network can maintain connectivity even if one satellite fails or is obstructed, providing a level of redundancy that makes the network less susceptible to outages. This ensures consistent performance across different geographical areas, unlike terrestrial networks that may suffer from physical damage or maintenance issues.
Another critical advantage is (relative) cost-effectiveness compared to a terrestrial-based cellular network. In remote or hard-to-reach areas, deploying satellites can be more economical than the high expenses associated with extending terrestrial broadband infrastructure. As satellite production and launch costs continue to decrease, the economics of LEO satellite internet become increasingly competitive, potentially reducing the cost for end-users.
LEO satellites offer a promising solution to some of the limitations of traditional connectivity methods. By overcoming geographical, infrastructural, and economic barriers, LEO satellite technology has the potential to not just complement but effectively substitute terrestrial-based cellular and fixed broadband services, especially in areas where such services are inadequate or non-existent.
Figure 4 below provides an overview of LEO satellite coverage with fixed broadband services offered to customers in the Ku band with a Ka backhaul link to ground station GWs that connect to, for example, the internet. Having inter-satellite communications (e.g., via laser links such as those used by Starlink satellites as per satellite version 1.5) allows for substantially less ground-station gateways. Inter-satellite laser links between intra-plane satellites are a distinct advantage in ensuring coverage for rural and remote areas where it might be difficult, very costly, and impractical to have a satellite ground station GW to connect to due to the lack of global internet infrastructure.

Inter-satellite laser links (ISLLs), or, as it is also called Optical Inter-satellite Links (OISK), are an advanced communication technology utilized by satellite constellations, such as for example Starlink, to facilitate high-speed secure data transmission directly between satellites. Inter-satellite laser links are today (primarily) designed for intra-plane communication within satellite constellations, enabling data transfer between satellites that share the same orbital plane. This is due to the relatively stable geometries and predictable distances between satellites in the same orbit, which facilitate maintaining the line-of-sight connections necessary for laser communications. ISLLs mark a significant departure from traditional reliance on ground stations for inter-satellite communication, and as such the ISL offers many benefits, including the ability to transmit data at speeds comparable to fiber-optic cables. Additionally, ISLLs enable satellite constellations to deliver seamless coverage across the entire planet, including over oceans and polar regions where ground station infrastructure is limited or non-existent. The technology also inherently enhances the security of data transmissions, thanks to the focused nature of laser beams, which are difficult to intercept.
However, the deployment of ISLLs is not without challenges. The technology requires a clear line of sight between satellites, which can be affected by their orbital positions, necessitating precise control mechanisms. Moreover, the theoretical limit to the number of satellites linked in a daisy chain is influenced by several factors, including the satellite’s power capabilities, the network architecture, and the need to maintain clear lines of sight. High-power laser systems also demand considerable energy, impacting the satellite’s power budget and requiring efficient management to balance operational needs. The complexity and cost of developing such sophisticated laser communication systems, combined with very precise pointing mechanisms and sensitive detectors, can be quite challenging and need to be carefully weighted against building satellite ground stations.
Cross-plane ISLL transmission, or the ability to communicate between satellites in different orbital planes, presents additional technical challenges, as it is technically highly challenging to maintain a stable line of sight between satellites moving in different orbital planes. However, the potential for ISLLs to support cross-plane links is recognized as a valuable capability for creating a fully interconnected satellite constellation. The development and incorporation of cross-plane ISLL capabilities into satellites are an area of active research and development. Such capabilities would reduce the reliance on ground stations and significantly increase the resilience of satellite constellations. I see the development as a next-generation topic together with many other important developments as described in the end of this blog. However, the power consumption of the ISLL is a point of concern that needs careful attention as it will impact many other aspects of the satellite operation.
THE DIGITAL DIVIDE.
The digital divide refers to the “internet haves and haves not” or “the gap between individuals who have access to modern information and communication technology (ICT),” such as the internet, computers, and smartphones, and those who do not have access. This divide can be due to various factors, including economic, geographic, age, and educational barriers. Essentially, as illustrated in Figure 5, it’s the difference between the “digitally connected” and the “digitally disconnected.”.
The significance of the digital divide is considerable, impacting billions of people worldwide. It is estimated that a little less than 40% of the world’s population, or roughly 2.9 billion people, had never used the internet (as of 2023). This gap is most pronounced in developing countries, rural areas, and among older populations and economically disadvantaged groups.
The digital divide affects individuals’ ability to access information, education, and job opportunities and impacts their ability to participate in digital economies and the modern social life that the rest of us (i.e., the other side of the divide or the privileged 60%) have become used to. Bridging this divide is crucial for ensuring equitable access to technology and its benefits, fostering social and economic inclusion, and supporting global development goals.

CHALLENGES WITH LEO SATELLITE SOLUTIONS.
Low-Earth-orbit satellites offer compelling advantages for global internet connectivity, yet they are not without challenges and disadvantages when considered substitutes for cellular and fixed broadband services. These drawbacks underscore the complexities and limitations of deploying LEO satellite technology globally.
The capital investment required and the ongoing costs associated with designing, manufacturing, launching, and maintaining a constellation of LEO satellites are substantial. Despite technological advancements and increased competition driving costs down, the financial barrier to entry remains high. Compared to their geostationary counterparts, the relatively short lifespan of LEO satellites necessitates frequent replacements, further adding to operational expenses.
While LEO satellites offer significantly reduced latency (round trip times, RTT ~ 4 ms) compared to geostationary satellites (RTT ~ 240 ms), they may still face latency and bandwidth limitations, especially as the number of users on the satellite network increases. This can lead to reduced service quality during peak usage times, highlighting the potential for congestion and bandwidth constraints. This is also the reason why the main business model of LEO satellite constellations is primarily to address coverage and needs in rural and remote locations. Alternatively, the LEO satellite business model focuses on low-bandwidth needs such as texting, voice messaging, and low-bandwidth Internet of Things (IoT) services.
Navigating the regulatory and spectrum management landscape presents another challenge for LEO satellite operators. Securing spectrum rights and preventing signal interference requires coordination across multiple jurisdictions, which can complicate deployment efforts and increase the complexity of operations.
The environmental and space traffic concerns associated with deploying large numbers of satellites are significant. The potential for space debris and the sustainability of low Earth orbits are critical issues, with collisions posing risks to other satellites and space missions. Additionally, the environmental impact of frequent rocket launches raises further concerns.
FIXED-WIRELESS ACCESS (FWA) BASED LEO SATELLITE SOLUTIONS.
Using the NewSpace Index database, updated December 2023, there are currently more than 6,463 internet satellites launched, of which 5,650 (~87%) from StarLink, and 40,000+ satellites planned for launch, with SpaceX’s Starlink satellites having 11,908 planned (~30%). More than 45% of the satellites launched and planned support multi-application use cases. Thus internet, together with, for example, IoT (~4%) and/or Direct-2-Device (D2D, ~39%). The D2D share is due to StarLink’s plans to provide services to mobile terminals with their latest satellite constellation. The first six StarLink v2 satellites with direct-to-cellular capability were successfully launched on January 2nd, 2024. Some care should be taken in the share of D2D satellites in the StarLink number as it does not consider the different form factors of the version 2 satellite that do not all include D2D capabilities.
Most LEO satellites, helped by StarLink satellite quantum, operational and planned, support satellite fixed broadband internet services. It is worth noting that the Chinese Guo Wang constellation ranks second in terms of planned LEO satellites, with almost 13,000 planned, rivaling the StarLink constellation. After StarLink and Guo Wang are counted there is only 34% or ca. 16,000 internet satellites left in the planning pool across 30+ satellite companies. While StarLink is privately owned (by Elon Musk), the Guo Wang (國網 ~ “The state network”) constellation is led by China SatNet and created by the SASAC (China’s State-Owned Assets Supervision and Administration Commission). SASAC oversees China’s biggest state-owned enterprises. I expect that such an LEO satellite constellation, which would be the second biggest LEO constellation, as planned by Guo Wang and controlled by the Chinese State, would be of considerable concern to the West due to the possibility of dual-use (i.e., civil & military) of such a constellation.
StarLink coverage as of March 2024 (see StarLink’s availability map) does not provide services in Russia, China, Iran, Iraq, Afghanistan, Venezuela, and Cuba (20% of Earth’s total land base surface area). There are still quite a few countries in Africa and South-East Asia, including India, where regulatory approval remains pending.

While the term FWA, fixed wireless access, is not traditionally used to describe satellite internet services, the broadband services offered by LEO satellites can be considered a form of “wireless access” since they also provide connectivity without cables or fiber. In essence, LEO satellite broadband is a complementary service to traditional FWA, extending wireless broadband access to locations beyond the reach of terrestrial networks. In the following, I will continue to use the term FWA for the fixed broadband LEO satellite services provided to individual customers, including SMEs. As some of the LEO satellite businesses eventually also might provide direct-to-device (D2D) services to normal terrestrial mobile devices, either on their own acquired cellular spectrum or in partnership with terrestrial cellular operators, the LEO satellite operation (or business architecture) becomes much closer to terrestrial cellular operations.

Low Earth Orbit (LEO) satellite services like Starlink have emerged to provide fixed broadband internet to individual consumers and small to medium-sized enterprises (SMEs) targeting rural and remote areas often where no other broadband solutions are available or with poor legacy copper- or coax-based infrastructure. These services deploy constellations of satellites orbiting close to Earth to offer high-speed internet with the significant advantage of reaching rural and remote areas where traditional ground-based infrastructure is absent or economically unfeasible.
One of the most significant benefits of LEO satellite broadband is the ability to deliver connectivity with lower latency compared to traditional satellite internet delivered by geosynchronous satellites, enhancing the user experience for real-time applications. The rapid deployment capability of these services also means that areas in dire need of internet access can be connected much quicker than waiting for ground infrastructure development. Additionally, satellite broadband’s reliability is less affected by terrestrial challenges, such as natural disasters that can disrupt other forms of connectivity.
The satellite service comes with its challenges. The cost of user equipment, such as satellite dishes, can be a barrier for some users. So, can the installation process be of the terrestrial satellite dish required to establish the connection to the satellite. Moreover, services might be limited by data caps or experience slower speeds after reaching certain usage thresholds, which can be a drawback for users with high data demands. Weather conditions can also impact the signal quality, particularly at the higher frequencies used by the satellite, albeit to a lesser extent than geostationary satellite services. However, the target areas where the fixed broadband satellite service is most suited are rural and remote areas that either have no terrestrial broadband infrastructure (terrestrial cellular broadband or wired broadband such as coax or fiber)
Beyond Starlink, other providers are venturing into the LEO satellite broadband market. OneWeb is actively developing a constellation to offer internet services worldwide, focusing on communities that are currently underserved by broadband. Telesat Lightspeed is also gearing up to provide broadband services, emphasizing the delivery of high-quality internet to the enterprise and government sectors.
Other LEO satellite businesses, such as AST SpaceMobile and Lynk Mobile, are taking a unique approach by aiming to connect standard mobile phones directly to their satellite network, extending cellular coverage beyond the reach of traditional cell towers. More about that in the section below (see “New Kids on the Block – Direct-to-Devices LEO satellites”).
I have been asked why I appear somewhat dismissive of the Amazon’s Project Kuiper in a previous version of article particular compared to StarLink (I guess). The expressed mission is to “provide broadband services to unserved and underserved consumers, businesses in the United States, …” (FCC 20-102). Project Kuiper plans for a broadband constellation of 3,226 microsatellites at 3 altitudes (i.e., orbital shells) around 600 km providing fixed broadband services in the Ka-band (i.e.,~ 17-30 GHz). In its US-based FCC (Federal Communications Commission) filling and in the subsequent FCC authorization it is clear that the Kuiper constellation primarily targets contiguous coverage of the USA (but mentions that services cannot be provided in the majority of Alaska, … funny I thought that was a good definition of a underserved remote and scarcely populated area?). Amazon has committed to launch 50% (1,618 satellites) of their committed satellites constellation before July 2026 (until now 2+ has been launched) and the remaining 50% before July 2029. There is however far less details on the Kuiper satellite design, than for example is available for the various versions of the StarLink satellites. Given the Kuiper will operate in the Ka-band there may be more frequency bandwidth allocated per beam than possible in the StarLink satellites using the Ku-band for customer device connectivity. However, Ka-band is at a higher frequency which may result in a more compromised signal propagation. In my opinion based on the information from the FCC submissions and correspondence, the Kuiper constellation appear less ambitious compared to StarLink vision, mission and tangible commitment in terms of aggressive launches, very high level of innovation and iterative development on their platform and capabilities in general. This may of course change over time and as more information becomes available on the Amazon’s Project Kuiper.
FWA-based LEO satellite solutions – takeaway:
- LoS-based and free-space-like signal propagation allows high-frequency signals (i.e., high throughput, capacity, and quality) to provide near-ideal performance only impacted by the distance between the antenna and the ground terminal. Something that is, in general, not possible for a terrestrial-based cellular infrastructure.
- Provides satellite fixed broadband internet connectivity typically using the Ku-band in geographically isolated locations where terrestrial broadband infrastructure is limited or non-existent.
- Lower latency (and round trip time) compared to MEO and GEO satellite internet solutions.
- Current systems are designed to provide broadband internet services in scarcely populated areas and underserved (or unserved) regions where traditional terrestrial-based communications infrastructures are highly uneconomical and/or impractical to deploy.
- As shown in my previous article (i.e., “Stratospheric Drones: Revolutionizing Terrestrial Rural Broadband from the Skies?”), LEO satellite networks may be an economical interesting alternative to terrestrial rural cellular networks in countries with large scarcely populated rural areas requiring tens of thousands of cellular sites to cover. Hybrid models with LEO satellite FWA-like coverage to individuals in rural areas and with satellite backhaul to major settlements and towns should be considered in large geographies.
- Resilience to terrestrial disruptions is a key advantage. It ensures functionality even when ground-based infrastructure is disrupted, which is an essential element for maintaining the Business Continuity of an operator’s telecommunications services. Particular hierarchical architectures with for example GEO-satellite, LEO satellite and Earth-based transport infrastructure will result in very high reliability network operations (possibly approaching ultra-high availability, although not with service parity).
- Current systems are inherently capacity-limited due to their vast coverage areas (i.e., lower performance per unit coverage area). In the peak demand period, they will typically perform worse than terrestrial-based cellular networks (e.g., LTE or 5G).
- In regions where modern terrestrial cellular and fixed broadband services are already established, satellite broadband may face challenges competing with these potentially cheaper, faster, and more reliable services, which are underpinned by the terrestrial communications infrastructure.
- It is susceptible to weather conditions, such as heavy rain or snow, which can degrade signal quality. This may impact system capacity and quality, resulting in inconsistent customer experience throughout the year.
- Must navigate complex regulatory environments in each country, which can affect service availability and lead to delays in service rollout.
- Depending on the altitude, LEO satellites are typically replaced on a 5—to 7-year cycle due to atmospheric drag (which increases as altitude decreases; thus, the lower the altitude, the shorter a satellite’s life). This ultimately means that any improvements in system capacity and quality will take time to be thoroughly enjoyed by all customers.
SATELLITE BACKHAUL SOLUTIONS.

LEO satellites providing backhaul connectivity, such as shown in Figure 8 above, are extending internet services to the farthest reaches of the globe. These satellites offer many benefits, as already discussed above, in connecting remote, rural, and previously un- and under-served areas with reliable internet services. Many remote regions lack foundational telecom infrastructure, particularly long-haul transport networks needed for carrying traffic away from remote populated areas. Satellite backhauls do not only offer a substantially better financial solution for enhancing internet connectivity to remote areas but are often the only viable solution for connectivity.
Take, for example, Greenland. The world’s largest non-continental island, the size of Western Europe, is characterized by its sparse population and distinct unconnected by road settlement patterns mainly along the West Coast (as well as a couple of settlements on the East Coast), influenced mainly by its vast ice sheets and rugged terrain. With a population of around 56+ thousand, primarily concentrated on the west coast, Greenland’s demographic distribution is spread out over ca. 50+ settlements and about 20 towns. Nuuk, the capital, is the island’s most populous city, housing over 18+ thousand residents and serving as the administrative, economic, and cultural hub. Terrestrial cellular networks serve settlements’ and towns’ communication and internet services needs, with the traffic carried back to the central switching centers by long-haul microwave links, sea cables, and satellite broadband connectivity. Several settlements connectivity needs can only be served by satellite backhaul, e.g., settlements on the East Coast (e.g., Tasiilaq with ca. 2,000 inhabitants and Ittoqqotooormiit (an awesome name!) with around 400+ inhabitants). LEO satellite backhaul solutions serving Satellite-only communities, such as those operated and offered by OneWeb (Eutelsat), could provide a backhaul transport solution that would match FWA latency specifications due to better (round trip time) performance than that of a GEO satellite backhaul solution.
It should also be clear that remote satellite-only settlements and towns may have communications service needs and demand that a localized 4G (or 5G) terrestrial cellular network with a satellite backhaul can serve much better than, for example, relying on individual ad-hoc connectivity solution from for example Starlink. When the area’s total bandwidth demand exceeds the capacity of an FWA satellite service, a localized terrestrial network solution with a satellite backhaul is, in general, better.
The LEO satellites should offer significantly reduced latency compared to their geostationary counterparts due to their closer proximity to the Earth. This reduction in delay is essential for a wide range of real-time applications and services, from adhering to modern radio access (e.g., 4G and 5G) requirements, VoIP, and online gaming to critical financial transactions, enhancing the user experience and broadening the scope of possible services and business.
Among the leading LEO satellite constellations providing backhaul solutions today are SpaceX’s Starlink (via their community gateway), aiming to deliver high-speed internet globally with a preference of direct to consumer connectivity; OneWeb, focusing on internet services for businesses and communities in remote areas; Telesat’s Lightspeed, designed to offer secure and reliable connectivity; and Amazon’s Project Kuiper, which plans to deploy thousands of satellites to provide broadband to unserved and underserved communities worldwide.
Satellite backhaul solutions – takeaway:
- Satellite-backhaul solutions are excellent, cost-effective solution for providing an existing isolated cellular (and fixed access) network with high-bandwidth connectivity to the Internet (such as in remote and deep rural areas).
- LEO satellites can reduce the need for extensive and very costly ground-based infrastructure by serving as a backhaul solution. For some areas, such as Greenland, the Sahara, or the Brazilian rainforest, it may not be practical or economical to connect by terrestrial-based transmission (e.g., long-haul microwave links or backbone & backhaul fiber) to remote settlements or towns.
- An LEO-based backhaul solution supports applications and radio access technologies requiring a very low round trip time scale (RTT<50 ms) than is possible with a GEO-based satellite backhaul. However, the optimum RTT will depend on where the LEO satellite ground gateway connects to the internet service provider and how low the RTT can be.
- The collaborative nature of a satellite-backhaul solution allows the terrestrial operator to focus on and have full control of all its customers’ network experiences, as well as optimize the traffic within its own network infrastructure.
- LEO satellite backhaul solutions can significantly boost network resilience and availability, providing a secure and reliable connectivity solution.
- Satellite-backhaul solutions require local ground-based satellite transmission capabilities (e.g., a satellite ground station).
- The operator should consider that at a certain threshold of low population density, direct-to-consumer satellite services like Starlink might be more economical than constructing a local telecom network that relies on satellite backhaul (see above section on “Fixed Wireless Access (FWA) based LEO satellite solutions”).
- Satellite backhaul providers require regulatory permits to offer backhaul services. These permits are necessary for several reasons, including the use of radio frequency spectrum, operation of satellite ground stations, and provision of telecommunications services within various jurisdictions.
- The Satellite life-time in orbit is between 5 to 7 years depending on the LEO altitude. A MEO satellite (2 to 36 thousand km altitude) last between 10 to 20 years (GEO). This also dictates the modernization and upgrade cycle as well as timing of your ROI investment case and refinancing needs.
NEW KIDS ON THE BLOCK – DIRECT-TO-DEVICE LEO SATELLITES.
A recent X-exchange (from March 2nd):
Elon Musk: “SpaceX just achieved peak download speed of 17 Mb/s from a satellite direct to unmodified Samsung Android Phone.” (note: the speed correspond to a spectral efficiency of ~3.4 Mbps/MHz/beam).
Reply from user: “That’s incredible … Fixed wireless networks need to be looking over their shoulders?”
Elon Musk: “No, because this is the current peak speed per beam and the beams are large, so this system is only effective where there is no existing cellular service. This services works in partnership with wireless providers, like what @SpaceX and @TMobile announced.”

Low Earth Orbit (LEO) Satellite Direct-to-Device technology enables direct communication between satellites in orbit and standard mobile devices, such as smartphones and tablets, without requiring additional specialized hardware. This technology promises to extend connectivity to remote, rural, and underserved areas globally, where traditional cellular network infrastructure is absent or economically unfeasible to deploy. The system can offer lower latency communication by leveraging LEO satellites, which orbit closer to Earth than geostationary satellites, making it more practical for everyday use. The round trip time (RTT), the time it takes the for the signal to travel from the satellite to the mobile device and back, is ca. 4 milliseconds for a LEO satellite at 550 km compared to ca. 240 milliseconds for a geosynchronous satellite (at 36 thousand kilometers altitude).
The key advantage of a satellite in low Earth orbit is that the likelihood of a line-of-sight to a point on the ground is very high compared to establishing a line-of-sight for terrestrial cellular coverage that, in general, would be very low. In other words, the cellular signal propagation from a LEO satellite closely approximates that of free space. Thus, all the various environmental signal loss factors we must consider for a standard terrestrial-based mobile network do not apply to our satellite. In other, more simplistic words, the signal propagation directly from the satellite to the mobile device is less compromised than it typically would be from a terrestrial cellular tower to the same mobile device. The difference between free-space propagation, which considers only distance and frequency, and the terrestrial signal propagation models, which quantifies all the gains and losses experienced by a terrestrial cellular signal, is very substantial and in favor of free-space propagation. As our Earth-bound cellular intuition of signal propagation often gets in the way of understanding the signal propagation from a satellite (or antenna in the sky in general), I recommend writing down the math using the formula of free space propagation loss and comparing this with terrestrial cellular link budget models, such as for example the COST 231-Hata Model (relatively simple) or the more recent 3GPP TR 38.901 Model (complex). In rural and sub-urban areas, depending on the environment, in-door coverage may be marginally worse, fairly similar, or even better than from terrestrial cell tower at a distance. This applies to both the uplink and downlink communications channel between the mobile device and the LEO satellite, and is also the reason why higher frequency (with higher frequency bandwidths available) use on LEO satellites can work better than in a terrestrial cellular network.
However, despite its potential to dramatically expand coverage, after all that is what satellites do, LEO Satellite Direct-to-Device technology is not a replacement for terrestrial cellular services and terrestrial communications infrastructures for several reasons: (a) Although the spectral efficiency can be excellent, the frequency bandwidth (in MHz) and data speeds (in Mbps) available through satellite connections are typically lower than those provided by ground-based cellular networks, limiting its use for high-bandwidth applications. (b) The satellite-based D2D services are, in general, capacity-limited and might not be able to handle higher user density typical for urban areas as efficiently as terrestrial networks, which are designed to accommodate large numbers of users through dense deployment of cell towers. (c) Environmental factors like buildings or bad weather can more significantly impact satellite communications’ reliability and quality than terrestrial services. (d) A satellite D2D service requires regulatory approval (per country), as the D2D frequency typically will be limited to terrestrial cellular services and will have to be coordinated and managed with any terrestrial use to avoid service degradation (or disruption) for customers using terrestrial cellular services also using the frequency. The satellites will have to be able to switch off their D2D service when the satellite covers jurisdictions that have not provided approval or where the relevant frequency/frequencies are in use terrestrially.
Using the NewSpace Index database, updated December 2023, there are current more than 8,000 Direct-to Device (D2D), or Direct-2-Cell (D2C), satellites planned for launch, with SpaceX’s Starlink v2 having 7,500 planned. The rest, 795 satellites, are distributed on 6 other satellite operators (e.g. AST Mobile, Sateliot (Spain), Inmarsat (HEO-orbit), Lynk,…). If we look at satellites designed for IoT connectivity we get in total 5,302, with 4,739 (not including StarLink) still planned, distributed out over 50+ satellite operators. The average IoT satellite constellation including what is currently planned is ~95 satellites with the majority targeted for LEO. The the satellite operators included in the 50+ count have confirmed funding with a minimum amount of US$2 billion (half of the operators have only funding confirmed without an amount). About 2,937 (435 launched) satellites are being planned to only serve IoT markets (note: I think this seems a bit excessive). With Swarm Technologies, a SpaceX subsidiary rank number 1 in terms of both launched and planned satellites. Swarm Technologies having launched at least 189 CubeSats (e.g., both 0.25U and 1U types) and have planned an addition 150. The second ranked IoT-only operator is Orbcomm with 51 satellites launched and an additional 52 planned. The average launched of the remaining IoT specific satellites operators are 5 with on average planning to launch 55 (over 42 constellations).
There are also 3 satellite operators (i.e., Chinese-based Galaxy Space: 1,000 LEO-sats; US-based Mangata Networks: 791 MEO/HEO-sats, and US-based Omnispace: 200 LEO?-sats) that have planned a total of 2,000 satellites to support 5G applications with their satellite solutions and one operator (i.e., Hanwha Systems) has planned 2,000 LEO satellites for 6G.
The emergence of LEO satellite direct-to-device (D2D) services, as depicted in the Figure 10 below, is at the forefront of satellite communication innovations, offering a direct line of connectivity between devices that bypasses the need for traditional cellular-based ground-based network infrastructure (e.g., cell towers). This approach benefits from the relatively short distance of hundreds of kilometers between LEO satellites and the Earth, reducing communication latency and broadening bandwidth capabilities compared to their geostationary counterparts. One of the key advantages of LEO D2D services is their ability to provide global coverage with an extensive number of satellites, i.e., in their 100s to 1000s depending the targeted quality of service, to support the services, ensuring that even the most remote and underserved areas have access to reliable communication channels. They are also critical in disaster resilience, maintaining communications when terrestrial networks fail due to emergencies or natural disasters.

While the majority of the 5,000+ Starlink constellation is 13 GHz (Ku-band), at the beginning of 2024, SpaceX launched a few 2nd generation Starlink satellites that support direct connections from the satellite to a normal cellular device (e.g., smartphone), using 5 MHz of T-Mobile USA’s PCS band (1900 MHz). The targeted consumer service, as expressed by T-Mobile USA, provides texting capabilities across the USA for areas with no or poor existing cellular coverage. This is fairly similar to services at similar cellular coverage areas presently offered by, for example, AST SpaceMobile, OmniSpace, and Lynk Global LEO satellite services with reported maximum downlink speed approaching 20 Mbps. The so-called Direct-2-Device, where the device is a normal smartphone without satellite connectivity functionality, is expected to develop rapidly over the next 10 years and continue to increase the supported user speeds (i.e., utilized terrestrial cellular spectrum) and system capacity in terms of smaller coverage areas and higher number of satellite beams.
Table 1 below provides an overview of the top 13 LEO satellite constellations targeting (fixed) internet services (e.g., Ku band), IoT and M2M services, and Direct-to-Device (or Direct-to-Cell, D2C) services. The data has been compiled from the NewSpace Index website, which should be with data as of 31st of December 2023. The Top-satellite constellation rank has been based on the number of launched satellites until the end of 2023. Two additional Direct-2-Cell (D2C or Direct-to-Device, D2D) LEO satellite constellations are planned for 2024-2025. One is SpaceX Starlink 2nd generation, which launched at the beginning of 2024, using T-Mobile USA’s PCS Band to connect (D2D) to normal terrestrial cellular handsets. The other D2D (D2C) service is Inmarsat’s Orchestra satellite constellation based on L-band (for mobile terrestrial services) and Ka for fixed broadband services. One new constellation (Mangata Networks, see also the NewSpace constellation information) targeting 5G services. With two 5G constellations already launched, i.e., Galaxy Space (Yinhe) launched 8 LEO satellites, 1,000 planned using Q- and V-bands (i.e., not a D2D cellular 5G service), and OmniSpace launched two satellites and appear to have planned a total of 200 satellites. Moreover, currently, there is one planned constellation targeting 6G by the South Korean Hanwha Group (a bit premature, but interesting to follow nevertheless) with 2,000 6G (LEO) satellites planned.
Most currently launched and planned satellite constellations offering (or plan to provide) Direct-2-Cell services, including IoT and M2M, are designed for low-frequency bandwidth services that are unlikely to compete with terrestrial cellular networks’ quality of service where reasonable good coverage (or better) exists.

The deployment of LEO D2D services also navigates a complicated regulatory landscape, with the need for harmonized spectrum allocation across different regions. Managing interference with terrestrial cellular networks and other satellite operations is another interesting challenge albeit complex aspect, requiring sophisticated solutions to ensure signal integrity. Moreover, despite the cost-effectiveness of LEO satellites in terms of launch and operation, establishing a full-fledged network for D2D services demands substantial initial investment, covering satellite development, launch, and the setup of supporting ground infrastructure.
LEO satellites with D2D-based capabilities – takeaway:
- Provides lower-bandwidth services (e.g., GPRS/EDGE/HSDPA-like) where no existing terrestrial cellular service is present.
- (Re-)use on Satellite of the terrestrial cellular spectrum.
- D2D-based satellite services may become crucial in business continuity scenarios, providing redundancy and increased service availability to existing terrestrial cellular networks. This is particularly essential as a remedy for emergency response personnel in case terrestrial networks are not functional. Limited capacity (due to little assigned frequency bandwidth) over a large coverage area serving rural and remote areas with little or no cellular infrastructure.
- Securing regulatory approval for satellite services over independent jurisdictions is a complex and critical task for any operator looking to provide global or regional satellite-based communications. The satellite operator may have to switch off transmission over jurisdictions where no permission has been granted.
- If the spectrum is also deployed on the ground, satellite use of it must be managed and coordinated (due to interference) with the terrestrial cellular networks.
- Require lowly or non-utilized cellular spectrum in the terrestrial operator’s spectrum portfolio.
- D2D-based communications require a more complex and sophisticated satellite design, including the satellite antenna resulting in higher manufacturing and launch cost.
- The IoT-only commercial satellite constellation “space” is crowded with a total of 44 constellations (note: a few operators have several constellations). I assume that many of those plans will eventually not be realized. Note that SpaceX Swarm Technology is leading and in terms of total numbers (available in the NewSpace Index) database will remain a leader from the shear amount of satellites once their plan has been realized. I expect we will see a Chinese constellation in this space as well unless the capability will be built into the Guo Wang constellation.
- The Satellite life-time in orbit is between 5 to 7 years depending on the altitude. This timeline also dictates the modernization and upgrade cycle as well as timing of your ROI investment and refinancing needs.
- Today’s D2D satellite systems are frequency-bandwidth limited. However, if so designed, satellites could provide a frequency asymmetric satellite-to-device connection. For instance, the downlink from the satellite to the device could utilize a high frequency (not used in the targeted rural or remote area) and a larger bandwidth, while the uplink communication between the terrestrial device and the LEO satellite could use a sufficiently lower frequency and smaller frequency bandwidth.
MAKERS OF SATELLITES.
In the rapidly evolving space industry, a diverse array of companies specializes in manufacturing satellites for Low Earth Orbit (LEO), ranging from small CubeSats to larger satellites for constellations similar to those used by OneWeb (UK) and Starlink (USA). Among these, smaller companies like NanoAvionics (Lithuania) and Tyvak Nano-Satellite Systems (USA) have carved out niches by focusing on modular and cost-efficient small satellite platforms typically below 25 kg. NanoAvionics is renowned for its flexible mission support, offering everything from design to operation services for CubeSats (e.g., 1U, 3U, 6U) and larger small satellites (100+ kg). Similarly, Tyvak excels in providing custom-made solutions for nano-satellites and CubeSats, catering to specific mission needs with a comprehensive suite of services, including design, manufacturing, and testing.
UK-based Surrey Satellite Technology Limited (SSTL) stands out for its innovative approach to small, cost-effective satellites for various applications, with cost-effectiveness in achieving the desired system’s performance, reliability, and mission objectives at a lower cost than traditional satellite projects that easily runs into USD 100s of million. SSTL’s commitment to delivering satellites that balance performance and budget has made it a popular satellite manufacturer globally.
On the larger end of the spectrum, companies like SpaceX (USA) and Thales Alenia Space (France-Italy) are making significant strides in satellite manufacturing at scale. SpaceX has ventured beyond its foundational launch services to produce thousands of small satellites (250+ kg) for its Starlink broadband constellation, which comprises 5,700+ LEO satellites, showcasing mass satellite production. Thales Alenia Space offers reliable satellite platforms and payload integration services for LEO constellation projects.
With their extensive expertise in aerospace and defense, Lockheed Martin Space (USA) and Northrop Grumman (USA) produce various satellite systems suitable for commercial, military, and scientific missions. Their ability to support large-scale satellite constellation projects from design to launch demonstrates high expertise and reliability. Similarly, aerospace giants Airbus Defense and Space (EU) and Boeing Defense, Space & Security (USA) offer comprehensive satellite solutions, including designing and manufacturing small satellites for LEO. Their involvement in high-profile projects highlights their capacity to deliver advanced satellite systems for a wide range of use cases.
Together, these companies, from smaller specialized firms to global aerospace leaders, play crucial roles in the satellite manufacturing industry. They enable a wide array of LEO missions, catering to the burgeoning demand for satellite services across telecommunications, Earth observation, and beyond, thus facilitating access to space for diverse clients and applications.
ECONOMICS.
Before going into details, let’s spend some time on an example illustrating the basic components required for building a satellite and getting it to launch. Here, I point at a super cool alternative to the above-mentioned companies, the USA-based startup Apex, co-founded by CTO Max Benassi (ex-SpaceX and Astra) and CEO Ian Cinnamon. To get an impression of the macro-components of a satellite system, I recommend checking out the Apex webpage and “playing” with their satellite configurator. The basic package comes at a price tag of USD 3.2 million and a 9-month delivery window. It includes a 100 kg satellite bus platform, a power system, a communication system based on X-band (8 – 12 GHz), and a guidance, navigation, and control package. The basic package does not include a solar array drive assembly (SADA), which plays a critical role in the operation of satellites by ensuring that the satellite’s solar panels are optimally oriented toward the Sun. Adding the SADA brings with it an additional USD 500 thousand. Also, the propulsion mechanism (e.g., chemical or electric; in general, there are more possibilities) is not provided (+ USD 450 thousand), nor are any services included (e.g., payload & launch vehicle integration and testing, USD 575 thousand), including SADAs, propulsion, and services, Apex will have a satellite launch ready for an amount of close to USD 4.8 million.
However, we are not done. The above solution still needs to include the so-called payload, which relates to the equipment or instruments required to perform the LEO satellite mission (e.g., broadband communications services), the actual satellite launch itself, and the operational aspects of a successful post-launch (i.e., ground infrastructure and operation center(s)).
Let’s take SpaceX’s Starlink satellite as an example illustrating mission and payload more clearly. The Starlink satellite’s primary mission is to provide fixed-wireless access broadband internet to an Earth-based fixed antenna using. The Starlink payload primarily consists of advanced broadband internet transmission equipment designed to provide high-speed internet access across the globe. This includes phased-array antennas for communication with user terminals on the ground, high-frequency radio transceivers to facilitate data transmission, and inter-satellite links allowing satellites to communicate in orbit, enhancing network coverage and data throughput.
The economical aspects of launching a Low Earth Orbit (LEO) satellite project span a broad spectrum of costs from the initial concept phase to deployment and operational management. These projects commence with research and development, where significant investments are made in design, engineering, and the iterative process of prototyping and testing to ensure the satellite meets its intended performance and reliability standards in harsh space conditions (e.g., vacuum, extreme temperature variations, radiation, solar flares, high-velocity impacts with micrometeoroids and man-made space debris, erosion, …).
Manufacturing the satellite involves additional expenses, including procuring high-quality components that can withstand space conditions and assembling and integrating the satellite bus with its mission-specific payload. Ensuring the highest quality standards throughout this process is crucial to minimizing the risk of in-orbit failure, which can substantially increase project costs. The payload should be seen as the heart of the satellite’s mission. It could be a set of scientific instruments for measuring atmospheric data, optical sensors for imaging, transponders for communication, or any other equipment designed to fulfill the satellite’s specific objectives. The payload will vary greatly depending on the mission, whether for Earth observation, scientific research, navigation, or telecommunications.
Of course, there are many other types and more affordable options for LEO satellites than a Starlink-like one (although we should also not ignore achievements of SpaceX and learn from them as much as possible). As seen from Table 1, we have a range of substantially smaller satellite types or form factors. The 1U (i.e., one unit) CubeSat is a satellite with a form factor of 10x10x11.35 cm3 and weighs no more than 1.33 kilograms. A rough cost range for manufacturing a 1U CubeSat could be from USD 50 to 100+ thousand depending on mission complexity and payload components (e.g., commercial-off-the-shelf or application or mission-specific design). The range includes considering the costs associated with the satellite’s design, components, assembly, testing, and initial integration efforts. The cost range, however, does not include other significant costs associated with satellite missions, such as launch services, ground station operations, mission control, and insurance, which is likely to (significantly) increase the total project cost. Furthermore, we have additional form factors, such as 3U CubeSat (10x10x34.05 cm3, <4 kg), manufacturing cost in the range of USD 100 to 500+ thousand, 6U CubeSat (20x10x34 cm3, <12 kg), that can carry more complex payload solutions than the smaller 1U and 3U, with the manufacturing cost in the range of USD 200 thousand to USD 1+ million and 12U satellites (20x20x34 cm3, <24 kg) that again support complex payload solutions and in general will be significantly more expensive to manufacture.
Securing a launch vehicle is one of the most significant expenditures in a satellite project. This cost not only includes the price of the rocket and launch itself but also encompasses integration, pre-launch services, and satellite transportation to the launch site. Beyond the launch, establishing and maintaining the ground segment infrastructure, such as ground stations and a mission control center, is essential for successful satellite communication and operation. These facilities enable ongoing tracking, telemetry, and command operations, as well as the processing and management of the data collected by the satellite.
The SpaceX Falcon rocket is used extensively by other satellite businesses (see above Table 1) as well as by SpaceX for their own Starlink constellation network. The rocket has a payload capability of ca. 23 thousand kg and a volume handling capacity of approximately 300 cubic meters. SpaceX has launched around 60 Starlink satellites per Falcon 9 mission for the first-generation satellites. The launch cost per 1st generation satellite would then be around USD 1 million per satellite using the previously quoted USD 62 million (2018 figure) for a Falcon 9 launch. The second-generation Starlink satellites are substantially more advanced compared to the 1st generation. They are also heavier, weighing around a thousand kilograms. A Falcon 9 would only be able to launch around 20 generation 2 satellites (only considering the weight limitation), while a Falcon Heavy could lift ca. 60 2nd gen. satellites but also at a higher price point of USD 90 million (2018 figure). Thus the launch cost per satellite would be between USD 1.5 million using Falcon Heavy and USD 3.1 million using Falcon 9. Although the launch cost is based on price figures from 2018, the expected efficiency gained from re-use may have either kept the cost level or reduced it further as expected, particularly with Falcon Heavy.
Satellite businesses looking to launch small volumes of satellites, such as CubeSats, have a variety of strategies at their disposal to manage launch costs effectively. One widely adopted approach is participating in rideshare missions, where the expenses of a single launch vehicle are shared among multiple payloads, substantially reducing the cost for each operator. This method is particularly attractive due to its cost efficiency and the regularity of missions offered by, for example, SpaceX. Prices for rideshare missions can start from as low as a few thousand dollars for very small payloads (like CubeSats) to several hundred thousand dollars for larger small satellites. For example, SpaceX advertises rideshare prices starting at $1 million for payloads up to 200 kg. Alternatively, dedicated small launcher services cater specifically to the needs of small satellite operators, offering more tailored launch options in terms of timing and desired orbit. Companies such as Rocket Lab (USA) and Astra (USA) launch services have emerged, providing flexibility that rideshare missions might not, although at a slightly higher cost. However, these costs remain significantly lower than arranging a dedicated launch on a larger vehicle. For example, Rocket Lab’s Electron rocket, specializing in launching small satellites, offers dedicated launches with prices starting around USD 7 million for the entire launch vehicle carrying up to 300 kg. Astra has reported prices in the range of USD 2.5 million for a dedicated LEO launch with their (discontinued) Rocket 3 with payloads of up to 150 kg. The cost for individual small satellites will depend on their share of the payload mass and the specific mission requirements.
Satellite ground stations, which consist of arrays of phased-array antennas, are critical for managing the satellite constellation, routing internet traffic, and providing users with access to the satellite network. These stations are strategically located to maximize coverage and minimize latency, ensuring that at least one ground station is within the line of sight of satellites as they orbit the Earth. As of mid-2023, Starlink operated around 150 ground stations worldwide (also called Starlink Gateways), with 64 live and an additional 33 planned in the USA. The cost of constructing a ground station would be between USD 300 thousand to half a million not including the physical access point, also called the point-of-presence (PoP), and transport infrastructure connecting the PoP (and gateway) to the internet exchange where we find the internet service providers (ISPs) and the content delivery networks (CDNs). The Pop may add another USD 100 to 200 thousand to the ground infrastructure unit cost. The transport cost from the gateway to the Internet exchange can vary a lot depending on the gateway’s location.
Insurance is a critical component of the financial planning for a satellite project, covering risks associated with both the launch phase and the satellite’s operational period in orbit. These insurances are, in general, running at between 5% to 20% of the total project cost depending on the satellite value, the track record of the launch vehicle, mission complexity, and duration (i.e., typically 5 – 7 years for a LEO satellite at 500 km) and so forth. Insurance could be broken up into launch insurance and insurance covering the satellite once it is in orbit.
Operational costs, the Opex, include the day-to-day expenses of running the satellite, from staffing and technical support to ground station usage fees.
Regulatory and licensing fees, including frequency allocation and orbital slot registration, ensure the satellite operates without interfering with other space assets. Finally, at the end of the satellite’s operational life, costs associated with safely deorbiting the satellite are incurred to comply with space debris mitigation guidelines and ensure a responsible conclusion to the mission.
The total cost of an LEO satellite project can vary widely, influenced by the satellite’s complexity, mission goals, and lifespan. Effective project management and strategic decision-making are crucial to navigating these expenses, optimizing the project’s budget, and achieving mission success.

CubeSats (e.g., 1U, 3U, 6U, 12U):
- Manufacturing Cost: Ranges from USD 50,000 for a simple 1U CubeSat to over USD 1 million for a more complex missions supported by 6U (or higher) CubeSat with advanced payloads (and 12U may again amount to several million US dollars).
- Launch Cost: This can vary significantly depending on the launch provider and the rideshare opportunities, ranging from a few thousand dollars for a 1U CubeSat on a rideshare mission to several million dollars for a dedicated launch of larger CubeSats or small satellites.
- Operational Costs: Ground station services, mission control, and data handling can add tens to hundreds of thousands of dollars annually, depending on the mission’s complexity and duration.
Small Satellites (25 kg up to 500 kg):
- Manufacturing Cost: Ranges from USD 500,000 to over 10 million, depending on the satellite’s size, complexity, and payload requirements.
- Launch Cost: While rideshare missions can reduce costs, dedicated launches for small satellites can range from USD 10 million to 62 million (e.g., Falcon 9) and beyond (e.g., USD 90 million for Falcon Heavy).
- Operational Costs: These are similar to CubeSats, but potentially higher due to the satellite’s larger size and more complex mission requirements, reaching several hundred thousand to over a million dollars annually.
The range for the total project cost of a LEO satellite:
Given these considerations, the total cost range for a LEO satellite project can vary from as low as a few hundred thousand dollars for a simple CubeSat project utilizing rideshare opportunities and minimal operational requirements to hundreds of millions of dollars for more complex small satellite missions requiring dedicated launches and extensive operational support.
It is important to note that these are rough estimates, and the actual cost can vary based on specific mission requirements, technological advancements, and market conditions.
CAPACITY AND QUALITY

The overall capacity and quality of satellite communication systems, given in Mbps, is on a high level, the product of three key factors: (i) the amount of frequency bandwidth in MHz allocated to the satellite operations multiplied by (ii) the effective spectral efficiency in Mbps per MHz over a unit satellite-beam coverage area multiplied by (iii) the number of satellite beams that provide the resulting terrestrial cell coverage. Thus, in other words:
Satellite Capacity (in Mbps) =
Frequency Bandwidth in MHz ×
Effective Spectral Efficiency in Mbps/MHz/Beam ×
Number of Beams (or Cells)
Consider a satellite system supporting 8 beams (and thus an equivalent of terrestrial coverage cells), each with 250 MHz allocated within the same spectral frequency range, can efficiently support ca. 680 Mbps per beam. This is achieved with an antenna setup that effectively provides a spectral efficiency of ~2.7 Mbps/MHz/cell (or beam) in the downlink (i.e., from the satellite to the ground). Moreover, the satellite typically will have another frequency and antenna configuration that establishes a robust connection to the ground station that connects to the internet via, for example, third-party internet service providers. The 680 Mbps is then shared among users that are within the satellite beam coverage, e.g., if you have 100 customers demanding a service, the speed each would experience on average would be around 7 Mbps. This may not seem very impressive compared to the cellular speeds we are used to getting with an LTE or 5G terrestrial cellular service. However, such speeds are, of course, much better than having no means of connecting to the internet.
Higher frequencies (i.e., in the GHz range) used to provide terrestrial cellular broadband services are in general quiet sensitive to the terrestrial environment and non-LoS propagation. It is a basic principle of physics that signal propagation characteristics, including the range and penetration capabilities of an electromagnetic waves, is inversely related to their frequency. Vegetation and terrain becomes an increasingly critical factor to consider in higher frequency propagation and the resulting quality of coverage. For example trees, forests, and other dense foliage can absorb and scatter radio waves, attenuating signals. The type and density of vegetation, along with seasonal changes like foliage density in summer versus winter, can significantly impact signal strength. Terrains often include varied topographies such as housing, hills, valleys, and flat plains, each affecting signal reach differently. For instance, housing, hilly or mountainous areas may cause signal shadowing and reflection, while flat terrains might offer less obstruction, enabling signals to travel further. Cellular mobile operators tend to like high frequencies (GHz) for cellular broadband services as it is possible to get substantially more system throughput in bits per second available to deliver to our demanding customers than at frequencies in the MHz range. As can be observed in Figure 12 above, we see that the frequency bandwidth is a multiplier for the satellite capacity and quality. Cellular mobile operators tend to “dislike” higher frequencies because of their poorer propagation conditions in their terrestrially based cellular networks resulting in the need for increased site densification at a significant incremental capital expense.
The key advantage of a LEO satellite is that the likelihood of a line-of-sight to a point on the ground is very high compared to establishing a line-of-sight for terrestrial cellular coverage that, in general, would be very low. In other words, the cellular signal propagation from an satellite closely approximates that of free space. Thus, all the various environmental signal loss factors we must consider for a standard terrestrial-based mobile network do not apply to our satellite having only to overcome the distance from the satellite antenna to the ground.
Let us first look at the satellite frequency component of the above satellite capacity, and quality, formula:
FREQUENCY SPECTRUM FOR SATELLITES.
The satellite frequency spectrum encompasses a range of electromagnetic frequencies allocated specifically for satellite communication. These frequencies are divided into bands, commonly known as L-band (e.g., mobile broadband), S-band (e.g., mobile broadband), C-band, X-band (e.g., mainly used by military), Ku-band (e.g., fixed broadband), Ka-band (e.g., fixed broadband), and V-band. Each serves different satellite applications due to its distinct propagation characteristics and capabilities. The spectrum bandwidth used by satellites refers to the width of the frequency range that a satellite system is licensed to use for transmitting and receiving signals.
Careful management of satellite spectrum bandwidth is critical to prevent interference with terrestrial communications systems. Since both satellite and terrestrial systems can operate on similar frequency ranges, there is a potential for crossover interference, which can degrade the performance of both systems. This is particularly important for bands like C-band and Ku-band, which are also used for terrestrial cellular networks and other applications like broadcasting.
Using the same spectrum for both satellite and terrestrial cellular coverage within the same geographical area is challenging due to the risk of interference. Satellites transmit signals over vast areas, and if those signals are on the same frequency as terrestrial cellular systems, they can overpower the local ground-based signals, causing reception issues for users on the ground. Conversely, the uplink signals from terrestrial sources can interfere with the satellite’s ability to receive communications from its service area.
Regulatory bodies such as the International Telecommunication Union (ITU) are crucial in mitigating these interference issues. They coordinate the allocation of frequency bands and establish regulations that govern their use. This includes defining geographical zones where certain frequencies may be used exclusively for either terrestrial or satellite services, as well as setting limits on signal power levels to minimize the chance of interference. Additionally, technology solutions like advanced filtering, beam shaping, and polarization techniques are employed to further isolate satellite communications from terrestrial systems, ensuring that both may coexist and operate effectively without mutual disruption.
The International Telecommunication Union (ITU) has designated several frequency bands for Fixed Satellite Services (FSS) and Mobile Satellite Services (MSS) that can be used by satellites operating in Low Earth Orbit (LEO). The specific bands allocated for satellite services, FSS and MSS, are determined by the ITU’s Radio Regulations, which are periodically updated to reflect global telecommunication’s evolving needs and address emerging technologies. Here are some of the key frequency bands commonly considered for FSS and MSS with LEO satellites:
V-Band 40 GHz to 75 GHz (microwave frequency range).
The V-band is appealing for Low Earth Orbit (LEO) satellite constellations designed to provide global broadband internet access. LEO satellites can benefit from the V-band’s capacity to support high data rates, which is essential for serving densely populated areas and delivering competitive internet speeds. The reduced path loss at lower altitudes, compared to GEO, also makes the V-band a viable option for LEO satellites. Due to the higher frequencies offered by V-band it also is significant more sensitive to atmospheric attenuation, (e.g., oxygen absorption around 60 GHz), including rain fade, which is likely to affect signal integrity. This necessitates the development of advanced technologies for adaptive coding and modulation, power amplification, and beamforming to ensure reliable communication under various weather conditions. Several LEO satellite operators have expressed an interest in operationalizing the V-band in their satellite constellations (e.g., StarLink, OneWeb, Kuiper, Lightspeed). This band should be regarded as an emergent LEO frequency band.
Ka-Band 17.7 GHz to 20.2 GHz (Downlink) & 27.5 GHz to 30.0 GHz (Uplink).
The Ka-band offers higher bandwidths, enabling greater data throughput than lower bands. Not surprising this band is favored by high-throughput satellite solutions. It is widely used by fixed satellite services (FSS). This makes it ideal for high-speed internet services. However, it is more susceptible to absorption and scattering by atmospheric particles, including raindrops and snowflakes. This absorption and scattering effect weakens the signal strength when it reaches the receiver. To mitigate rain fade effects in the Ka-band, satellite, and ground equipment must be designed with higher link margins, incorporating more powerful transmitters and more sensitive receivers. Additionally, adaptive modulation and coding techniques can be employed to adjust the signal dynamically in response to changing weather conditions. Overall, the system is more costly and, therefore, primarily used for satellite-to-earth ground station communications and high-performance satellite backhaul solutions.
For example, Starlink and OneWeb use the Ka-band to connect to satellite Earth gateways and point-of-presence, which connect to Internet Exchange and the wider internet. It is worth noticing that the terrestrial 5 G band n256 (26.5 to 29.5 GHz) falls within the Ka-band’s uplink frequency band. Furthermore, SES’s mPower satellites, operating at Middle Earth Orbit (MEO), operate exclusively in this band, providing internet backhaul services.
Ku-Band 12.75 GHz to 13.25 GHz (Downlink) & 14.0 GHz to 14.5 GHz (Uplink).
The Ku-band is widely used for FSS satellite communications, including fixed satellite services, due to its balance between bandwidth availability and susceptibility to rain fade. It is suitable for broadband services, TV broadcasting, and backhaul connections. For example, Starlink and OneWeb satellites are using this band to provide broadband services to earth-based customer terminals.
X-Band 7.25 GHz to 7.75 GHz (Downlink) & 7.9 GHz to 8.4 GHz (Uplink).
The X-band in satellite applications is governed by international agreements and national regulations to prevent interference between different services and to ensure the efficient use of the spectrum. The X-band is extensively used for secure military satellite communications, offering advantages like high data rates and relative resilience to jamming and eavesdropping. It supports a wide range of military applications, including mobile command, control, communications, computer, intelligence, surveillance, and reconnaissance (i.e., C4ISR) operations. Most defense-oriented satellites operate at geostationary orbit, ensuring constant coverage of specific geographic areas (e.g., Airbus Skynet constellations, Spain’s XTAR-EUR, and France’s Syracuse satellites). Most European LEO defense satellites, used primarily for reconnaissance, are fairly old, with more than 15 years since the first launch, and are limited in numbers (i.e., <10). The most recent European LEO satellite system is the French-based Multinational Space-based Imaging System (MUSIS) and Composante Spatiale Optique (CSO), where the first CSO components were launched in 2018. There are few commercial satellites utilizing the X-band.
C-Band 3.7 GHz to 4.2 GHz (Downlink) & 5.925 GHz to 6.425 GHz (Uplink)
C-band is less susceptible to rain fade and is traditionally used for satellite TV broadcasting, maritime, and aviation communications. However, parts of the C-band are also being repurposed for terrestrial 5G networks in some regions, leading to potential conflicts and the need for careful coordination. The C-band is primarily used in geostationary orbit (GEO) rather than Low Earth Orbit (LEO), due to the historical allocation of C-band for fixed satellite services (FSS) and its favorable propagation characteristics. I haven’t really come across any LEO constellation using the C-band. GEO FSS satellite operators using this band extensively are SES (Luxembourg), Intelsat (Luxembourg/USA), Eutelsat (France), Inmarsat (UK), etc..
S-Band 2.0 GHz to 4.0 GHz
S-band is used for various applications, including mobile communications, weather radar, and some types of broadband services. It offers a good compromise between bandwidth and resistance to atmospheric absorption. Both Omnispace (USA) and Globalstar (USA) LEO satellites operate in this band. Omnispace is also interesting as they have expressed intent to have LEO satellites supporting the 5G services in the band n256 (26.5 to 29.5 GHz), which falls within the uplink of the Ka-band.
L-Band 1.0 GHz to 2.0 GHz
L-band is less commonly used for fixed satellite services but is notable for its use in mobile satellite services (MSS), satellite phone communications, and GPS. It provides good coverage and penetration characteristics. Both Lynk Mobile (USA), offering Direct-2-Device, IoT, and M2M services, and Astrocast (Switzerland), with their IoT/M2M services, are examples of LEO satellite businesses operating in this band.
UHF 300 MHz to 3.0 GHz
The UHF band is more widely used for satellite communications, including mobile satellite services (MSS), satellite radio, and some types of broadband data services. It is favored for its relatively good propagation characteristics, including the ability to penetrate buildings and foliage. For example, Fossa Systems LEO pico-satellites (i.e., 1p form-factor) use this frequency for their IoT and M2M communications services.
VHF 30 MHz to 300 MHz
The VHF band is less commonly used in satellite communications for commercial broadband services. Still, it is important for applications such as satellite telemetry, tracking, and control (TT&C) operations and amateur satellite communications. Its use is often limited due to the lower bandwidth available and the higher susceptibility to interference from terrestrial sources. Swarm Technologies (USA and a SpaceX subsidiary) using 137-138 MHz (Downlink) and 148-150 MHz (Uplink). However, it appears that they have stopped taking new devices on their network. Orbcomm (USA) is another example of a satellite service provider using the VHF band for IoT and M2M communications. There is very limited capacity in this band due to many other existing use cases, and LEO satellite companies appear to plan to upgrade to the UHF band or to piggyback on direct-2-cell (or direct-2-device) satellite solutions, enabling LEO satellite communications with 3GPP compatible IoT and M2M devices.
SATELLITE ANTENNAS.
Satellites operating in Geostationary Earth Orbit (GEO), Medium Earth Orbit (MEO), and Low Earth Orbit (LEO) utilize a variety of antenna types tailored to their specific missions, which range from communication and navigation to observation (e.g., signal intelligence). The satellite’s applications influence the selection of an antenna, the characteristics of its orbit, and the coverage area required.
Antenna technology is intrinsically linked to spectral efficiency in satellite communications systems and of course any other wireless systems. Antenna designs influence how effectively a communication system can transmit and receive signals within a given frequency band, which is the essence of spectral efficiency (i.e., how much information per unit time in bits per second can I squeeze through my communications channel).
Thus, advancements in antenna technology are fundamental to improving spectral efficiency, making it a key area of research and development in the quest for more capable and efficient communication systems.
Parabolic dish antennas are prevalent for GEO satellites due to their high gain and narrow beam width, making them ideal for broadcasting and fixed satellite services. These antennas focus a tight beam on specific areas on Earth, enabling strong and direct signals essential for television, internet, and communication services. Horn antennas, while simpler, are sometimes used as feeds for larger parabolic antennas or for telemetry, tracking, and command functions due to their reliability. Additionally, phased array antennas are becoming more common in GEO satellites for their ability to steer beams electronically, offering flexibility in coverage and the capability to handle multiple beams and frequencies simultaneously.
Phased-array antennas are indispensable in for MEO satellites, such as those used in navigation systems like GPS (USA), BeiDou (China), Galileo (European), or GLONASS (Russian). These satellite constellations cover large areas of the Earth’s surface and can adjust beam directions dynamically, a critical feature given the satellites’ movement relative to the Earth. Patch antennas are also widely used in MEO satellites, especially for mobile communication constellations, due to their compact and low-profile design, making them suitable for mobile voice and data communications.
Phased-array antennas are very important for LEO satellites use cases as well, which include broadband communication constellations like Starlink and OneWeb. Their (fast) beam-steering capabilities are essential for maintaining continuous communication with ground stations and user terminals as the satellites quickly traverse the sky. The phased-array antenna also allow for optimizing coverage with both narrow as well as wider field of view (from the perspective of the satellite antenna) that allow the satellite operator to trade-off cell capacity and cell coverage.
Simpler Dipole antennas are employed for more straightforward data relay and telemetry purposes in smaller satellites and CubeSats, where space and power constraints are significant factors. Reflect array antennas, which offer a mix of high gain and beam steering capabilities, are used in specific LEO satellites for communication and observation applications (e.g., for signal intelligence gathering), combining features of both parabolic and phased array antennas.
Mission specific requirements drive the choice of antenna for a satellite. For example, GEO satellites often use high-gain, narrowly focused antennas due to their fixed position relative to the Earth, while MEO and LEO satellites, which move relatively closer to the Earth’s surface, require antennas capable of maintaining stable connections with moving ground terminals or covering large geographical areas.
Advanced antenna technologies such as beamforming, phased-arrays, and Multiple In Multiple Out (MMO) antenna configurations are crucial in managing and utilizing the spectrum more efficiently. They enable precise targeting of radio waves, minimizing interference, and optimizing bandwidth usage. This direct control over the transmission path and signal shape allows more data (bits) to be sent and received within the same spectral space, effectively increasing the communication channel’s capacity. In particular, MIMO antenna configurations and advanced antenna beamforming have enabled terrestrial mobile cellular access technologies (e.g., LTE and 5G) to quantum leap the effective spectral efficiency, broadband speed and capacity orders of magnitude above and beyond older technologies of 2G and 3G. Similar principles are being deployed today in modern advanced communications satellite antennas, providing increased capacity and quality within the satellite cellular coverage area provided by the satellite beam.
Moreover, antenna technology developments like polarization and frequency reuse directly impact a satellite system’s ability to maximize spectral resources. Allowing simultaneous transmissions on the same frequency through different polarizations or spatial separations effectively double the capacity without needing additional spectrum.
WHERE DO WE END UP.
If all current commercial satellite plans were realized, within the next decade, we would have more, possibly substantially more than 65 thousand satellites circling Earth. Today, that number is less than 10 thousand, with more than half that number realized by StarLink’s LEO constellation. Imagine the increase in, and the amount of, space debris circling Earth within the next 10 years. This will likely pose a substantial increase in operational risk for new space missions and will have to be addressed urgently.
Over the next decade, we may have at least 2 major LEO satellite constellations. One from Starlink with an excess of 12 thousand satellites, and one from China, the Guo Wang, the state network, likewise with 12 thousand LEO satellites. One global satellite constellation is from an American-based commercial company; the other is a worldwide satellite constellation representing the Chinese state. It would not be too surprising to see that by 2034, the two satellite constellations will divide Earth in part, being serviced by a commercial satellite constellation (e.g., North America, Europe, parts of the Middle East, some of APAC including India, possibly some parts of Africa). Another part will likely be served by a Chinese-controlled LEO constellation providing satellite broadband service to China, Russia, significant parts of Africa, and parts of APAC.
Over the next decade, satellite services will undergo transformative advancements, reshaping the architecture of global communication infrastructures and significantly impacting various sectors, including broadband internet, global navigation, Earth observation, and beyond. As these services evolve, we should anticipate major leaps in satellite technologies, driven by innovation in propulsion systems, miniaturization of technology, advancements in onboard processing capabilities, increasing use of AI and machine learning leapfrogging satellites operational efficiency and performance, breakthrough in material science reducing weight and increasing packing density, leapfrogs in antenna technology, and last but not least much more efficient use of the radio frequency spectrum. Moreover, we will see the breakthrough innovation that will allow better co-existence and autonomous collaboration of frequency spectrum utilization between non-terrestrial and terrestrial networks reducing the need for much regulatory bureaucracy that might anyway be replaced by decentralized autonomous organizations (DAOs) and smart contracts. This development will be essential as satellite constellations are being integrated into 5G and 6G network architectures as the non-terrestrial network cellular access component. This particular topic, like many in this article, is worth a whole new article on its own.
I expect that over the next 10 years we will see electronically steerable phased-array antennas, as a notable advancement. These would offer increased agility and efficiency in beamforming and signal direction. Their ability to swiftly adjust beams for optimal coverage and connectivity without physical movement makes them perfect for the dynamic nature of Low Earth Orbit (LEO) satellite constellations. This technology will becomes increasingly cost-effective and energy-efficient, enabling widespread deployment across various satellite platforms (not only LEO designs). The advance in phased-array antenna technology will facilitate substantial increase in the satellite system capacity by increasing the number of beams, the variation on beam size (possibly down to a customer ground station level), and support multi-band operations within the same antenna.
Another promising development is the integration of metamaterials in antenna design, which will lead to more compact, flexible, and lightweight antennas. The science of metamaterials is super interesting and relates to manufacturing artificial materials to have properties not found in naturally occurring materials with unique electromagnetic behaviors arising from their internal structure. Metamaterial antennas is going to offer superior performance, including better signal control and reduced interference, which is crucial for maintaining high-quality broadband connections. These materials are also important for substantially reducing the weight of the satellite antenna, while boosting its performance. Thus, the technology will also support bringing the satellite launch cost down dramatically.
Although primarily associated MIMO antennas with terrestrial networks, I would also expect that massive MIMO technology will find applications in satellite broadband systems. Satellite systems, just like ground based cellular networks, can significantly increase their capacity and efficiency by utilizing many antenna elements to simultaneously communicate with multiple ground terminals. This could be particularly transformative for next-generation satellite networks, supporting higher data rates and accommodating more users. The technology will increase the capacity and quality of the satellite system dramatically as it has done on terrestrial cellular networks.
Furthermore, advancements in onboard processing capabilities will allow satellites to perform more complex signal processing tasks directly in space, reducing latency and improving the efficiency of data transmission. Coupled with AI and machine learning algorithms, future satellite antennas could dynamically optimize their operational parameters in real-time, adapting to changes in the network environment and user demand.
Additionally, research into quantum antenna technology may offer breakthroughs in satellite communication, providing unprecedented levels of sensitivity and bandwidth efficiency. Although still early, quantum antennas could revolutionize signal reception and transmission in satellite broadband systems. In the context of LEO satellite systems, I am particularly excited about utilizing the Rydberg Effect to enhance system sensitivity could lead to massive improvements. The heightened sensitivity of Rydberg atoms to electromagnetic fields could be harnessed to develop ultra-sensitive detectors for radio frequency (RF) signals. Such detectors could surpass the performance of traditional semiconductor-based devices in terms of sensitivity and selectivity, enabling satellite systems to detect weaker signals, improve signal-to-noise ratios, and even operate effectively over greater distances or with less power. Furthermore, space could potentially be the near-ideal environment for operationalizing Rydberg antenna and communications systems as space had near-perfect vacuum, very low-temperatures (in Earth shadow at least or with proper thermal management), relatively free of electromagnetic radiation (compared to Earth), as well as its micro-gravity environment that may facilitate long-range “communications” between Rydberg atoms. This particular topic may be further out in the future than “just” a decade from now, although it may also be with satellites we will see the first promising results of this technology.
One key area of development will be the integration of LEO satellite networks with terrestrial 5G and emerging 6G networks, marking a significant step in the evolution of Non-Terrestrial Network (NTN) architectures. This integration promises to deliver seamless, high-speed connectivity across the globe, including in remote and rural areas previously underserved by traditional broadband infrastructure. By complementing terrestrial networks, LEO satellites will help achieve ubiquitous wireless coverage, facilitating a wide range of applications and use cases from high-definition video streaming to real-time IoT data collection.
The convergence of LEO satellite services with 5G and 6G will also spur network management and orchestration innovation. Advanced techniques for managing interference, optimizing handovers between terrestrial and non-terrestrial networks, and efficiently allocating spectral resources will be crucial. It would be odd not to mention it here, so artificial intelligence and machine learning algorithms will, of course, support these efforts, enabling dynamic network adaptation to changing conditions and demands.
Moreover, the next decade will likely see significant improvements in the environmental sustainability of LEO satellite operations. Innovations in satellite design and materials, along with more efficient launch vehicles and end-of-life deorbiting strategies, will help mitigate the challenges of space debris and ensure the long-term viability of LEO satellite constellations.
In the realm of global connectivity, LEO satellites will have bridged the digital divide, offering affordable and accessible internet services to billions of people worldwide unconnected today. In 2023 the estimate is that there are about 3 billion people, almost 40% of all people in the world today, that have never used internet. In the next decade, it must be our ambition that with LEO satellite networks this number is brought down to very near Zero. This will have profound implications for education, healthcare, economic development, and global collaboration.
FURTHER READING.
- A. Vanelli-Coralli, N. Chuberre, G. Masini, A. Guidotti, M. El Jaafari, “5G Non-Terrestrial Networks.”, Wiley (2024). A recommended reading for deep diving into NTN networks of satellites, typically the LEO kind, and High-Altitude Platform Systems (HAPS) such as stratospheric drones.
- I. del Portillo et al., “A technical comparison of three low earth orbit satellite constellation systems to provide global broadband,” Acta Astronautica, (2019).
- Nils Pachler et al., “An Updated Comparison of Four Low Earth Orbit Satellite Constellation Systems to Provide Global Broadband” (2021).
- Starlink, “Starlink specifications” (Starlink.com page). The following Wikipedia resource is quite good as well: Starlink.
- Quora, “How much does a satellite cost for SpaceX’s Starlink project and what would be the cheapest way to launch it into space?” (June 2023). This link includes a post from Elon Musk commenting on the cost involved in manufacturing the Starlink satellite and the cost of launching SpaceX’s Falcon 9 rocket.
- Michael Baylor, “With Block 5, SpaceX to increase launch cadence and lower prices.”, nasaspaceflight.com (May, 2018).
- Gwynne Shotwell, TED Talk from May 2018. She quotes here a total of USD 10 billion as a target for the 12,000 satellite network. This is just an amazing visionary talk/discussion about what may happen by 2028 (in 4-5 years ;-).
- Juliana Suess, “Guo Wang: China’s Answer to Starlink?”, (May 2023).
- Makena Young & Akhil Thadani, “Low Orbit, High Stakes, All-In on the LEO Broadband Competition.”, Center for Strategic & International Studies CSIS, (Dec. 2022).
- AST SpaceMobile website: https://ast-science.com/ Constellation Areas: Internet, Direct-to-Cell, Space-Based Cellular Broadband, Satellite-to-Cellphone. 243 LEO satellites planned. 2 launched.
- Lynk Global website: https://lynk.world/ (see also FCC Order and Authorization). It should be noted that Lynk can operate within 617 to 960 MHz (Space-to-Earth) and 663 to 915 MHz (Earth-to-Space). However, only outside the USA. Constellation Area: IoT / M2M, Satellite-to-Cellphone, Internet, Direct-to-Cell. 8 LEO satellites out of 10 planned.
- Omnispace website: https://omnispace.com/ Constellation Area: IoT / M2M, 5G. Ambition to have the world’s first global 5G non-terrestrial network. Initial support 3GPP-defined Narrow-Band IoT radio interface. Planned 200 LEO and <15 MEO satellites. So far, only 2 satellites have been launched.
- NewSpace Index: https://www.newspace.im/ I find this resource to have excellent and up-to-date information on commercial satellite constellations.
- R.K. Mailloux, “Phased Array Antenna Handbook, 3rd Edition”, Artech House, (September 2017).
- A.K. Singh, M.P. Abegaonkar, and S.K. Koul, “Metamaterials for Antenna Applications”, CRC Press (September 2021).
- T.L. Marzetta, E.G. Larsson, H. Yang, and H.Q. Ngo, “Fundamentals of Massive MIMO”, Cambridge University Press, (November 2016).
- G.Y. Slepyan, S. Vlasenko, and D. Mogilevtsev, “Quantum Antennas”, arXiv:2206.14065v2, (June 2022).
- R. Huntley, “Quantum Rydberg Receiver Shakes Up RF Fundamentals”, EE Times, (January 2022).
- Y. Du, N. Cong, X. Wei, X. Zhang, W. Lou, J. He, and R. Yang, “Realization of multiband communications using different Rydberg final states”, AIP Advances, (June 2022). Demonstrating the applicability of the Rydberg effect in digital transceivers in the Ku and Ka bands.
ACKNOWLEDGEMENT.
I greatly acknowledge my wife, Eva Varadi, for her support, patience, and understanding during the creative process of writing this article.


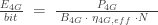 and
and 
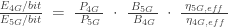


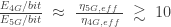


![CV_X \; - \; CV_Y \; = \; \Delta Capex \; \left[ \frac{1 \; - \; g}{\; WACC \; - \; g \;} \right]](https://s0.wp.com/latex.php?latex=CV_X+%5C%3B+-+%5C%3B+CV_Y+%5C%3B+%3D+%5C%3B+%5CDelta+Capex+%5C%3B+%5Cleft%5B+%5Cfrac%7B1+%5C%3B+-+%5C%3B+g%7D%7B%5C%3B+WACC+%5C%3B+-+%5C%3B+g+%5C%3B%7D+%5Cright%5D&bg=ffffff&fg=333333&s=0&c=20201002)


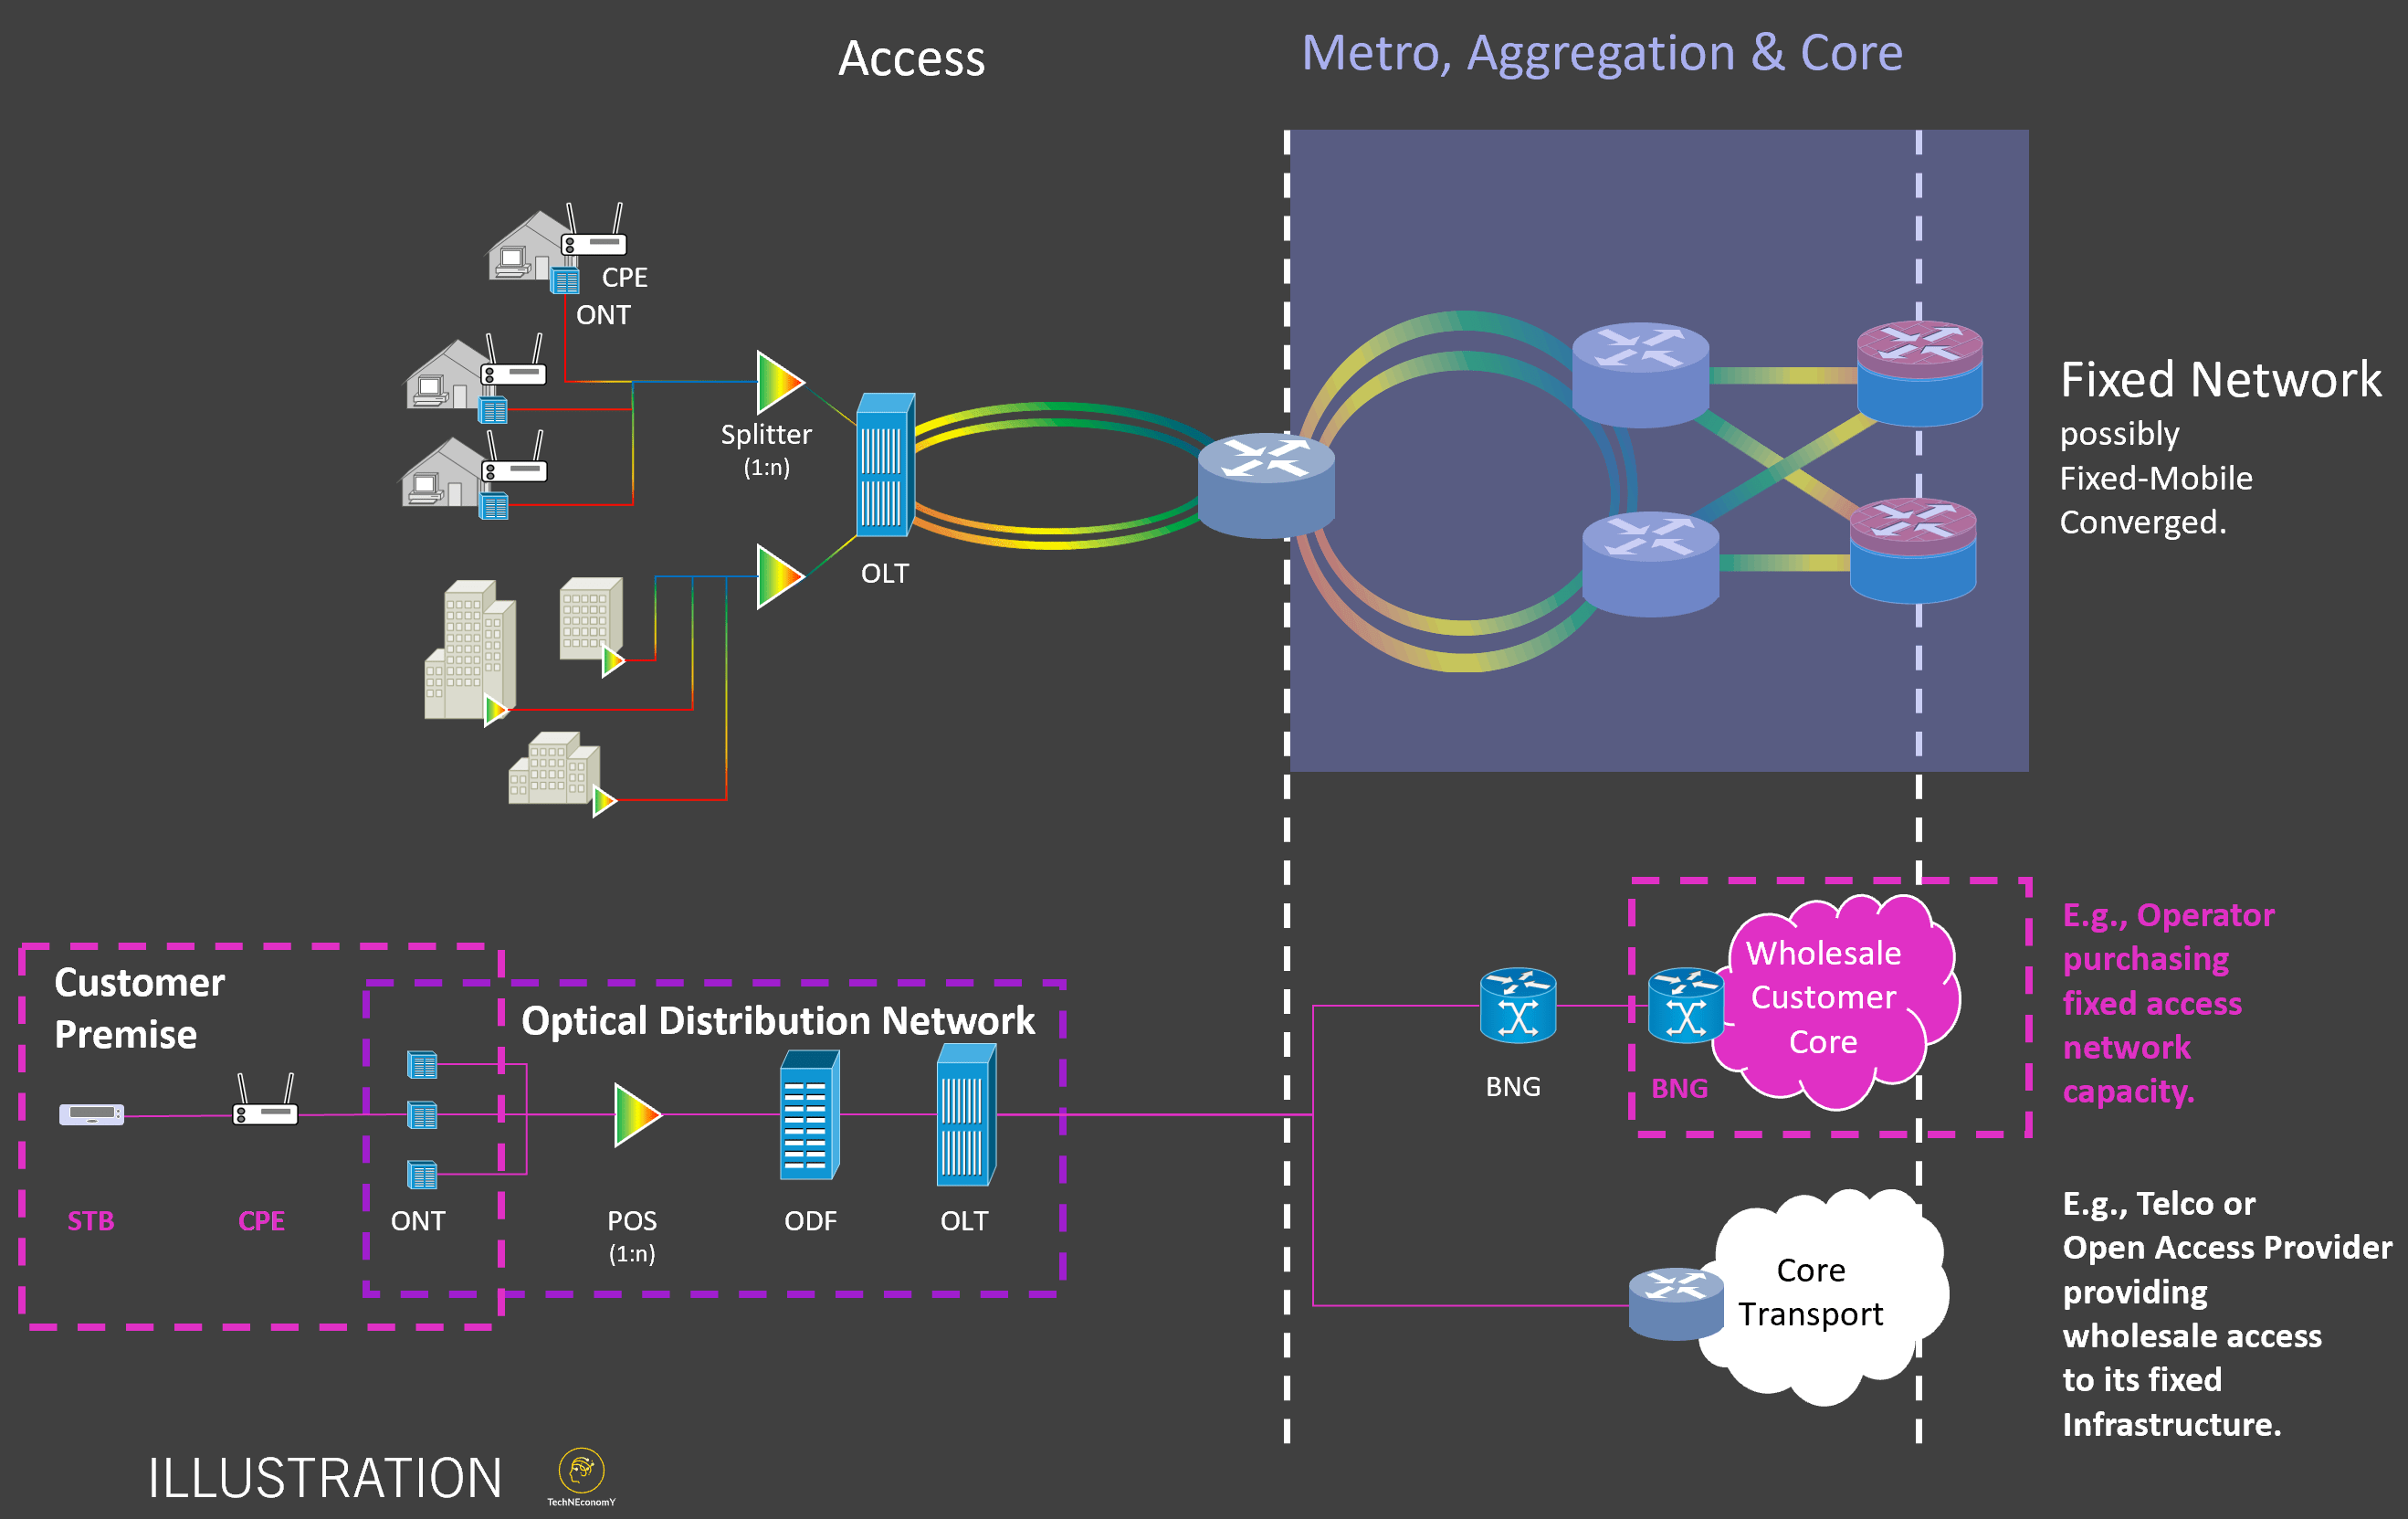


 or
or  ) is the direct driver of network load, and thus, network investments, the volumetric demand, is a manifestation of that throughput demand.
 being the number of active users in a given radio cell at the time-instant of unit t taken within a day.
  is the Bytes consumed in a time instant (e.g., typically a second); thus, 8
  bits/sec) in the same instant and take the maximum across. For example, a day provides the busiest hour throughput for the whole network. Each radio cell drives its capacity provision and supply (in bits/sec) and the investments required to provide that demanded capacity in the air interface and front- and back-haul.
 ) given in bits per second, the basic building block of quality, is relatively easy to estimate. The cellular throughput (per unit cell) is provided by the amount of committed frequency spectrum to the air interface, what your radio access network and antenna support are, multiplied by the so-called spectral efficiency in bits per Hz per cell. The spectral efficiency depends on the antenna technology and the underlying software implementation of signal processing schemes enabling the details of receiving and sending signals over the air interface.
 of ca. 20 Mbps/MHz/cell (i.e.,
  ), we should expect to have a cell throughput on average at 1,000 Mbps (1 Gbps).