"It doesn't matter how beautiful your idea is, it doesn't matter how smart or important you are. If the idea doesn't agree with reality, it's wrong", Richard Feynman (paraphrased)
How to think about a single network future? What does it entail, and what is it good for?
Well, imagine a world where your mobile device, unchanged and unmodified, connects to the nearest cell tower and satellites orbiting Earth, ensuring customers will always be best connected, getting the best service, irrespective of where they are. Satellite-based supplementary coverage (from space) seeks to deliver on this vision by leveraging superior economic coverage in terms of larger footprint (than feasible with terrestrial networks) and better latency (compared to geostationary satellite solutions) to bring connectivity directly to unmodified consumer handsets (e.g., smartphone, tablet, IoT devices), enhance emergency communication, and foster advancements in space-based technologies. The single network future does not only require certain technological developments, such as 3GPP Non-Terrestrial Network standardization efforts (e.g., Release 17 and forward). We also need the regulatory spectrum policy to change, allowing today’s terrestrially- and regulatory-bounded cellular frequency spectra to be re-used by satellite operators providing the same mobile service under satellite coverage in areas without terrestrial communications infrastructure, as mobile customers enjoy within the normal terrestrial cellular network.
It is estimated that less than 40% of the world’s population, or roughly 2.9 billion people, have never used the internet (as of 2023). That 60% of the world population have access to internet and 40% have not, is the digital divide. A massive gap most pronounced in developing countries, rural & remote areas, and among older populations and economically disadvantaged groups. Most of the 2.9 billion on the wrong side of the divide live in areas lacking terrestrial-based technology infrastructure that would readily facilitate access to the internet. It lacks the communications infrastructure because it may either be impractical or (and) un-economical to deploy, including difficulty in monetizing and yielding a positive return on investment over a relatively short period. Satellites that are allowed by regulatory means to re-use terrestrially-based cellular spectrum for supplementary (to terrestrial) coverage can largely solve the digital divide challenges (as long as affordable mobile devices and services are available to the unconnected).
Federal Communications Commission (FCC) recently published a new regulatory framework (“Report & Order and further notice of proposed rulemaking“) designed to facilitate the integration of satellite and terrestrial networks to provide Supplemental Coverage from Space (SCS), marking a significant development toward achieving ubiquitous connectivity. In the following, I will use the terms “SCS framework” and ” SCS initiative” to cover the reference to the FCC’s regulatory framework. The SCS initiative, which, to my knowledge, is the first of its kind globally, aims to allow satellite operators and terrestrial service providers to collaborate, leveraging the spectrum previously allocated exclusively for terrestrial services to extend connectivity directly to consumer handsets, what is called satellite direct-to-device (D2D), especially in remote, unserved, and underserved areas. The proposal is expected to enhance emergency communication availability, foster advancements in space-based technologies, and promote the innovative and efficient use of spectrum resources.
The “Report and Order” formalizes a spectrum-use framework, adopting a secondary mobile-satellite service (MSS) allocation in specific frequency bands devoid of primary non-flexible-use legacy incumbents, both federal and non-federal. Let us break this down in a bit more informal language. So, the FCC proposes to designate certain parts of the radio frequency spectrum (see below) for mobile-satellite services on a “secondary” basis. In spectrum management, an allocation is deemed “secondary” when it allows for the operation of a service without causing interference to the “primary” services in the same band. This means that the supplementary satellite service, deemed secondary, must accept interference from primary services without claiming protection. Moreover, this only applies to locations that lack (i.e., devoid of) the use of a given frequency band by existing ” primary” spectrum users (i.e., incumbents), non-federal as well as federal primary uses.
The setup encourages collaboration and permits supplemental coverage from space (SCS) in designated bands where terrestrial licensees, holding all licenses for a channel throughout a geographically independent area (GIA), lease access to their terrestrial spectrum rights to a satellite operator. Furthermore, the framework establishes entry criteria for satellite operators to apply for or modify an existing “part 25” space station license for SCS operations, that is the regulatory requirements established by the FCC governing the licensing and operation of satellite communications in the United States. The framework also outlines a licensing-by-rule approach for terrestrial devices acting as SCS earth stations, referring to a regulatory and technological framework where conventional consumer devices, such as smartphones or tablets, are equipped to communicate directly with satellites (after all we do talk about Direct-2-Device).
The above picture showcases a moment in the remote Arizona desert where an individual receives a direct signal to the device from a Low-Earth Orbit (LEO) satellite to his or her smartphone. The remote area has no terrestrial cellular coverage, and supplementary coverage from space is the only way for individuals with a subscription to access their cellular services or make a distress call apart from using a costly satellite phone service. It should be remembered that the SCS service is likely to be capacity-limited due to the typical large satellite coverage area and possible limited available SCS spectrum bandwidth.
Additionally, the Further Notice of Proposed Rulemaking seeks further commentary on aspects such as 911 service provision and the protection of radio astronomy, indicating the FCC’s consistent commitment to refining and expanding the SCS framework responsibly. This commitment ensures that the framework will continue to evolve, adapting to new challenges and opportunities and providing a solid foundation for future developments.
BALANCING THE AIRWAVES IN THE USA.
Two agencies in the US manage the frequency spectrum, the Federal Communications Commission (FCC) and the National Telecommunications and Information Administration (NTIA) . They collaboratively manage and coordinate frequency spectrum use and reuse for satellites, among other applications, within the United States. This partnership is important for maintaining a balanced approach to spectrum management that supports federal and non-federal needs, ensuring that satellite communications and other services can operate effectively without causing harmful interference to each other.
The Federal Communications Commission, the FCC for short, is an independent agency that exclusively regulates all non-Federal spectrum use across the United States. FCC allocates spectrum licenses for commercial use, typically through spectrum auctions. A new or re-purposed commercialized spectrum has been reclaimed from other uses, both from federal uses and existing commercial uses. Spectrum can be re-purposed either because newer, more spectrally efficient technologies become available (e.g., the transition from analog to digital broadcasting) or it becomes viable to shift operation to other spectrum bands with less commercial value (and, of course, without jeopardizing existing operational excellence). It is also possible that spectrum, previously having been for exclusive federal use (e.g., military applications, fixed satellite uses, etc.), can be shared, such as the case with Citizens Broadband Radio Service (CBRS), which allows non-federal parties access to 150 MHz in the 3.5 GHz band (i.e., band 48). However, it has recently been concluded that (centralized) dynamic spectrum sharing only works in certain use cases and is associated with considerable implementation complexities. Multiple parties with possible vastly different requirements co-exist within a given band, which is a work in progress and may not be consistent with the commercialized spectrum operation required for high-quality broadband cellular operation.
Alongside the FCC, the National Telecommunications and Information Administration(NTIA) plays a crucial role in US spectrum management. The NTIA is the sole authority responsible for authorizing Federal spectrum use. It also serves as the principal adviser on telecommunications policies to the President of the United States, coordinating the views of the Executive Branch. The NTIA manages a significant portion of the spectrum, approximately 2,398 MHz (69%), within the range of 225 MHz to 3.7 GHz, known as the ‘beachfront spectrum’. Of the total 3,475 MHz, 591 MHz (17%) is exclusively for Federal use, and 1,807 MHz (52%) is shared or coordinated between Federal and non-Federal entities. This leaves 1,077 MHz (31%) for exclusive commercial use, which falls under the management of the FCC.
NTIA, in collaboration with the FCC, has been instrumental in the past in freeing up substantial C-band spectrum, 480 MHz in total, of which 100 MHz is conditioned on prioritized sharing (i.e., Auction 105), for commercial and shared use that subsequently has been auctioned off over the last three years raising USD 109 billion. In US Dollar (USD) per MHz per population count (pop), we have, on average, ca. USD 0.68 per MHz-pop from the C-band auctions in the US, compared to USD 0.13 per MHz-pop in Europe C-band auctions and USD 0.23 per MHz-pop in APAC auctions. It should be remembered that the United States exclusive-use spectrum licenses can be regarded as an indefinite-lived intangible asset, while European spectrum rights expire between 10 and 20 years. This may explain a big part of the difference between US-based spectrum pricing and Europe and Asia.
The FCC and the NTIA jointly manage all the radio spectrum in the United States, licensed (e.g., cellular mobile frequencies, TV signals) and unlicensed (e.g., WiFi, MW Owens). The NTIA oversees spectrum use for Federal purposes, while the FCC is responsible for non-Federal use. In addition to its role in auctioning spectrum licenses, the FCC is also authorized to redistribute licenses. This authority allows the FCC to play a vital role in ensuring efficient spectrum use and adapting to changing needs.
THE SINGLE NETWORK.
The Supplementary Coverage from Space (SCS) framework creates an enabling regulatory framework for satellite operators to provide mobile broadband services to unmodified mobile devices (i.e., D2D services), such as smartphones and other terrestrial cellular devices, in rural and remote areas without such services, where no or only scarce terrestrial infrastructure exists. By leveraging SCS, terrestrial cellular broadband services will be enhanced, and the combination may result in a unified network. This network will ensure continuous and ubiquitous access to communication services, overcoming geographical and environmental challenges. Thus, this led to the inception of the Single Network that can provide seamless connectivity across diverse environments, including remote, unserved, and underserved areas.
The above picture illustrates the idea behind the FCC’s SCS framework and “Single Network” on a high level. In this example, an LEO satellite provides direct-to-device (D2D) supplementary coverage in rural and remote areas, using an advanced phase-array antenna, to unmodified user equipment (e.g., smartphone, tablet, cellular-IoT, …) in the same frequency band (i.e., f1,sat) owned and used by a terrestrial operator operating a cellular network (f1). The LEO satellite operator must partner with the terrestrial spectrum owner to manage and coordinate the frequency re-use in areas where the frequency owner (i.e., mobile/cellular operator) does not have the terrestrial-based infrastructure to deliver a service to its customers (i.e., typically remote, rural areas where terrestrial infrastructure is impractical and uneconomic to deploy). The satellite operator has to avoid geographical regions where the frequency (e.g., f1) is used by the spectrum owner, typically in urban, suburban, and rural areas (where terrestrial cellular infrastructure has already been deployed and service offered).
How does the “Single Network” of FCC differ from the 3GPP Non-Terrestrial Network (NTN) standardization? Simply put, the “Single Network” is a regulatory framework that paves the way for satellite operators to re-use the terrestrial cellular spectrum on their non-terrestrial (satellite-based) network. The 3GPP NTN standardization initiatives, e.g., Release 16, 17 and 18+, are a technical effort to incorporate satellite communication systems within the 5G network architecture. Shortly, the following 3GPP releases are it relates to how NTN should function with terrestrial 5G networks;
Release 15 laid the groundwork for 5G New Radio (NR) and started to consider the broader picture of integrating non-terrestrial networks with terrestrial 5G networks. It marks the beginning of discussions on how to accommodate NTNs within the 5G framework, focusing on study items rather than specific NTN standards.
Release 16 took significant steps toward defining NTN by including study items and work items specifically aimed at understanding and specifying the adjustments needed for NR to support communication with devices served by NTNs. Release 16 focuses on identifying modifications to the NR protocol and architecture to accommodate the unique characteristics of satellite communication, such as higher latency and different mobility characteristics compared to terrestrial networks.
Release 17 further advancements in NTN specifications aiming to integrate specific technical solutions and standards for NTNs within the 5G architecture. This effort includes detailed specifications for supporting direct connectivity between 5G devices and satellites, covering aspects like signal timing, frequency bands, and protocol adaptations to handle the distinct challenges posed by satellite communication, such as the Doppler effect and signal delay.
Release 18 and beyond will continue to evolve its standards to enhance NTN support, addressing emerging requirements and incorporating feedback from early implementations. These efforts include refining and expanding NTN capabilities to support a broader range of applications and services, improving integration with terrestrial networks, and enhancing performance and reliability.
The NTN architecture ensures (should ensure) that satellite communications systems can seamlessly integrate into 5G networks, supporting direct communication between satellites and standard mobile devices. This integration idea includes adapting 5G protocols and technologies to accommodate the unique characteristics of satellite communication, such as higher latency and different signal propagation conditions. The NTN standardization aims to expand the reach of 5G services to global scales, including maritime, aerial, and sparsely populated land areas, thereby aligning with the broader goal of universal service coverage.
The FCC’s vision of a “single network” and the 3GPP NTN standardization aims to integrate satellite and terrestrial networks to extend connectivity, albeit from slightly different angles. The FCC’s concept provides a regulatory and policy framework to enable such integration across different network types and service providers, focusing on the broad goal of universal connectivity. In contrast, 3GPP’s NTN standardization provides the technical specifications and protocols to make this integration possible, particularly within next-generation (5G) networks. At the same time, 3GPP’s NTN efforts address the technical underpinnings required to realize that vision in practice, especially for 5G technologies. The FCC’s “single network” concept lays the regulatory foundation for enabling satellite and terrestrial cellular network service integration to the same unmodified device portfolio. Together, they are highly synergistic, addressing the regulatory and technical challenges of creating a seamlessly connected world.
Depicting a moment in the Colorado mountains, a hiker receives a direct signal from a Low Earth Orbit (LEO) satellite supplementary coverage to their (unmodified) smartphone. The remote area has no terrestrial cellular coverage. It should be remembered that the SCS service is likely to be capacity-limited due to the typical large satellite coverage area and possible limited available SCS spectrum bandwidth.
SINGLE NETWORK VS SATELLITE ATC
The FCC’s Single Network vision and the Supplemental Coverage from Space (SCS) concept, akin to the Satellite Ancillary Terrestrial Component (ATC) architectural concept (an area that I spend a significant portion of my career working on operationalizing and then defending … a different story though), share a common goal of merging satellite and terrestrial networks to fortify connectivity. These strategies, driven by the desire to enhance the reach and reliability of communication services, particularly in underserved regions, hold the promise of expanded service coverage.
The Single Network and SCS initiatives broadly focus on comprehensively integrating satellite services with terrestrial infrastructures, aiming to directly connect satellite systems with standard consumer devices across various services and frequency bands. This expansive approach seeks to ensure ubiquitous connectivity, significantly closing the coverage gaps in current network deployments. Conversely, the Satellite ATC concept is more narrowly tailored, concentrating on using terrestrial base stations to complement and enhance satellite mobile services. This method explicitly addresses the need for improved signal availability and service reliability in urban or obstructed areas by integrating terrestrial components within the satellite network framework.
Although the Single Network and Satellite ATC shared goals, the paths to achieving them diverge significantly in the application, regulatory considerations, and technical execution. The SCS concept, for instance, involves navigating regulatory challenges associated with direct-to-device satellite communications, including the complexities of spectrum sharing and ensuring the harmonious coexistence of satellite and terrestrial services. This highlights the intricate nature of network integration, making your audience more aware of the regulatory and technical hurdles in this field.
The distinction between the two concepts lies in their technological and implementation specifics, regulatory backdrop, and focus areas. While both aim to weave together the strengths of satellite and terrestrial technologies, the Single Network and SCS framework envisions a more holistic integration of connectivity solutions, contrasting with the ATC’s targeted approach to augmenting satellite services with terrestrial network support. This illustrates the evolving landscape of communication networks, where the convergence of diverse technologies opens new avenues for achieving seamless and widespread connectivity.
THE RELATED SCS FREQUENCIES & SPECTRUM.
The following frequency bands and the total bandwidth associated with the frequency have by the FCC been designated for Supplemental Coverage from Space (SCS):
70MHz @ 600 MHz Band
96 MHz @ 700 MHz Band
50 MHz @ 800 MHz Band
130 MHz @ Broadband PCS
10 MHz @ AWS-H Block
The above comprises a total frequency bandwidth of 350+ MHz, currently used for terrestrial cellular services across the USA. According to the FCC, the above frequency bands and spectrum can also be used for satellite direct-to-device SCS services to normal mobile devices without built-in satellite transceiver functionality. Of course, this is subject to spectrum owners’ approval and contractual and commercial arrangements.
Moreover, the 758-769/788-799 MHz band, licensed to the First Responder Network Authority (FirstNet), is also eligible for SCS under the established framework. This frequency band has been selected to enhance connectivity in remote, unserved, and underserved areas by facilitating collaborations between satellite and terrestrial networks within these specific frequency ranges.
SpaceX recently reported a peak download speed of 17 Mb/s from a satellite direct to an unmodified Samsung Android Phone using 2×5 MHz of T-Mobile USA’s PCS (i.e., the G-block). The speed corresponds to a downlink spectral efficiency of ~3.4 Mbps/MHz/beam, which is pretty impressive. Using this as rough guidance for the ~350 MHz, we should expect this to be equivalent to an approximate download speed of ca. 600 Mbps (@ 175 MHz) per satellite beam. As the satellite antenna technology improves, we should expect that spectral efficiency will also increase, resulting in increasing downlink throughput.
SCS INFANCY, BUT ALIVE AND KICKING.
In the FCC’s framework on the Supplemental Coverage from Space (SCS), the partnership between SpaceX and T-Mobile is described as a collaborative effort where SpaceX would utilize a block of T-Mobile’s mid-band Personal Communications Services (PCS G-Block) spectrum across a nationwide footprint. This initiative aims to provide service to T-Mobile’s subscribers in rural and remote locations, thereby addressing coverage gaps in T-Mobile’s terrestrial network. The FCC has facilitated this collaboration by allowing SpaceX and T-Mobile to deploy and test their proposed SCS system while their pending applications and the FCC’s proceedings continue.
Specifically, SpaceX has been authorized (by FCC’s Space Bureau) to deploy a modified version of its second-generation (2nd generation) Starlink satellites with SCS-capable antennas that can operate in specific frequencies. FCC authorized experimental testing on terrestrial locations for SpaceX and T-Mobile to progress with their SCS system, although SpaceX’s requests for broader authority remain under consideration by the FCC.
Lynk Global has partnered with mobile network operators (MNOs) outside the United States to allow the MNOs’ customers to send texts using Lynk’s satellite network. In 2022, the FCC authorized Lynk’s request to operate a non-geostationary satellite orbit (NGSO) satellite system (e.g., Low-Earth Orbit, Medium Earth Orbit, or Highly-Elliptical Orbit) intended for text message communications in locations outside the United States and in countries where Lynk has obtained agreements with MNOs and the required local regulatory approval. Lynk aims to deploy ten mobile-satellite service (MSS) satellites as part of a “cellular-based satellite communications network” operating on cellular frequencies globally in the 617-960 MHz band (i.e., within the UHF band), targeting international markets only.
Lynk has announced contracts with more than 30 MNOs (full list not published) covering over 50 countries for Lynk’s “satellite-direct-to-standard-mobile-phone-system,” which provides emergency alerts and two-way Short Message Service (SMS) messaging. Lynk currently has three LEO satellites in orbit as of March 2023, and they plan to expand their constellation to include up to 5,000 satellites with 50 additional satellites planned for end of 2024, and with that substantially broadening its geographic coverage and service capabilities. Lynk recently claimed that they had in Hawaii achieved repeated successful downlink speeds above 10 Mbps with several mass market unmodified smartphones (10+ Mbps indicates a spectral efficiency of 2+ Mbps/MHz/beam). Lynk Mobile has also, recently (July 2023) demonstrated (as a proof of concept) phone calls via their LEO satellite between two unmodified smartphones (see the YouTube link).
AST SpaceMobile is also mentioned for its partnerships with several MNOs, including AT&T and Vodafone, to develop its direct-to-device or satellite-to-smartphone service. Overall AST SpaceMobile has announced it has entered into “more than 40 agreements and understandings with mobile network operators globally” (e.g., AT&T, Vodafone, Rakuten, Orange, Telefonica, TIM, MTN, Ooredoo, …). In 2020, AST filed applications with the FCC seeking U.S. market access for gateway links in the V-band for its SpaceMobile satellite system, which is planned to consist of 243 LEO satellites. AST clarified that its operation in the United States would collaborate with terrestrial licensee partners without seeking to operate independently on terrestrial frequencies.
AST SpaceMobile’s satellite antenna design marks a pioneering step in satellite communications. AST recently deployed the largest commercial phased array antenna into Low Earth Orbit (LEO). On September 10, 2022, AST SpaceMobile launched its prototype direct-to-device testbed BlueWalker 3 (BW3) satellite. This mission marked a significant step forward in the company’s efforts to test and validate its technology for providing direct-to-cellphone communication via a Low Earth Orbit (LEO) satellite network. The launch of BW3 aimed to demonstrate the capabilities of its large phased array antenna, a critical component for the AST’s targeted global broadband service.
The BW3’s phased array antenna with a surface area of 64 square meters is technologically quite advanced (actually, I find it very beautiful and can’t wait to see the real thing for their commercial constellation) and designed for dynamic beamforming as one would expect for a state-of-art direct-to-device satellite. The BlueWalker 3, a proof of concept design, supports a frequency range of 100 MHz in the UHF band, with 5 MHz channels and a spectral efficiency expected to be 3 Mbps/MHz/channel. This capability is crucial for establishing direct-to-device communications, as it allows the satellite to concentrate its signals on specific geographic areas or directly on mobile devices, enhancing the quality of coverage and minimizing potential interference with terrestrial networks. AST SpaceMobile is expected to launch the first 5 of 243 LEO satellites, BlueBirds, on SpaceX’s Falcon 9 in the 2nd quarter of 2024. The first 5 will be similar to BW3 design including the phased array antenna. Subsequent AST satellites are expected to be larger with substantially up-scaled phased array antenna supporting an even larger frequency span covering the most of the UHF band and supporting 40 MHz channels with peak download speeds of 120 Mbps (using their estimated 3 Mbps/MHz/channel).
These above examples underscore the the ongoing efforts and potential of satellite service providers like Starlink/SpaceX, Lynk Global, and AST SpaceMobile within the evolving SCS framework. The examples highlight the collaborative approach between satellite operators and terrestrial service providers to achieve ubiquitous connectivity directly to unmodified cellular consumer handsets.
PRACTICAL PREREQUISITES.
In general, the satellite operator would need a terrestrial frequency license owner willing to lease out its spectrum for services in areas where that spectrum has not been deployed on its network infrastructure or where the license holder has no infrastructure deployed. And, of course, a terrestrial communication service provider owning spectrum and interested in extending services to remote areas would need a satellite operator to provide direct-to-device services to its customers. Eventually, terrestrial operators might see an economic benefit in decommissioning uneconomical rural terrestrial infrastructure and providing satellite broadband cellular services instead. This may be particularly interesting in low-density rural and remote areas supported today by a terrestrial communications infrastructure.
Under the SCS framework, terrestrial spectrum owners can make leasing arrangements with satellite operators. These agreements would allow satellite services to utilize the terrestrial cellular spectrum for direct satellite communication with devices, effectively filling coverage gaps with satellite signals. This kind of arrangement could be similar to the one between T-Mobile USA and StarLink to offer cellular services in the absence of T-Mobile cellular infrastructure, e.g., mainly remote and rural areas.
As the regulatory body for non-federal frequencies, the FCC delineates a regulatory environment that specifies the conditions under which the spectrum can be shared or used by terrestrial and satellite services, minimizing the risk of harmful interference (which both parties should be interested in anyway). This includes setting technical standards and identifying suitable frequency bands supporting dual use. The overarching goal is to bolster the reach and reliability of cellular networks in remote areas, enhancing service availability.
For terrestrial cellular networks and spectrum owners, this means adhering to FCC regulations that govern these new leasing arrangements and the technical criteria designed to protect incumbent services from interference. The process involves meticulous planning and, if necessary, implementing measures to mitigate interference, ensuring that the integration of satellite and terrestrial networks proceeds smoothly.
Moreover, the SCS framework should leapfrog innovation and allow network operators to broaden their service offerings into areas where they are not present today. This could include new applications, from emergency communications facilitated by satellite connectivity to IoT deployments and broadband access in underserved locations.
Depicting a moment somewhere in the Arctic (e.g., Greenland), an eco-tourist receives a direct signal from a Low Earth Orbit (LEO) satellite supplementary coverage to their (unmodified) smartphone. The remote area has no terrestrial cellular coverage. It should be remembered that the SCS service is likely to be capacity-limited due to the typical large satellite coverage area and possible limited available SCS spectrum bandwidth. Several regulatory, business, and operational details must be in place for the above service to work.
TECHNICAL PREREQUISITES FOR DELIVERING SATELLITE SCS SERVICES.
Satellite constellations providing D2D services are naturally targeting supplementary coverage of geographical areas where no terrestrial cellular services are present at the target frequency bands used by the satellite operator.
As the satellite operator has gotten access to the terrestrial cellular spectrum for its supplementary coverage direct-to-device service, it has a range of satellite technical requirements that either need to be in place of an existing constellation (though that might require some degree of foresight) or a new satellite would need to be designed consistent with frequency band and range, the targeted radio access technology such as LTE or 5G (assuming the ambition eventually is beyond messaging), and the device portfolio that the service aims to support (e.g., smartphone, tablet, IoTs, …). In general, I would assume that existing satellite constellations would not automatically support SCS services they have not been designed for upfront. It would make sense (economically) if a spectrum arrangement already exists between the satellite and terrestrial cellular spectrum owner and operator.
Direct-to-device LEO satellites directly connect to unmodified mobile devices such as smartphones, tablets, or other personal devices. This necessitates a design that can accommodate low-power signals and small antennas typically found on consumer devices. Therefore, these satellites often incorporate advanced beamforming capabilities through phased array antennas to focus signals precisely on specific geographic locations, enhancing signal strength and reliability for individual users. Moreover, the transceiver electronics must be highly sensitive and capable of handling simultaneous connections, each potentially requiring different levels of service quality. As the satellite provides services over remote and scarcely populated areas, at least initially, there is no need for high-capacity designs, e.g., typically requiring terrestrial cellular-like coverage areas and large frequency bandwidths. The satellites are designed to operate in frequency bands compatible with terrestrial consumer devices, necessitating coordination and compliance with various regulatory standards compared to traditional satellite services.
Implementing satellite-based SCS successfully hinges on complying with many fairly sophisticated technical requirements, such as phased array antenna design and transceiver electronics, enabling direct communication with consumer devices terrestrially. The phased array antenna, a cornerstone of this architecture, must possess advanced beamforming capabilities, allowing it to dynamically focus and steer its signal beams towards specific geographic areas or even moving targets on the Earth’s surface. This flexibility is super important for maximizing the coverage and quality of the communication link with individual devices, which might be spread across diverse and often challenging terrains. The antenna design needs to be wideband and highly efficient to handle the broad spectrum of frequencies designated for SCS operations, ensuring compatibility with the communication standards used by consumer devices (e.g., 4G LTE, 5G).
An illustration of a LEO satellite with a phased array antenna providing direct to smartphone connectivity at a 850 MHz carrier frequency. All practical purposes the antenna beamforming at a LEO altitude can be considered far-field. Thus the electromagnetic fields behave as planar waves and the antenna array becomes more straightforward to design and to manage performance (e.g., beam steering at very high accuracy).
Designing phased array antennas for satellite-based direct-to-device services, envisioned by the SCS framework, requires considering various technical design parameters to ensure the system’s optimal performance and efficiency. These antennas are crucial for effective direct-to-device communication, encompassing multiple technical and practical considerations.
The SCS frequency band not only determines the operational range of the antenna but also its ability to communicate effectively with ground-based devices through the Earth’s atmosphere; in this respect, lower frequencies are better than higher frequencies. The frequency, or frequencies, significantly influences the overall design of the antenna, affecting everything from its physical dimensions to the materials used in its construction. The spacing and configuration of the antenna elements are carefully planned to prevent interference while maximizing coverage and connectivity efficiency. Typically, element spacing is kept around half the operating frequency wavelength, and the configuration involves choosing linear, planar, or circular arrays.
Beamforming capabilities are at the heart of the phased array design, allowing for the precise direction of communication beams toward targeted areas on the ground. This necessitates advanced signal processing to adjust signal phases dynamically and amplitudes, enabling the system to focus its beams, compensate for the satellite’s movement, and handle numerous connections.
The antenna’s polarization strategy is chosen to enhance signal reception and minimize interference. Dual (e.g., horizontal & vertical) or circular (e.g., right or left hand) polarization ensures compatibility with a wide range of devices and as well as more efficient spectrum use. Polarization refers to the orientation of the electromagnetic waves transmitted or received by an antenna. In satellite communications, polarization is used to differentiate between signals and increase the capacity of the communication link without requiring additional frequency bandwidth.
Physical constraints of size, weight, and form factor are also critical, dictated by the satellite’s design and launch parameters, including the launch cost. The antenna must be compact and lightweight to fit within the satellite’s structure and comply with launch weight limitations, impacting the satellite’s overall design and deployment mechanisms.
Beyond the antenna, the transceiver electronics within the satellite play an important role. These must be capable of handling high-throughput data to accommodate simultaneous connections, each demanding reliable and quality service. Sensitivity is another critical factor, as the electronics need to detect and process the relatively weak signals sent by consumer-grade devices, which possess much less power than traditional ground stations. Moreover, given the energy constraints inherent in satellite platforms, these transceiver systems must efficiently manage the power to maintain optimal operation over long durations as it directly relates to the satellite’s life span.
Operational success also depends on the satellite’s compliance with regulatory standards, particularly frequency use and signal interference. Achieving this requires a deep integration of technology and regulatory strategy, ensuring that the satellite’s operations do not disrupt existing services and align with global communication protocols.
CONCERNS.
The FCC’s Supplemental Coverage from Space (SCS) framework has been met with both anticipation and critique, reflecting diverse stakeholder interests and concerns. While the framework aims to enhance connectivity by integrating satellite and terrestrial networks, several critiques and concerns have been raised:
Interference concerns: A primary critique revolves around potential interference with existing terrestrial services. Stakeholders worry that SCS operations might disrupt the current users, including terrestrial mobile networks and other satellite services. A significant challenge is ensuring that SCS services coexist harmoniously with these incumbent services without causing harmful interference.
Certification of terrestrial mobile devices: FCC requires that terrestrial mobile devices has to be certified SCS. The expressed concerns have been multifaceted, reflecting the complexities of integrating satellite communication capabilities into standard consumer mobile devices. These concerns, as in particular highlighted in the FCC’s SCS framework, revolving around technical, regulatory, and practical aspects. As 3GPP NTN standardization are considering changes to mobile devices that would enhance the direct connectivity between device and satellite, it may at least for devices developed for NTN communication make sense to certify those.
Spectrum allocation and management: Spectrum allocation for SCS poses another concern, particularly the repurposing of spectrum bands previously dedicated to other uses. Critics argue that spectrum reallocation must be carefully managed to avoid disadvantaging existing services or limiting future innovation in those bands.
Regulatory and licensing framework: The complexity of the regulatory and licensing framework for SCS services has also been a point of contention. Critics suggest that the framework could be burdensome for new entrants or more minor players, potentially stifling innovation and competition in the satellite and telecommunications industries.
Technical and operational challenges: The technical requirements for SCS, including the need for advanced phased array antennas and the integration of satellite systems with terrestrial networks, pose significant challenges. Concerns about the feasibility and cost of developing and deploying the necessary technology at scale have been raised.
Market and economic impacts: There are concerns about the SCS framework’s economic implications, particularly its impact on existing market dynamics. Critics worry that the framework might favor certain players or technologies, potentially leading to market consolidation or barriers to entry for innovative solutions.
Environmental and space traffic management: The increased deployment of satellites for SCS services raises concerns about space debris and the sustainability of space activities. Critics emphasize the need for robust space traffic management and debris mitigation strategies to ensure the long-term viability of space operations.
Global coordination and equity: The global nature of satellite communications underscores the need for international coordination and equitable access to SCS services. Critics point out the importance of ensuring that the benefits of SCS extend to all regions, particularly those currently underserved by telecommunications infrastructure.
A. Vanelli-Coralli, N. Chuberre, G. Masini, A. Guidotti, M. El Jaafari, “5G Non-Terrestrial Networks.”, Wiley (2024). A recommended reading for deep diving into NTN networks of satellites, typically the LEO kind, and High-Altitude Platform Systems (HAPS) such as stratospheric drones.
Professor Emil Björnson, “Basics of Antennas and Beamforming”, (2019). Provides a high-level understand of what beamforming is in relative simple terms.
Jon Brodkin, “Google and AT&T invest in Starlink rival for satellite-to-smartphone service”, Ars Technica (January 2024). There is a very nice picture of AST’s 64 square meter large BlueWalker 3 phased array antenna (i.e., with a total supporting bandwidth of 100 MHz with a channels of 5 MHz and a theoretical spectral efficiency of 3 Mbps/MHz/channel).
Lynk Global website: https://lynk.world/ (see also FCC Order and Authorization). It should be noted that Lynk can operate within 617 to 960 MHz (Space-to-Earth) and 663 to 915 MHz (Earth-to-Space). However, only outside the USA. Constellation Area: IoT / M2M, Satellite-to-Cellphone, Internet, Direct-to-Cell. 8 LEO satellites out of 10 planned.
NewSpace Index: https://www.newspace.im/ I find this resource to have excellent and up-to-date information on commercial satellite constellations.
If all current commercial satellite plans were to be realized within the next decade, we would have more, possibly substantially more, than 65 thousand satellites circling Earth. Today, that number is less than 10 thousand, with more than half that number realized by StarLink’s Low Earth Orbit (LEO) constellation over the last couple of years (i.e., since 2018).
While the “Arms Race” during the Cold War was “a thing” mainly between The USA and the former Soviet Union, the Space Race will, in my opinion, be “battled out” between the commercial interests of the West against the political interest of China (as illustrated in Figure 1 below). The current numbers strongly indicate that Europe, Canada, the Middle East, Africa, and APAC (minus China) will likely and largely be left on the sideline to watch the US and China impose, in theory, a “duopoly” in LEO satellite-based services. However, in practice, it will be a near-monopoly when considering security concerns between the West and the (re-defined) East block.
Figure 1 Illustrates my thesis that we will see a Space Race over the next 10 years between a (or very few) commercial LEO constellation, represented by a Falcon-9 like design (for maybe too obvious reasons), and a Chinese-state owned satellite constellation. (Courtesy: DALL-E).
As of end of 2023, more than 50% of launched and planned commercial LEO satellites are USA-based. Of those, the largest fraction is accounted for by the US-based StarLink constellation (~75%). More than 30% are launched or planned by Chinese companies headed by the state-owned Guo Wang constellation rivaling Elon Musk’s Starlink in ambition and scale. Europe comes in at a distant number 3 with about 8% of the total of fixed internet satellites. Apart from being disappointed, alas, not surprised by the European track record, it is somewhat more baffling that there are so few Indian and African satellite (there are none) constellations given the obvious benefits such satellites could bring to India and the African continent.
India is a leading satellite nation with a proud tradition of innovative satellite designs and manufacturing and a solid track record of satellite launches. However, regarding commercial LEO constellations, India still needs to catch up on some opportunities here. Having previously worked on the economics and operationalizing a satellite ATC (i.e., a satellite service with an ancillary terrestrial component) internet service across India, it is mind-blowing (imo) how much economic opportunity there is to replace by satellite the vast terrestrial cellular infrastructure in rural India. Not to mention a quantum leap in communication broadband services resilience and availability that could be provided. According to the StarLink coverage map, the regulatory approval in India for allowing StarLink (US) services is still pending. In the meantime, Eutelsat’s OneWeb (EU) received regulatory approval in late 2023 for its satellite internet service over India in collaboration with Barthi Enterprises (India), that is also the largest shareholder in the recently formed Eutelsat Group with 21.2%. Moreover, Jio’s JioSpaceFiber satellite internet services were launched in several Indian states at the end of 2023, using the SES (EU) MEO O3b mPower satellite constellation. Despite the clear satellite know-how and capital available, it appears there is little activity for Indian-based LEO satellite development, taking up the competition with international operators.
The African continent is attracting all the major LEO satellite constellations such as StarLink (US), OneWeb (EU), Amazon Kuipers (US), and Telesat Lightspeed (CAN). However, getting regulatory approval for their satellite-based internet services is a complex, time-consuming, and challenging process with Africa’s 54 recognized sovereign countries. I would expect that we will see the Chinese-based satellite constellations (e.g., Guo Wang) taking up here as well due to the strong ties between China and several of the African nations.
This article is not about SpaceX’s StarLink satellite constellation. Although StarLink is mentioned a lot and used as an example. Recently, at the Mobile World Congress 2024 in Barcelona, talking to satellite operators (but not StarLink) providing fixed broadband satellite services, we joked about how long into a meeting we could go before SpaceX and StarLink would be mentioned (~ 5 minutes where the record, I think).
This article is about the key enablers (frequencies, frequency bandwidth, antenna design, …) that make up an LEO satellite service, the LEO satellite itself, the kind of services one should expect from it, and its limitations.
There is no doubt that LEO satellites of today have an essential mission: delivering broadband internet to rural and remote areas with little or no terrestrial cellular or fixed infrastructure to provide internet services. Satellites can offer broadband internet to remote areas with little population density and a population spread out reasonably uniformly over a large area. A LEO satellite constellation is not (in general) a substitute for an existing terrestrial communications infrastructure. Still, it can enhance it by increasing service availability and being an important remedy for business continuity in remote rural areas. Satellite systems are capacity-limited as they serve vast areas, typically with limited spectral resources and capacity per unit area.
In comparison, we have much smaller coverage areas with demand-matched spectral resources in a terrestrial cellular network. It is also easier to increase capacity in a terrestrial cellular system by adding more sectors or increasing the number of sites in an area that requires such investments. Adding more cells, and thus increasing the system capacity, to satellite coverage requires a new generation of satellites with more advanced antenna designs, typically by increasing the number of phased-array beams and more complex modulation and coding mechanisms that boost the spectral efficiency, leading to increased capacity and quality for the services rendered to the ground. Increasing the system capacity of a cellular communications system by increasing the number of cells (i.e., cell splitting) works the same in satellite systems as it does for a terrestrial cellular system.
So, on average, LEO satellite internet services to individual customers (or households), such as those offered by StarLink, are excellent for remote, lowly populated areas with a nicely spread-out population. If we de-average this statement. Clearly, within the satellite coverage area, we may have towns and settlements where, locally, the population density can be fairly large despite being very small over the larger footprint covered by the satellite. As the capacity and quality of the satellite is a shared resource, serving towns and settlements of a certain size may not be the best approach to providing a sustainable and good customer experience as the satellite resources exhaust rapidly in such scenarios. In such scenarios, a hybrid architecture is of much better use as well as providing all customers in a town or settlement with the best service possible leveraging the existing terrestrial communications infrastructure, cellular as well as fixed, with that of a satellite backhaul broadband connection between a satellite ground gateway and the broadband internet satellite. This is offered by several satellite broadband providers (both from GEO, MEO and LEO orbits) and has the beauty of not only being limited to one provider. Unfortunately, this particular finesse, is often overlooked by the awe of massive scale of the StarLink constellation.
AND SO IT STARTS.
When I compared the economics of stratospheric drone-based cellular coverage with that of LEO satellites and terrestrial-based cellular networks in my previous article, “Stratospheric Drones: Revolutionizing Terrestrial Rural Broadband from the Skies?”, it was clear that even if LEO satellites are costly to establish, they provide a substantial cost advantage over cellular coverage in rural and remote areas that are either scarcely covered or not at all. Although the existing LEO satellite constellations have limited capacity compared to a terrestrial cellular network and would perform rather poorly over densely populated areas (e.g., urban and suburban areas), they can offer very decent fixed-wireless-access-like broadband services in rural and remote areas at speeds exceeding even 100 Mbps, such as shown by the Starlink constellation. Even if the provided speed and capacity is likely be substantially lower than what a terrestrial cellular network could offer, it often provides the missing (internet) link. Anything larger than nothing remains infinitely better.
Low Earth Orbit (LEO) satellites represent the next frontier in (novel) communication network architectures, what we in modern lingo would call non-terrestrial networks (NTN), with the ability to combine both mobile and fixed broadband services, enhancing and substituting terrestrial networks. The LEO satellites orbit significantly closer to Earth than their Geostationary Orbit (GEO) counterparts at 36 thousand kilometers, typically at altitudes between 300 to 2,000 kilometers, LEO satellites offer substantially reduced latency, higher bandwidth capabilities, and a more direct line of sight to receivers on the ground. It makes LEO satellites an obvious and integral component of non-terrestrial networks, which aim to extend the reach of existing fixed and mobile broadband services, particularly in rural, un-and under-served, or inaccessible regions as a high-availability element of terrestrial communications networks in the event of natural disasters (flooding, earthquake, …), or military conflict, in which the terrestrial networks are taken out of operation.
Another key advantage of LEO satellite is that the likelihood of a line-of-sight (LoS) to a point on the ground is very high compared to establishing a LoS for terrestrial cellular coverage that, in general, would be very low. In other words, the signal propagation from a LEO satellite closely approximates that of free space. Thus, all the various environmental signal loss factors we must consider for a standard terrestrial-based cellular mobile network do not apply to our satellite with signal propagation largely being determined by the distance between the satellite and the ground (see Figure 2).
Figure 2 illustrates the difference between terrestrial cellular coverage from a cell tower and that of a Low Earth Orbit (LEO) Satellite. The benefit of seeing the world from above is that environmental and physical factors have substantially less impact on signal propagation and quality primarily being impacted by distance as it approximates free space propagation with signal attenuation mainly determined by the Line-of-Sight (LoS) distance from antenna to Earth. This situation is very different for a terrestrial-based cellular tower with its radiated signal being substantially compromised by environmental factors.
Low Earth Orbit (LEO) satellites, compared to GEO and MEO-based higher-altitude satellite systems, in general, have simpler designs and smaller sizes, weights, and volumes. Their design and architecture are not just a function of technological trends but also a manifestation of their operational environment. The (relative) simplicity of LEO satellites also allows for more standardized production, allowing for off-the-shelf components and modular designs that can be manufactured in larger quantities, such as the case with CubeSats standard and SmallSats in general. The lower altitude of LEO satellites translates to a reduced distance from the launch site to the operational orbit, which inherently affects the economics of satellite launches. This proximity to Earth means that the energy required to propel a satellite into LEO is significantly less than needed to reach Geostationary Earth Orbit (GEO), resulting in lower launch costs.
The advent of LEO satellite constellations marks an important shift in how we approach global connectivity. With the potential to provide ubiquitous internet coverage in rural and remote places with little or no terrestrial communications infrastructure, satellites are increasingly being positioned as vital elements in global communication. The LEO satellites, as well as stratospheric drones, have the ability to provide economical internet access, as addressed in my previous article, in remote areas and play a significant role in disaster relief efforts. For example, when terrestrial communication networks may be disrupted after a natural disaster, LEO satellites can quickly re-establish communication links to normal cellular devices or ad-how earth-based satellite systems, enabling efficient coordination of rescue and relief operations. Furthermore, they offer a resilient network backbone that complements terrestrial infrastructure.
The Internet of Things (IoT) benefits from the capabilities of LEO satellites. Particular in areas where there is little or no existing terrestrial communications networks. IoT devices often operate in remote or mobile environments, from sensors in agricultural fields to trackers across shipping routes. LEO satellites provide reliable connectivity to IoT networks, facilitating many applications, such as non- and near real-time monitoring of environmental data, seamless asset tracking over transcontinental journeys, and rapid deployment of smart devices in smart city infrastructures. As an example, let us look at the minimum requirements for establishing a LEO satellite constellation that can gather IoT measurements. At an altitude of 550 km the satellite would take ca. 1.5 hour to return to a given point on its orbit. Earth rotates (see also below) which require us to deploy several orbital planes to ensure that we have continuous coverage throughout the 24 hours of a day (assuming this is required). Depending on the satellite antenna design, the target coverage area, and how often a measurement is required, a satellite constellation to support an IoT business may not require much more than 20 (lower measurement frequency) to 60 (higher measurement frequency, but far from real real-time data collection) LEO satellites (@ 550 km).
For defense purposes, LEO satellite systems present unique advantages. Their lower orbits allow for high-resolution imagery and rapid data collection, which are crucial for surveillance, reconnaissance, and operational awareness. As typically more LEO satellites will be required, compared to a GEO satellite, such systems also offer a higher degree of redundancy in case of anti-satellite (ASAT) warfare scenarios. When integrated with civilian applications, military use cases can leverage the robust commercial infrastructure for communication and geolocation services, enhancing capabilities while distributing the system’s visibility and potential targets.
Standalone military LEO satellites are engineered for specific defense needs. These may include hardened systems for secure communication, resistance to jamming, and interception. For instance, they can be equipped with advanced encryption algorithms to ensure secure transmission of sensitive military data. They also carry tailored payloads for electronic warfare, signal intelligence, and tactical communications. For example, they can host sensors for detecting and locating enemy radar and communication systems, providing a significant advantage in electronic warfare. As the line between civilian and military space applications blurs, dual-use LEO satellite systems are emerging, capable of serving civilian broadband and specialized military requirements. It should be pointed out that there also military applications, such as signal gathering, that may not be compatible with civil communications use cases.
In a military conflict, the distributed architecture and lower altitude of LEO constellations may offer some advantages regarding resilience and targetability compared to GEO and MEO-based satellites. Their more significant numbers (i.e., 10s to 1000s) compared to GEO, and the potential for quicker orbital resupply can make them less susceptible to complete system takedown. However, their lower altitudes could make them accessible to various ASAT technologies, including ground-based missiles or space-based kinetic interceptors.
It is not uncommon to encounter academic researchers and commentators who give the impression that LEO satellites could replace existing terrestrial-based infrastructures and solve all terrestrial communications issues known to man. That is (of course) not the case. Often, such statements appears to be based an incomplete understanding of the capacity limitation of satellite systems. Due to satellites’ excellent coverage with very large terrestrial footprints, the satellite capacity is shared over very large areas. For example, consider an LEO satellite at 550 km altitude. The satellite footprint, or coverage area (aka ground swath), is the area on the Earth’s surface over which the satellite can establish a direct line of sight. The satellite footprint in our example diameter would be ca. five thousand five hundred kilometers. An equivalent area of ca. 23 million square kilometers is more than twice that of the USA (or China or Canada). Before you get too excited, the satellite antenna will typically restrict the surface area the satellite will cover. The extent of the observable world that is seen at any given moment by the satellite antenna is defined as the Field of View (FoV) and can vary from a few degrees (narrow beams, small coverage area) to 40 degrees or higher (wide beams, large coverage areas). At a FoV of 20 degrees, the antenna footprint would be ca. 2 thousand 400 kilometers, equivalent to a coverage area of ca. 5 million square kilometers.
In comparison, for a FoV of 0.8 degrees, the antenna footprint would only be 100 kilometers. If our satellite has a 16-satellite beam capability, it would translate into a coverage diameter of 24 km per beam. For the StarLink system based on the Ku-band (13 GHz) and a cell downlink (Satellite-to-Earth) capacity of ca. 680 Mbps (in 250 MHz) we would have ca. 2 Mbps per km2 unit coverage area. Compared to a terrestrial rural cellular site with 85 MHz (Downlink, Base station antenna to customer terminal), it would deliver 10+ Mbps per km2 unit coverage area.
It is always good to keep in mind that “Satellites mission is not to replace terrestrial communications infrastructures but supplement and enhance them”, and furthermore, “Satellites offer the missing (internet) link in areas where there is no terrestrial communications infrastructure present”.Satellites offer superior coverage to any terrestrial communications infrastructure. Satellites limitations are in providing capacity, and quality, at population scale as well as supporting applications and access technologies requiring very short latencies (e.g., smaller than 10 ms).
In the following, I will focus on terrestrial cellular coverage and services that LEO satellites can provide. At the end of my blog, I hope I have given you (the reader) a reasonable understanding of how terrestrial coverage, capacity, and quality work in a (LEO) satellite system and have given you an impression of key parameters we can add to the satellite to improve those.
EARTH ROTATES, AND SO DO SATELLITES.
Before getting into the details of low earth orbit satellites, let us briefly get a couple of basic topics off the table. Skipping this part may be a good option if you are already into and in the know satellites. Or maybe carry on an get a good laugh of those terra firma cellular folks that forgot about the rotation of Earth 😉
From an altitude and orbit (around Earth) perspective, you may have heard of two types of satellites: The GEO and the LEO satellites. Geostationary (GEO) satellites are positioned in a geostationary orbit at ~36 thousand kilometers above Earth. That the satellite is geostationary means it rotates with the Earth and appears stationary from the ground, requiring only one satellite to maintain constant coverage over an area that can be up to one-third of Earth’s surface. Low Earth Orbit (LEO) satellites are positioned at an altitude between 300 to 2000 kilometers above Earth and move relative to the Earth’s surface at high speeds, requiring a network or constellation to ensure continuous coverage of a particular area.
I have experienced that terrestrial cellular folks (like myself) when first thinking about satellite coverage are having some intuitive issues with satellite coverage. “We are not used to our antennas moving away from the targeted coverage area, and our targeted coverage area, too, is moving away from our antenna“. The geometry and dynamics of terrestrial cellular coverage are simpler than they are for satellite-based coverage. For LEO satellite network planners, it is not rocket science (pun intended) that the satellites move around in their designated orbit over Earth at orbital speeds of ca. 70 to 80 km per second. Thus, at an altitude of 500 km, a LEO satellite orbits Earth approximately every 1.5 hours. Earth, thankfully, rotates. Compared to its GEO satellite “cousin,” the LEO satellite ” is not “stationary” from the perspective of the ground. Thus, as Earth rotates, the targeted coverage area moves away from the coverage provided by the orbital satellite.
We need several satellites in the same orbit and several orbits (i.e., orbital planes) to provide continuous satellite coverage of a target area. This is very different from terrestrial cellular coverage of a given area (needles to say).
WHAT LEO SATELLITES BRING TO THE GROUND.
Anything is infinitely more than nothing. The Low Earth Orbit satellite brings the possibility of internet connectivity where there previously was nothing, either because too few potential customers spread out over a large area made terrestrial-based services hugely uneconomical or the environment is too hostile to build normal terrestrial networks within reasonable economics.
Figure 3 illustrates a low Earth satellite constellation providing internet to rural and remote areas as a way to solve part of the digital divide challenge in terms of availability. Obviously, the affordability is likely to remain a challenge unless subsidized by customers who can afford satellite services in other places where availability is more of a convenience question. (Courtesy: DALL-E)
The LEO satellites represent a transformative shift in internet connectivity, providing advantages over traditional cellular and fixed broadband networks, particularly for global access, speed, and deployment capabilities. As described in “Stratospheric Drones: Revolutionizing Terrestrial Rural Broadband from the Skies?”, LEO satellite constellations, or networks, may also be significantly more economical than equivalent cellular networks in rural and remote areas where the economics of coverage by satellite, as depicted in the above Figure 3, is by far better than by traditional terrestrial cellular means.
One of the foremost benefits of LEO satellites is their ability to offer global coverage as well as reasonable broadband and latency performance that is difficult to match with GEO and MEO satellites. The GEO stationary satellite obviously also offers global broadband coverage, the unit coverage being much more extensive than for a LEO satellite, but it is not possible to offer very low latency services, and it is more difficult to provide high data rates (in comparison to a LEO satellite). LEO satellites can reach the most remote and rural areas of the world, places where laying cables or setting up cell towers is impractical. This is a crucial step in delivering communications services where none exist today, ensuring that underserved populations and regions gain access to internet connectivity.
Another significant advantage is the reduction in latency that LEO satellites provide. Since they orbit much closer to Earth, typically at an altitude between 350 to 700 km, compared to their geostationary counterparts that are at 36 thousand kilometers altitude, the time it takes for a communications signal to travel between the user and the satellite is significantly reduced. This lower latency is crucial for enhancing the user experience in real-time applications such as video calls and online gaming, making these activities more enjoyable and responsive.
An inherent benefit of satellite constellations is their ability for quick deployment. They can be deployed rapidly in space, offering a quicker solution to achieving widespread internet coverage than the time-consuming and often challenging process of laying cables or erecting terrestrial infrastructure. Moreover, the network can easily be expanded by adding more satellites, allowing it to dynamically meet changing demand without extensive modifications on the ground.
LEO satellite networks are inherently scalable. By launching additional satellites, they can accommodate growing internet usage demands, ensuring that the network remains efficient and capable of serving more users over time without significant changes to ground infrastructure.
Furthermore, these satellite networks offer resilience and reliability. With multiple satellites in orbit, the network can maintain connectivity even if one satellite fails or is obstructed, providing a level of redundancy that makes the network less susceptible to outages. This ensures consistent performance across different geographical areas, unlike terrestrial networks that may suffer from physical damage or maintenance issues.
Another critical advantage is (relative) cost-effectiveness compared to a terrestrial-based cellular network. In remote or hard-to-reach areas, deploying satellites can be more economical than the high expenses associated with extending terrestrial broadband infrastructure. As satellite production and launch costs continue to decrease, the economics of LEO satellite internet become increasingly competitive, potentially reducing the cost for end-users.
LEO satellites offer a promising solution to some of the limitations of traditional connectivity methods. By overcoming geographical, infrastructural, and economic barriers, LEO satellite technology has the potential to not just complement but effectively substitute terrestrial-based cellular and fixed broadband services, especially in areas where such services are inadequate or non-existent.
Figure 4 below provides an overview of LEO satellite coverage with fixed broadband services offered to customers in the Ku band with a Ka backhaul link to ground station GWs that connect to, for example, the internet. Having inter-satellite communications (e.g., via laser links such as those used by Starlink satellites as per satellite version 1.5) allows for substantially less ground-station gateways. Inter-satellite laser links between intra-plane satellites are a distinct advantage in ensuring coverage for rural and remote areas where it might be difficult, very costly, and impractical to have a satellite ground station GW to connect to due to the lack of global internet infrastructure.
Figure 4 In general, a satellite is required to have LoS to its ground station gateway (GW); in other words, the GW needs to be within the coverage footprint of the satellite. For LEO satellites, which are at low altitudes, between 300 and 2000 km, and thus have a much lower footprint than MEO and GEO satellites, this would result in a need for a substantial amount of ground stations. This is depicted in (a) above. With inter-satellite laser links (SLL), e.g., those implemented by Starlink, it is possible to reduce the ground station gateways significantly, which is particularly helpful in rural and very remote areas. These laser links enable direct communication between satellites in orbit, which enhances the network’s performance, reliability, and global reach.
Inter-satellite laser links (ISLLs), or, as it is also called Optical Inter-satellite Links (OISK), are an advanced communication technology utilized by satellite constellations, such as for example Starlink, to facilitate high-speed secure data transmission directly between satellites. Inter-satellite laser links are today (primarily) designed for intra-plane communication within satellite constellations, enabling data transfer between satellites that share the same orbital plane. This is due to the relatively stable geometries and predictable distances between satellites in the same orbit, which facilitate maintaining the line-of-sight connections necessary for laser communications. ISLLs mark a significant departure from traditional reliance on ground stations for inter-satellite communication, and as such the ISL offers many benefits, including the ability to transmit data at speeds comparable to fiber-optic cables. Additionally, ISLLs enable satellite constellations to deliver seamless coverage across the entire planet, including over oceans and polar regions where ground station infrastructure is limited or non-existent. The technology also inherently enhances the security of data transmissions, thanks to the focused nature of laser beams, which are difficult to intercept.
However, the deployment of ISLLs is not without challenges. The technology requires a clear line of sight between satellites, which can be affected by their orbital positions, necessitating precise control mechanisms. Moreover, the theoretical limit to the number of satellites linked in a daisy chain is influenced by several factors, including the satellite’s power capabilities, the network architecture, and the need to maintain clear lines of sight. High-power laser systems also demand considerable energy, impacting the satellite’s power budget and requiring efficient management to balance operational needs. The complexity and cost of developing such sophisticated laser communication systems, combined with very precise pointing mechanisms and sensitive detectors, can be quite challenging and need to be carefully weighted against building satellite ground stations.
Cross-plane ISLL transmission, or the ability to communicate between satellites in different orbital planes, presents additional technical challenges, as it is technically highly challenging to maintain a stable line of sight between satellites moving in different orbital planes. However, the potential for ISLLs to support cross-plane links is recognized as a valuable capability for creating a fully interconnected satellite constellation. The development and incorporation of cross-plane ISLL capabilities into satellites are an area of active research and development. Such capabilities would reduce the reliance on ground stations and significantly increase the resilience of satellite constellations. I see the development as a next-generation topic together with many other important developments as described in the end of this blog. However, the power consumption of the ISLL is a point of concern that needs careful attention as it will impact many other aspects of the satellite operation.
THE DIGITAL DIVIDE.
The digital divide refers to the “internet haves and haves not” or “the gap between individuals who have access to modern information and communication technology (ICT),” such as the internet, computers, and smartphones, and those who do not have access. This divide can be due to various factors, including economic, geographic, age, and educational barriers. Essentially, as illustrated in Figure 5, it’s the difference between the “digitally connected” and the “digitally disconnected.”.
The significance of the digital divide is considerable, impacting billions of people worldwide. It is estimated that a little less than 40% of the world’s population, or roughly 2.9 billion people, had never used the internet (as of 2023). This gap is most pronounced in developing countries, rural areas, and among older populations and economically disadvantaged groups.
The digital divide affects individuals’ ability to access information, education, and job opportunities and impacts their ability to participate in digital economies and the modern social life that the rest of us (i.e., the other side of the divide or the privileged 60%) have become used to. Bridging this divide is crucial for ensuring equitable access to technology and its benefits, fostering social and economic inclusion, and supporting global development goals.
Figure 5 illustrates the digital divide, that is, the gap between individuals with access to modern information and communication technology (ICT), such as the internet, computers, and smartphones, and those who do not have access. (Courtesy: DALL-E)
CHALLENGES WITH LEO SATELLITE SOLUTIONS.
Low-Earth-orbit satellites offer compelling advantages for global internet connectivity, yet they are not without challenges and disadvantages when considered substitutes for cellular and fixed broadband services. These drawbacks underscore the complexities and limitations of deploying LEO satellite technology globally.
The capital investment required and the ongoing costs associated with designing, manufacturing, launching, and maintaining a constellation of LEO satellites are substantial. Despite technological advancements and increased competition driving costs down, the financial barrier to entry remains high. Compared to their geostationary counterparts, the relatively short lifespan of LEO satellites necessitates frequent replacements, further adding to operational expenses.
While LEO satellites offer significantly reduced latency (round trip times, RTT ~ 4 ms) compared to geostationary satellites (RTT ~ 240 ms), they may still face latency and bandwidth limitations, especially as the number of users on the satellite network increases. This can lead to reduced service quality during peak usage times, highlighting the potential for congestion and bandwidth constraints. This is also the reason why the main business model of LEO satellite constellations is primarily to address coverage and needs in rural and remote locations. Alternatively, the LEO satellite business model focuses on low-bandwidth needs such as texting, voice messaging, and low-bandwidth Internet of Things (IoT) services.
Navigating the regulatory and spectrum management landscape presents another challenge for LEO satellite operators. Securing spectrum rights and preventing signal interference requires coordination across multiple jurisdictions, which can complicate deployment efforts and increase the complexity of operations.
The environmental and space traffic concerns associated with deploying large numbers of satellites are significant. The potential for space debris and the sustainability of low Earth orbits are critical issues, with collisions posing risks to other satellites and space missions. Additionally, the environmental impact of frequent rocket launches raises further concerns.
FIXED-WIRELESS ACCESS (FWA) BASED LEO SATELLITE SOLUTIONS.
Using the NewSpace Index database, updated December 2023, there are currently more than 6,463 internet satellites launched, of which 5,650 (~87%) from StarLink, and 40,000+ satellites planned for launch, with SpaceX’s Starlink satellites having 11,908 planned (~30%). More than 45% of the satellites launched and planned support multi-application use cases. Thus internet, together with, for example, IoT (~4%) and/or Direct-2-Device (D2D, ~39%). The D2D share is due to StarLink’s plans to provide services to mobile terminals with their latest satellite constellation. The first six StarLink v2 satellites with direct-to-cellular capability were successfully launched on January 2nd, 2024. Some care should be taken in the share of D2D satellites in the StarLink number as it does not consider the different form factors of the version 2 satellite that do not all include D2D capabilities.
Most LEO satellites, helped by StarLink satellite quantum, operational and planned, support satellite fixed broadband internet services. It is worth noting that the Chinese Guo Wang constellation ranks second in terms of planned LEO satellites, with almost 13,000 planned, rivaling the StarLink constellation. After StarLink and Guo Wang are counted there is only 34% or ca. 16,000 internet satellites left in the planning pool across 30+ satellite companies. While StarLink is privately owned (by Elon Musk), the Guo Wang (國網 ~ “The state network”) constellation is led by China SatNet and created by the SASAC (China’s State-Owned Assets Supervision and Administration Commission). SASAC oversees China’s biggest state-owned enterprises. I expect that such an LEO satellite constellation, which would be the second biggest LEO constellation, as planned by Guo Wang and controlled by the Chinese State, would be of considerable concern to the West due to the possibility of dual-use (i.e., civil & military) of such a constellation.
StarLink coverage as of March 2024 (see StarLink’s availability map) does not provide services in Russia, China, Iran, Iraq, Afghanistan, Venezuela, and Cuba (20% of Earth’s total land base surface area). There are still quite a few countries in Africa and South-East Asia, including India, where regulatory approval remains pending.
Figure 6 NewSpace Index data of commercial satellite constellations in terms of total number of launched and planned (top) per company (or constellation name) and (bottom) per country.
While the term FWA, fixed wireless access, is not traditionally used to describe satellite internet services, the broadband services offered by LEO satellites can be considered a form of “wireless access” since they also provide connectivity without cables or fiber. In essence, LEO satellite broadband is a complementary service to traditional FWA, extending wireless broadband access to locations beyond the reach of terrestrial networks. In the following, I will continue to use the term FWA for the fixed broadband LEO satellite services provided to individual customers, including SMEs. As some of the LEO satellite businesses eventually also might provide direct-to-device (D2D) services to normal terrestrial mobile devices, either on their own acquired cellular spectrum or in partnership with terrestrial cellular operators, the LEO satellite operation (or business architecture) becomes much closer to terrestrial cellular operations.
Figure 7 Illustrating a Non-Terrestrial Network consisting of a Low Earth Orbit (LEO) satellite constellation providing fixed broadband services, such as Fixed Wireless Access, to individual terrestrial users (e.g., Starlink, Kuiper, OneWeb,…). Each hexagon represents a satellite beam inside the larger satellite coverage area. Note that, in general, there will be some coverage overlap between individual satellites, ensuring a continuous service. The operating altitude of an LEO satellite constellation is between 300 and 2,000 km, with most aiming to be at 450 to 550 km altitude. It is assumed that the satellites are interconnected, e.g., laser links. The User Terminal antenna (UT) is dynamically orienting itself after the best line-of-sight (in terms of signal quality) to a satellite within UT’s field-of-view (FoV). The FoV has not been shown in the picture above so as not to overcomplicate the illustration.
Low Earth Orbit (LEO) satellite services like Starlink have emerged to provide fixed broadband internet to individual consumers and small to medium-sized enterprises (SMEs) targeting rural and remote areas often where no other broadband solutions are available or with poor legacy copper- or coax-based infrastructure. These services deploy constellations of satellites orbiting close to Earth to offer high-speed internet with the significant advantage of reaching rural and remote areas where traditional ground-based infrastructure is absent or economically unfeasible.
One of the most significant benefits of LEO satellite broadband is the ability to deliver connectivity with lower latency compared to traditional satellite internet delivered by geosynchronous satellites, enhancing the user experience for real-time applications. The rapid deployment capability of these services also means that areas in dire need of internet access can be connected much quicker than waiting for ground infrastructure development. Additionally, satellite broadband’s reliability is less affected by terrestrial challenges, such as natural disasters that can disrupt other forms of connectivity.
The satellite service comes with its challenges. The cost of user equipment, such as satellite dishes, can be a barrier for some users. So, can the installation process be of the terrestrial satellite dish required to establish the connection to the satellite. Moreover, services might be limited by data caps or experience slower speeds after reaching certain usage thresholds, which can be a drawback for users with high data demands. Weather conditions can also impact the signal quality, particularly at the higher frequencies used by the satellite, albeit to a lesser extent than geostationary satellite services. However, the target areas where the fixed broadband satellite service is most suited are rural and remote areas that either have no terrestrial broadband infrastructure (terrestrial cellular broadband or wired broadband such as coax or fiber)
Beyond Starlink, other providers are venturing into the LEO satellite broadband market. OneWeb is actively developing a constellation to offer internet services worldwide, focusing on communities that are currently underserved by broadband. Telesat Lightspeed is also gearing up to provide broadband services, emphasizing the delivery of high-quality internet to the enterprise and government sectors.
Other LEO satellite businesses, such as AST SpaceMobile and Lynk Mobile, are taking a unique approach by aiming to connect standard mobile phones directly to their satellite network, extending cellular coverage beyond the reach of traditional cell towers. More about that in the section below (see “New Kids on the Block – Direct-to-Devices LEO satellites”).
I have been asked why I appear somewhat dismissive of the Amazon’s Project Kuiper in a previous version of article particular compared to StarLink (I guess). The expressed mission is to “provide broadband services to unserved and underserved consumers, businesses in the United States, …” (FCC 20-102). Project Kuiper plans for a broadband constellation of 3,226 microsatellites at 3 altitudes (i.e., orbital shells) around 600 km providing fixed broadband services in the Ka-band (i.e.,~ 17-30 GHz). In its US-based FCC (Federal Communications Commission) filling and in the subsequent FCC authorization it is clear that the Kuiper constellation primarily targets contiguous coverage of the USA (but mentions that services cannot be provided in the majority of Alaska, … funny I thought that was a good definition of a underserved remote and scarcely populated area?). Amazon has committed to launch 50% (1,618 satellites) of their committed satellites constellation before July 2026 (until now 2+ has been launched) and the remaining 50% before July 2029. There is however far less details on the Kuiper satellite design, than for example is available for the various versions of the StarLink satellites. Given the Kuiper will operate in the Ka-band there may be more frequency bandwidth allocated per beam than possible in the StarLink satellites using the Ku-band for customer device connectivity. However, Ka-band is at a higher frequency which may result in a more compromised signal propagation. In my opinion based on the information from the FCC submissions and correspondence, the Kuiper constellation appear less ambitious compared to StarLink vision, mission and tangible commitment in terms of aggressive launches, very high level of innovation and iterative development on their platform and capabilities in general. This may of course change over time and as more information becomes available on the Amazon’s Project Kuiper.
FWA-based LEO satellite solutions – takeaway:
LoS-based and free-space-like signal propagation allows high-frequency signals (i.e., high throughput, capacity, and quality) to provide near-ideal performance only impacted by the distance between the antenna and the ground terminal. Something that is, in general, not possible for a terrestrial-based cellular infrastructure.
Provides satellite fixed broadband internet connectivity typically using the Ku-band in geographically isolated locations where terrestrial broadband infrastructure is limited or non-existent.
Lower latency (and round trip time) compared to MEO and GEO satellite internet solutions.
Current systems are designed to provide broadband internet services in scarcely populated areas and underserved (or unserved) regions where traditional terrestrial-based communications infrastructures are highly uneconomical and/or impractical to deploy.
As shown in my previous article (i.e., “Stratospheric Drones: Revolutionizing Terrestrial Rural Broadband from the Skies?”), LEO satellite networks may be an economical interesting alternative to terrestrial rural cellular networks in countries with large scarcely populated rural areas requiring tens of thousands of cellular sites to cover. Hybrid models with LEO satellite FWA-like coverage to individuals in rural areas and with satellite backhaul to major settlements and towns should be considered in large geographies.
Resilience to terrestrial disruptions is a key advantage. It ensures functionality even when ground-based infrastructure is disrupted, which is an essential element for maintaining the Business Continuity of an operator’s telecommunications services. Particular hierarchical architectures with for example GEO-satellite, LEO satellite and Earth-based transport infrastructure will result in very high reliability network operations (possibly approaching ultra-high availability, although not with service parity).
Current systems are inherently capacity-limited due to their vast coverage areas (i.e., lower performance per unit coverage area). In the peak demand period, they will typically perform worse than terrestrial-based cellular networks (e.g., LTE or 5G).
In regions where modern terrestrial cellular and fixed broadband services are already established, satellite broadband may face challenges competing with these potentially cheaper, faster, and more reliable services, which are underpinned by the terrestrial communications infrastructure.
It is susceptible to weather conditions, such as heavy rain or snow, which can degrade signal quality. This may impact system capacity and quality, resulting in inconsistent customer experience throughout the year.
Must navigate complex regulatory environments in each country, which can affect service availability and lead to delays in service rollout.
Depending on the altitude, LEO satellites are typically replaced on a 5—to 7-year cycle due to atmospheric drag (which increases as altitude decreases; thus, the lower the altitude, the shorter a satellite’s life). This ultimately means that any improvements in system capacity and quality will take time to be thoroughly enjoyed by all customers.
SATELLITE BACKHAUL SOLUTIONS.
Figure 8 illustrates the architecture of a Low Earth Orbit (LEO) satellite backhaul system used by providers like OneWeb as well as StarLink with their so-called “Community Gateway”. It showcases the connectivity between terrestrial internet infrastructure (i.e., Satellite Gateways) and satellites in orbit, enabling high-speed data transmission. The network consists of LEO satellites that communicate with each other (inter-satellite Comms) using the Ku and Ka frequency bands. These satellites connect to ground-based satellite gateways (GW), which interface with Points of Presence (PoP) and Internet Exchange Points (IXP), integrating the space-based network with the terrestrial internet (WWW). Note: The indicated speeds and frequency bands (e.g., Ku: 12–18 GHz, Ka: 28–40 GHz) and data speeds illustrate the network’s capabilities.
LEO satellites providing backhaul connectivity, such as shown in Figure 8 above, are extending internet services to the farthest reaches of the globe. These satellites offer many benefits, as already discussed above, in connecting remote, rural, and previously un- and under-served areas with reliable internet services. Many remote regions lack foundational telecom infrastructure, particularly long-haul transport networks needed for carrying traffic away from remote populated areas. Satellite backhauls do not only offer a substantially better financial solution for enhancing internet connectivity to remote areas but are often the only viable solution for connectivity.
Take, for example, Greenland. The world’s largest non-continental island, the size of Western Europe, is characterized by its sparse population and distinct unconnected by road settlement patterns mainly along the West Coast (as well as a couple of settlements on the East Coast), influenced mainly by its vast ice sheets and rugged terrain. With a population of around 56+ thousand, primarily concentrated on the west coast, Greenland’s demographic distribution is spread out over ca. 50+ settlements and about 20 towns. Nuuk, the capital, is the island’s most populous city, housing over 18+ thousand residents and serving as the administrative, economic, and cultural hub. Terrestrial cellular networks serve settlements’ and towns’ communication and internet services needs, with the traffic carried back to the central switching centers by long-haul microwave links, sea cables, and satellite broadband connectivity. Several settlements connectivity needs can only be served by satellite backhaul, e.g., settlements on the East Coast (e.g., Tasiilaq with ca. 2,000 inhabitants and Ittoqqotooormiit (an awesome name!) with around 400+ inhabitants). LEO satellite backhaul solutions serving Satellite-only communities, such as those operated and offered by OneWeb (Eutelsat), could provide a backhaul transport solution that would match FWA latency specifications due to better (round trip time) performance than that of a GEO satellite backhaul solution.
It should also be clear that remote satellite-only settlements and towns may have communications service needs and demand that a localized 4G (or 5G) terrestrial cellular network with a satellite backhaul can serve much better than, for example, relying on individual ad-hoc connectivity solution from for example Starlink. When the area’s total bandwidth demand exceeds the capacity of an FWA satellite service, a localized terrestrial network solution with a satellite backhaul is, in general, better.
The LEO satellites should offer significantly reduced latency compared to their geostationary counterparts due to their closer proximity to the Earth. This reduction in delay is essential for a wide range of real-time applications and services, from adhering to modern radio access (e.g., 4G and 5G) requirements, VoIP, and online gaming to critical financial transactions, enhancing the user experience and broadening the scope of possible services and business.
Among the leading LEO satellite constellations providing backhaul solutions today are SpaceX’s Starlink (via their community gateway), aiming to deliver high-speed internet globally with a preference of direct to consumer connectivity; OneWeb, focusing on internet services for businesses and communities in remote areas; Telesat’s Lightspeed, designed to offer secure and reliable connectivity; and Amazon’s Project Kuiper, which plans to deploy thousands of satellites to provide broadband to unserved and underserved communities worldwide.
Satellite backhaul solutions – takeaway:
Satellite-backhaul solutions are excellent, cost-effective solution for providing an existing isolated cellular (and fixed access) network with high-bandwidth connectivity to the Internet (such as in remote and deep rural areas).
LEO satellites can reduce the need for extensive and very costly ground-based infrastructure by serving as a backhaul solution. For some areas, such as Greenland, the Sahara, or the Brazilian rainforest, it may not be practical or economical to connect by terrestrial-based transmission (e.g., long-haul microwave links or backbone & backhaul fiber) to remote settlements or towns.
An LEO-based backhaul solution supports applications and radio access technologies requiring a very low round trip time scale (RTT<50 ms) than is possible with a GEO-based satellite backhaul. However, the optimum RTT will depend on where the LEO satellite ground gateway connects to the internet service provider and how low the RTT can be.
The collaborative nature of a satellite-backhaul solution allows the terrestrial operator to focus on and have full control of all its customers’ network experiences, as well as optimize the traffic within its own network infrastructure.
LEO satellite backhaul solutions can significantly boost network resilience and availability, providing a secure and reliable connectivity solution.
Satellite-backhaul solutions require local ground-based satellite transmission capabilities (e.g., a satellite ground station).
The operator should consider that at a certain threshold of low population density, direct-to-consumer satellite services like Starlink might be more economical than constructing a local telecom network that relies on satellite backhaul (see above section on “Fixed Wireless Access (FWA) based LEO satellite solutions”).
Satellite backhaul providers require regulatory permits to offer backhaul services. These permits are necessary for several reasons, including the use of radio frequency spectrum, operation of satellite ground stations, and provision of telecommunications services within various jurisdictions.
The Satellite life-time in orbit is between 5 to 7 years depending on the LEO altitude. A MEO satellite (2 to 36 thousand km altitude) last between 10 to 20 years (GEO). This also dictates the modernization and upgrade cycle as well as timing of your ROI investment case and refinancing needs.
NEW KIDS ON THE BLOCK – DIRECT-TO-DEVICE LEO SATELLITES.
Elon Musk:“SpaceX just achieved peak download speed of 17 Mb/s from a satellite direct to unmodified Samsung Android Phone.” (note: the speed correspond to a spectral efficiency of ~3.4 Mbps/MHz/beam).
Reply from user:“That’s incredible … Fixed wireless networks need to be looking over their shoulders?”
Elon Musk:“No, because this is the current peak speed per beam and the beams are large, so this system is only effective where there is no existing cellular service. This services works in partnership with wireless providers, like what @SpaceX and @TMobile announced.”
Figure 9 illustrating a LEO satellite direct-to-device communication in a remote areas without any terrestrially-based communications infrastructure. Satellite being the only means of communications either by a normal mobile device or by classical satphone. (Courtesy: DALL-E).
Low Earth Orbit (LEO) Satellite Direct-to-Device technology enables direct communication between satellites in orbit and standard mobile devices, such as smartphones and tablets, without requiring additional specialized hardware. This technology promises to extend connectivity to remote, rural, and underserved areas globally, where traditional cellular network infrastructure is absent or economically unfeasible to deploy. The system can offer lower latency communication by leveraging LEO satellites, which orbit closer to Earth than geostationary satellites, making it more practical for everyday use. The round trip time (RTT), the time it takes the for the signal to travel from the satellite to the mobile device and back, is ca. 4 milliseconds for a LEO satellite at 550 km compared to ca. 240 milliseconds for a geosynchronous satellite (at 36 thousand kilometers altitude).
The key advantage of a satellite in low Earth orbit is that the likelihood of a line-of-sight to a point on the ground is very high compared to establishing a line-of-sight for terrestrial cellular coverage that, in general, would be very low. In other words, the cellular signal propagation from a LEO satellite closely approximates that of free space. Thus, all the various environmental signal loss factors we must consider for a standard terrestrial-based mobile network do not apply to our satellite. In other, more simplistic words, the signal propagation directly from the satellite to the mobile device is less compromised than it typically would be from a terrestrial cellular tower to the same mobile device. The difference between free-space propagation, which considers only distance and frequency, and the terrestrial signal propagation models, which quantifies all the gains and losses experienced by a terrestrial cellular signal, is very substantial and in favor of free-space propagation. As our Earth-bound cellular intuition of signal propagation often gets in the way of understanding the signal propagation from a satellite (or antenna in the sky in general), I recommend writing down the math using the formula of free space propagation loss and comparing this with terrestrial cellular link budget models, such as for example the COST 231-Hata Model (relatively simple) or the more recent 3GPP TR 38.901 Model (complex). In rural and sub-urban areas, depending on the environment, in-door coverage may be marginally worse, fairly similar, or even better than from terrestrial cell tower at a distance. This applies to both the uplink and downlink communications channel between the mobile device and the LEO satellite, and is also the reason why higher frequency (with higher frequency bandwidths available) use on LEO satellites can work better than in a terrestrial cellular network.
However, despite its potential to dramatically expand coverage, after all that is what satellites do, LEO Satellite Direct-to-Device technology is not a replacement for terrestrial cellular services and terrestrial communications infrastructures for several reasons: (a) Although the spectral efficiency can be excellent, the frequency bandwidth (in MHz) and data speeds (in Mbps) available through satellite connections are typically lower than those provided by ground-based cellular networks, limiting its use for high-bandwidth applications. (b) The satellite-based D2D services are, in general, capacity-limited and might not be able to handle higher user density typical for urban areas as efficiently as terrestrial networks, which are designed to accommodate large numbers of users through dense deployment of cell towers. (c) Environmental factors like buildings or bad weather can more significantly impact satellite communications’ reliability and quality than terrestrial services. (d) A satellite D2D service requires regulatory approval (per country), as the D2D frequency typically will be limited to terrestrial cellular services and will have to be coordinated and managed with any terrestrial use to avoid service degradation (or disruption) for customers using terrestrial cellular services also using the frequency. The satellites will have to be able to switch off their D2D service when the satellite covers jurisdictions that have not provided approval or where the relevant frequency/frequencies are in use terrestrially.
Using the NewSpace Index database, updated December 2023, there are current more than 8,000 Direct-to Device (D2D), or Direct-2-Cell (D2C), satellites planned for launch, with SpaceX’s Starlink v2 having 7,500 planned. The rest, 795 satellites, are distributed on 6 other satellite operators (e.g. AST Mobile, Sateliot (Spain), Inmarsat (HEO-orbit), Lynk,…). If we look at satellites designed for IoT connectivity we get in total 5,302, with 4,739 (not including StarLink) still planned, distributed out over 50+ satellite operators. The average IoT satellite constellation including what is currently planned is ~95 satellites with the majority targeted for LEO. The the satellite operators included in the 50+ count have confirmed funding with a minimum amount of US$2 billion (half of the operators have only funding confirmed without an amount). About 2,937 (435 launched) satellites are being planned to only serve IoT markets (note: I think this seems a bit excessive). With Swarm Technologies, a SpaceX subsidiary rank number 1 in terms of both launched and planned satellites. Swarm Technologies having launched at least 189 CubeSats (e.g., both 0.25U and 1U types) and have planned an addition 150. The second ranked IoT-only operator is Orbcomm with 51 satellites launched and an additional 52 planned. The average launched of the remaining IoT specific satellites operators are 5 with on average planning to launch 55 (over 42 constellations).
There are also 3 satellite operators (i.e., Chinese-based Galaxy Space: 1,000 LEO-sats; US-based Mangata Networks: 791 MEO/HEO-sats, and US-based Omnispace: 200 LEO?-sats) that have planned a total of 2,000 satellites to support 5G applications with their satellite solutions and one operator (i.e., Hanwha Systems) has planned 2,000 LEO satellites for 6G.
The emergence of LEO satellite direct-to-device (D2D) services, as depicted in the Figure 10 below, is at the forefront of satellite communication innovations, offering a direct line of connectivity between devices that bypasses the need for traditional cellular-based ground-based network infrastructure (e.g., cell towers). This approach benefits from the relatively short distance of hundreds of kilometers between LEO satellites and the Earth, reducing communication latency and broadening bandwidth capabilities compared to their geostationary counterparts. One of the key advantages of LEO D2D services is their ability to provide global coverage with an extensive number of satellites, i.e., in their 100s to 1000s depending the targeted quality of service, to support the services, ensuring that even the most remote and underserved areas have access to reliable communication channels. They are also critical in disaster resilience, maintaining communications when terrestrial networks fail due to emergencies or natural disasters.
Figure 10 This schematic presents the network architecture for satellite-based direct-to-device (D2D) communication facilitated by Low Earth Orbit (LEO) satellites, exemplified by collaborations like Starlink and T-Mobile US, Lynk Mobile, and AST Space Mobile. It illustrates how satellites in LEO enable direct connectivity between user equipment (UE), such as standard mobile devices and IoT (Internet of Things) devices, using terrestrial cellular frequencies and VHF/UHF bands. The system also shows inter-satellite links operating in the Ka-band for seamless network integration, with satellite gateways (GW) linking the space-based network to ground infrastructure, including Points of Presence (PoP) and Internet Exchange Points (IXP), which connect to the wider internet (WWW). This architecture supports innovative services like Omnispace and Astrocast, offering LEO satellite IoT connectivity. The network could be particularly crucial for defense and special operations in remote and challenging environments, such as the deserts or the Arctic regions of Greenland, where terrestrial networks are unavailable. As an example shown here, using regular terrestrial cellular frequencies in both downlink (~300 MHz to 7 GHz) and uplinks (900 MHz or lower to 2.1 GHz) ensures robust and versatile communication capabilities in diverse operational contexts.
While the majority of the 5,000+ Starlink constellation is 13 GHz (Ku-band), at the beginning of 2024, SpaceX launched a few 2nd generation Starlink satellites that support direct connections from the satellite to a normal cellular device (e.g., smartphone), using 5 MHz of T-Mobile USA’s PCS band (1900 MHz). The targeted consumer service, as expressed by T-Mobile USA, provides texting capabilities across the USA for areas with no or poor existing cellular coverage. This is fairly similar to services at similar cellular coverage areas presently offered by, for example, AST SpaceMobile, OmniSpace, and Lynk Global LEO satellite services with reported maximum downlink speed approaching 20 Mbps. The so-called Direct-2-Device, where the device is a normal smartphone without satellite connectivity functionality, is expected to develop rapidly over the next 10 years and continue to increase the supported user speeds (i.e., utilized terrestrial cellular spectrum) and system capacity in terms of smaller coverage areas and higher number of satellite beams.
Table 1 below provides an overview of the top 13 LEO satellite constellations targeting (fixed) internet services (e.g., Ku band), IoT and M2M services, and Direct-to-Device (or Direct-to-Cell, D2C) services. The data has been compiled from the NewSpace Index website, which should be with data as of 31st of December 2023. The Top-satellite constellation rank has been based on the number of launched satellites until the end of 2023. Two additional Direct-2-Cell (D2C or Direct-to-Device, D2D) LEO satellite constellations are planned for 2024-2025. One is SpaceX Starlink 2nd generation, which launched at the beginning of 2024, using T-Mobile USA’s PCS Band to connect (D2D) to normal terrestrial cellular handsets. The other D2D (D2C) service is Inmarsat’s Orchestra satellite constellation based on L-band (for mobile terrestrial services) and Ka for fixed broadband services. One new constellation (Mangata Networks, see also the NewSpace constellation information) targeting 5G services. With two 5G constellations already launched, i.e., Galaxy Space (Yinhe) launched 8 LEO satellites, 1,000 planned using Q- and V-bands (i.e., not a D2D cellular 5G service), and OmniSpace launched two satellites and appear to have planned a total of 200 satellites. Moreover, currently, there is one planned constellation targeting 6G by the South Korean Hanwha Group (a bit premature, but interesting to follow nevertheless) with 2,000 6G (LEO) satellites planned.
Most currently launched and planned satellite constellations offering (or plan to provide) Direct-2-Cell services, including IoT and M2M, are designed for low-frequency bandwidth services that are unlikely to compete with terrestrial cellular networks’ quality of service where reasonable good coverage (or better) exists.
Table 1 An overview of the Top-14 LEO satellite constellations targeting (fixed) internet services (e.g., Ku band), IoT and M2M services, and Direct-to-Device (or direct-to-cell) services. The data has been compiled from the NewSpace Index website, which should be with data as of 31st of December 2023.
The deployment of LEO D2D services also navigates a complicated regulatory landscape, with the need for harmonized spectrum allocation across different regions. Managing interference with terrestrial cellular networks and other satellite operations is another interesting challenge albeit complex aspect, requiring sophisticated solutions to ensure signal integrity. Moreover, despite the cost-effectiveness of LEO satellites in terms of launch and operation, establishing a full-fledged network for D2D services demands substantial initial investment, covering satellite development, launch, and the setup of supporting ground infrastructure.
LEO satellites with D2D-based capabilities – takeaway:
Provides lower-bandwidth services (e.g., GPRS/EDGE/HSDPA-like) where no existing terrestrial cellular service is present.
(Re-)use on Satellite of the terrestrial cellular spectrum.
D2D-based satellite services may become crucial in business continuity scenarios, providing redundancy and increased service availability to existing terrestrial cellular networks. This is particularly essential as a remedy for emergency response personnel in case terrestrial networks are not functional. Limited capacity (due to little assigned frequency bandwidth) over a large coverage area serving rural and remote areas with little or no cellular infrastructure.
Securing regulatory approval for satellite services over independent jurisdictions is a complex and critical task for any operator looking to provide global or regional satellite-based communications. The satellite operator may have to switch off transmission over jurisdictions where no permission has been granted.
If the spectrum is also deployed on the ground, satellite use of it must be managed and coordinated (due to interference) with the terrestrial cellular networks.
Require lowly or non-utilized cellular spectrum in the terrestrial operator’s spectrum portfolio.
D2D-based communications require a more complex and sophisticated satellite design, including the satellite antenna resulting in higher manufacturing and launch cost.
The IoT-only commercial satellite constellation “space” is crowded with a total of 44 constellations (note: a few operators have several constellations). I assume that many of those plans will eventually not be realized. Note that SpaceX Swarm Technology is leading and in terms of total numbers (available in the NewSpace Index) database will remain a leader from the shear amount of satellites once their plan has been realized. I expect we will see a Chinese constellation in this space as well unless the capability will be built into the Guo Wang constellation.
The Satellite life-time in orbit is between 5 to 7 years depending on the altitude. This timeline also dictates the modernization and upgrade cycle as well as timing of your ROI investment and refinancing needs.
Today’s D2D satellite systems are frequency-bandwidth limited. However, if so designed, satellites could provide a frequency asymmetric satellite-to-device connection. For instance, the downlink from the satellite to the device could utilize a high frequency (not used in the targeted rural or remote area) and a larger bandwidth, while the uplink communication between the terrestrial device and the LEO satellite could use a sufficiently lower frequency and smaller frequency bandwidth.
MAKERS OF SATELLITES.
In the rapidly evolving space industry, a diverse array of companies specializes in manufacturing satellites for Low Earth Orbit (LEO), ranging from small CubeSats to larger satellites for constellations similar to those used by OneWeb (UK) and Starlink (USA). Among these, smaller companies like NanoAvionics (Lithuania) and Tyvak Nano-Satellite Systems (USA) have carved out niches by focusing on modular and cost-efficient small satellite platforms typically below 25 kg. NanoAvionics is renowned for its flexible mission support, offering everything from design to operation services for CubeSats (e.g., 1U, 3U, 6U) and larger small satellites (100+ kg). Similarly, Tyvak excels in providing custom-made solutions for nano-satellites and CubeSats, catering to specific mission needs with a comprehensive suite of services, including design, manufacturing, and testing.
UK-based Surrey Satellite Technology Limited (SSTL) stands out for its innovative approach to small, cost-effective satellites for various applications, with cost-effectiveness in achieving the desired system’s performance, reliability, and mission objectives at a lower cost than traditional satellite projects that easily runs into USD 100s of million. SSTL’s commitment to delivering satellites that balance performance and budget has made it a popular satellite manufacturer globally.
On the larger end of the spectrum, companies like SpaceX (USA) and Thales Alenia Space (France-Italy) are making significant strides in satellite manufacturing at scale. SpaceX has ventured beyond its foundational launch services to produce thousands of small satellites (250+ kg) for its Starlink broadband constellation, which comprises 5,700+ LEO satellites, showcasing mass satellite production. Thales Alenia Space offers reliable satellite platforms and payload integration services for LEO constellation projects.
With their extensive expertise in aerospace and defense, Lockheed Martin Space (USA) and Northrop Grumman (USA) produce various satellite systems suitable for commercial, military, and scientific missions. Their ability to support large-scale satellite constellation projects from design to launch demonstrates high expertise and reliability. Similarly, aerospace giants Airbus Defense and Space (EU) and Boeing Defense, Space & Security (USA) offer comprehensive satellite solutions, including designing and manufacturing small satellites for LEO. Their involvement in high-profile projects highlights their capacity to deliver advanced satellite systems for a wide range of use cases.
Together, these companies, from smaller specialized firms to global aerospace leaders, play crucial roles in the satellite manufacturing industry. They enable a wide array of LEO missions, catering to the burgeoning demand for satellite services across telecommunications, Earth observation, and beyond, thus facilitating access to space for diverse clients and applications.
ECONOMICS.
Before going into details, let’s spend some time on an example illustrating the basic components required for building a satellite and getting it to launch. Here, I point at a super cool alternative to the above-mentioned companies, the USA-based startup Apex, co-founded by CTO Max Benassi (ex-SpaceX and Astra) and CEO Ian Cinnamon. To get an impression of the macro-components of a satellite system, I recommend checking out the Apex webpage and “playing” with their satellite configurator. The basic package comes at a price tag of USD 3.2 million and a 9-month delivery window. It includes a 100 kg satellite bus platform, a power system, a communication system based on X-band (8 – 12 GHz), and a guidance, navigation, and control package. The basic package does not include a solar array drive assembly (SADA), which plays a critical role in the operation of satellites by ensuring that the satellite’s solar panels are optimally oriented toward the Sun. Adding the SADA brings with it an additional USD 500 thousand. Also, the propulsion mechanism (e.g., chemical or electric; in general, there are more possibilities) is not provided (+ USD 450 thousand), nor are any services included (e.g., payload & launch vehicle integration and testing, USD 575 thousand), including SADAs, propulsion, and services, Apex will have a satellite launch ready for an amount of close to USD 4.8 million.
However, we are not done. The above solution still needs to include the so-called payload, which relates to the equipment or instruments required to perform the LEO satellite mission (e.g., broadband communications services), the actual satellite launch itself, and the operational aspects of a successful post-launch (i.e., ground infrastructure and operation center(s)).
Let’s take SpaceX’s Starlink satellite as an example illustrating mission and payload more clearly. The Starlink satellite’s primary mission is to provide fixed-wireless access broadband internet to an Earth-based fixed antenna using. The Starlink payload primarily consists of advanced broadband internet transmission equipment designed to provide high-speed internet access across the globe. This includes phased-array antennas for communication with user terminals on the ground, high-frequency radio transceivers to facilitate data transmission, and inter-satellite links allowing satellites to communicate in orbit, enhancing network coverage and data throughput.
The economical aspects of launching a Low Earth Orbit (LEO) satellite project span a broad spectrum of costs from the initial concept phase to deployment and operational management. These projects commence with research and development, where significant investments are made in design, engineering, and the iterative process of prototyping and testing to ensure the satellite meets its intended performance and reliability standards in harsh space conditions (e.g., vacuum, extreme temperature variations, radiation, solar flares, high-velocity impacts with micrometeoroids and man-made space debris, erosion, …).
Manufacturing the satellite involves additional expenses, including procuring high-quality components that can withstand space conditions and assembling and integrating the satellite bus with its mission-specific payload. Ensuring the highest quality standards throughout this process is crucial to minimizing the risk of in-orbit failure, which can substantially increase project costs. The payload should be seen as the heart of the satellite’s mission. It could be a set of scientific instruments for measuring atmospheric data, optical sensors for imaging, transponders for communication, or any other equipment designed to fulfill the satellite’s specific objectives. The payload will vary greatly depending on the mission, whether for Earth observation, scientific research, navigation, or telecommunications.
Of course, there are many other types and more affordable options for LEO satellites than a Starlink-like one (although we should also not ignore achievements of SpaceX and learn from them as much as possible). As seen from Table 1, we have a range of substantially smaller satellite types or form factors. The 1U (i.e., one unit) CubeSat is a satellite with a form factor of 10x10x11.35 cm3 and weighs no more than 1.33 kilograms. A rough cost range for manufacturing a 1U CubeSat could be from USD 50 to 100+ thousand depending on mission complexity and payload components (e.g., commercial-off-the-shelf or application or mission-specific design). The range includes considering the costs associated with the satellite’s design, components, assembly, testing, and initial integration efforts. The cost range, however, does not include other significant costs associated with satellite missions, such as launch services, ground station operations, mission control, and insurance, which is likely to (significantly) increase the total project cost. Furthermore, we have additional form factors, such as 3U CubeSat (10x10x34.05 cm3, <4 kg), manufacturing cost in the range of USD 100 to 500+ thousand, 6U CubeSat (20x10x34 cm3, <12 kg), that can carry more complex payload solutions than the smaller 1U and 3U, with the manufacturing cost in the range of USD 200 thousand to USD 1+ million and 12U satellites (20x20x34 cm3, <24 kg) that again support complex payload solutions and in general will be significantly more expensive to manufacture.
Securing a launch vehicle is one of the most significant expenditures in a satellite project. This cost not only includes the price of the rocket and launch itself but also encompasses integration, pre-launch services, and satellite transportation to the launch site. Beyond the launch, establishing and maintaining the ground segment infrastructure, such as ground stations and a mission control center, is essential for successful satellite communication and operation. These facilities enable ongoing tracking, telemetry, and command operations, as well as the processing and management of the data collected by the satellite.
The SpaceX Falcon rocket is used extensively by other satellite businesses (see above Table 1) as well as by SpaceX for their own Starlink constellation network. The rocket has a payload capability of ca. 23 thousand kg and a volume handling capacity of approximately 300 cubic meters. SpaceX has launched around 60 Starlink satellites per Falcon 9 mission for the first-generation satellites. The launch cost per 1st generation satellite would then be around USD 1 million per satellite using the previously quoted USD 62 million (2018 figure) for a Falcon 9 launch. The second-generation Starlink satellites are substantially more advanced compared to the 1st generation. They are also heavier, weighing around a thousand kilograms. A Falcon 9 would only be able to launch around 20 generation 2 satellites (only considering the weight limitation), while a Falcon Heavy could lift ca. 60 2nd gen. satellites but also at a higher price point of USD 90 million (2018 figure). Thus the launch cost per satellite would be between USD 1.5 million using Falcon Heavy and USD 3.1 million using Falcon 9. Although the launch cost is based on price figures from 2018, the expected efficiency gained from re-use may have either kept the cost level or reduced it further as expected, particularly with Falcon Heavy.
Satellite businesses looking to launch small volumes of satellites, such as CubeSats, have a variety of strategies at their disposal to manage launch costs effectively. One widely adopted approach is participating in rideshare missions, where the expenses of a single launch vehicle are shared among multiple payloads, substantially reducing the cost for each operator. This method is particularly attractive due to its cost efficiency and the regularity of missions offered by, for example, SpaceX. Prices for rideshare missions can start from as low as a few thousand dollars for very small payloads (like CubeSats) to several hundred thousand dollars for larger small satellites. For example, SpaceX advertises rideshare prices starting at $1 million for payloads up to 200 kg. Alternatively, dedicated small launcher services cater specifically to the needs of small satellite operators, offering more tailored launch options in terms of timing and desired orbit. Companies such as Rocket Lab (USA) and Astra (USA) launch services have emerged, providing flexibility that rideshare missions might not, although at a slightly higher cost. However, these costs remain significantly lower than arranging a dedicated launch on a larger vehicle. For example, Rocket Lab’s Electron rocket, specializing in launching small satellites, offers dedicated launches with prices starting around USD 7 million for the entire launch vehicle carrying up to 300 kg. Astra has reported prices in the range of USD 2.5 million for a dedicated LEO launch with their (discontinued) Rocket 3 with payloads of up to 150 kg. The cost for individual small satellites will depend on their share of the payload mass and the specific mission requirements.
Satellite ground stations, which consist of arrays of phased-array antennas, are critical for managing the satellite constellation, routing internet traffic, and providing users with access to the satellite network. These stations are strategically located to maximize coverage and minimize latency, ensuring that at least one ground station is within the line of sight of satellites as they orbit the Earth. As of mid-2023, Starlink operated around 150 ground stations worldwide (also called Starlink Gateways), with 64 live and an additional 33 planned in the USA. The cost of constructing a ground station would be between USD 300 thousand to half a million not including the physical access point, also called the point-of-presence (PoP), and transport infrastructure connecting the PoP (and gateway) to the internet exchange where we find the internet service providers (ISPs) and the content delivery networks (CDNs). The Pop may add another USD 100 to 200 thousand to the ground infrastructure unit cost. The transport cost from the gateway to the Internet exchange can vary a lot depending on the gateway’s location.
Insurance is a critical component of the financial planning for a satellite project, covering risks associated with both the launch phase and the satellite’s operational period in orbit. These insurances are, in general, running at between 5% to 20% of the total project cost depending on the satellite value, the track record of the launch vehicle, mission complexity, and duration (i.e., typically 5 – 7 years for a LEO satellite at 500 km) and so forth. Insurance could be broken up into launch insurance and insurance covering the satellite once it is in orbit.
Operational costs, the Opex, include the day-to-day expenses of running the satellite, from staffing and technical support to ground station usage fees.
Regulatory and licensing fees, including frequency allocation and orbital slot registration, ensure the satellite operates without interfering with other space assets. Finally, at the end of the satellite’s operational life, costs associated with safely deorbiting the satellite are incurred to comply with space debris mitigation guidelines and ensure a responsible conclusion to the mission.
The total cost of an LEO satellite project can vary widely, influenced by the satellite’s complexity, mission goals, and lifespan. Effective project management and strategic decision-making are crucial to navigating these expenses, optimizing the project’s budget, and achieving mission success.
Figure 11 illustrates an LEO CubeSat orbiting above the Earth, capturing the satellite’s compact design and its role in modern space exploration and technology demonstration. Note that the CubeSat design comes in several standardized dimensions, with the reference design, also called 1U, being almost 1 thousandth of a cubic meter and weighing less than 1.33 kg. More advanced CubeSat satellites would typically be 6U or higher.
CubeSats (e.g., 1U, 3U, 6U, 12U):
Manufacturing Cost: Ranges from USD 50,000 for a simple 1U CubeSat to over USD 1 million for a more complex missions supported by 6U (or higher) CubeSat with advanced payloads (and 12U may again amount to several million US dollars).
Launch Cost: This can vary significantly depending on the launch provider and the rideshare opportunities, ranging from a few thousand dollars for a 1U CubeSat on a rideshare mission to several million dollars for a dedicated launch of larger CubeSats or small satellites.
Operational Costs: Ground station services, mission control, and data handling can add tens to hundreds of thousands of dollars annually, depending on the mission’s complexity and duration.
Small Satellites (25 kg up to 500 kg):
Manufacturing Cost: Ranges from USD 500,000 to over 10 million, depending on the satellite’s size, complexity, and payload requirements.
Launch Cost: While rideshare missions can reduce costs, dedicated launches for small satellites can range from USD 10 million to 62 million (e.g., Falcon 9) and beyond (e.g., USD 90 million for Falcon Heavy).
Operational Costs: These are similar to CubeSats, but potentially higher due to the satellite’s larger size and more complex mission requirements, reaching several hundred thousand to over a million dollars annually.
The range for the total project cost of a LEO satellite:
Given these considerations, the total cost range for a LEO satellite project can vary from as low as a few hundred thousand dollars for a simple CubeSat project utilizing rideshare opportunities and minimal operational requirements to hundreds of millions of dollars for more complex small satellite missions requiring dedicated launches and extensive operational support.
It is important to note that these are rough estimates, and the actual cost can vary based on specific mission requirements, technological advancements, and market conditions.
CAPACITY AND QUALITY
Figure 12 Satellite-based cellular capacity, or quality measured, by the unit or total throughput in Mbps is approximately driven by the amount of spectrum (in MHz) times the effective spectral efficiency (in Mbps/MHz/units) times the number of satellite beams resulting in cells on the ground.
The overall capacity and quality of satellite communication systems, given in Mbps, is on a high level, the product of three key factors: (i) the amount of frequency bandwidth in MHz allocated to the satellite operations multiplied by (ii) the effective spectral efficiency in Mbps per MHz over a unit satellite-beam coverage area multiplied by (iii) the number of satellite beams that provide the resulting terrestrial cell coverage. Thus, in other words:
Satellite Capacity (in Mbps)= Frequency Bandwidth in MHz × Effective Spectral Efficiency in Mbps/MHz/Beam × Number of Beams (or Cells)
Consider a satellite system supporting 8 beams (and thus an equivalent of terrestrial coverage cells), each with 250 MHz allocated within the same spectral frequency range, can efficiently support ca. 680 Mbps per beam. This is achieved with an antenna setup that effectively provides a spectral efficiency of ~2.7 Mbps/MHz/cell (or beam) in the downlink (i.e., from the satellite to the ground). Moreover, the satellite typically will have another frequency and antenna configuration that establishes a robust connection to the ground station that connects to the internet via, for example, third-party internet service providers. The 680 Mbps is then shared among users that are within the satellite beam coverage, e.g., if you have 100 customers demanding a service, the speed each would experience on average would be around 7 Mbps. This may not seem very impressive compared to the cellular speeds we are used to getting with an LTE or 5G terrestrial cellular service. However, such speeds are, of course, much better than having no means of connecting to the internet.
Higher frequencies (i.e., in the GHz range) used to provide terrestrial cellular broadband services are in general quiet sensitive to the terrestrial environment and non-LoS propagation. It is a basic principle of physics that signal propagation characteristics, including the range and penetration capabilities of an electromagnetic waves, is inversely related to their frequency. Vegetation and terrain becomes an increasingly critical factor to consider in higher frequency propagation and the resulting quality of coverage. For example trees, forests, and other dense foliage can absorb and scatter radio waves, attenuating signals. The type and density of vegetation, along with seasonal changes like foliage density in summer versus winter, can significantly impact signal strength. Terrains often include varied topographies such as housing, hills, valleys, and flat plains, each affecting signal reach differently. For instance, housing, hilly or mountainous areas may cause signal shadowing and reflection, while flat terrains might offer less obstruction, enabling signals to travel further. Cellular mobile operators tend to like high frequencies (GHz) for cellular broadband services as it is possible to get substantially more system throughput in bits per second available to deliver to our demanding customers than at frequencies in the MHz range. As can be observed in Figure 12 above, we see that the frequency bandwidth is a multiplier for the satellite capacity and quality. Cellular mobile operators tend to “dislike” higher frequencies because of their poorer propagation conditions in their terrestrially based cellular networks resulting in the need for increased site densification at a significant incremental capital expense.
The key advantage of a LEO satellite is that the likelihood of a line-of-sight to a point on the ground is very high compared to establishing a line-of-sight for terrestrial cellular coverage that, in general, would be very low. In other words, the cellular signal propagation from an satellite closely approximates that of free space. Thus, all the various environmental signal loss factors we must consider for a standard terrestrial-based mobile network do not apply to our satellite having only to overcome the distance from the satellite antenna to the ground.
Let us first look at the satellite frequency component of the above satellite capacity, and quality, formula:
FREQUENCY SPECTRUM FOR SATELLITES.
The satellite frequency spectrum encompasses a range of electromagnetic frequencies allocated specifically for satellite communication. These frequencies are divided into bands, commonly known as L-band (e.g., mobile broadband), S-band (e.g., mobile broadband), C-band, X-band (e.g., mainly used by military), Ku-band (e.g., fixed broadband), Ka-band (e.g., fixed broadband), and V-band. Each serves different satellite applications due to its distinct propagation characteristics and capabilities. The spectrum bandwidth used by satellites refers to the width of the frequency range that a satellite system is licensed to use for transmitting and receiving signals.
Careful management of satellite spectrum bandwidth is critical to prevent interference with terrestrial communications systems. Since both satellite and terrestrial systems can operate on similar frequency ranges, there is a potential for crossover interference, which can degrade the performance of both systems. This is particularly important for bands like C-band and Ku-band, which are also used for terrestrial cellular networks and other applications like broadcasting.
Using the same spectrum for both satellite and terrestrial cellular coverage within the same geographical area is challenging due to the risk of interference. Satellites transmit signals over vast areas, and if those signals are on the same frequency as terrestrial cellular systems, they can overpower the local ground-based signals, causing reception issues for users on the ground. Conversely, the uplink signals from terrestrial sources can interfere with the satellite’s ability to receive communications from its service area.
Regulatory bodies such as the International Telecommunication Union (ITU) are crucial in mitigating these interference issues. They coordinate the allocation of frequency bands and establish regulations that govern their use. This includes defining geographical zones where certain frequencies may be used exclusively for either terrestrial or satellite services, as well as setting limits on signal power levels to minimize the chance of interference. Additionally, technology solutions like advanced filtering, beam shaping, and polarization techniques are employed to further isolate satellite communications from terrestrial systems, ensuring that both may coexist and operate effectively without mutual disruption.
The International Telecommunication Union (ITU) has designated several frequency bands for Fixed Satellite Services (FSS) and Mobile Satellite Services (MSS) that can be used by satellites operating in Low Earth Orbit (LEO). The specific bands allocated for satellite services, FSS and MSS, are determined by the ITU’s Radio Regulations, which are periodically updated to reflect global telecommunication’s evolving needs and address emerging technologies. Here are some of the key frequency bands commonly considered for FSS and MSS with LEO satellites:
V-Band 40 GHz to 75 GHz (microwave frequency range). The V-band is appealing for Low Earth Orbit (LEO) satellite constellations designed to provide global broadband internet access. LEO satellites can benefit from the V-band’s capacity to support high data rates, which is essential for serving densely populated areas and delivering competitive internet speeds. The reduced path loss at lower altitudes, compared to GEO, also makes the V-band a viable option for LEO satellites. Due to the higher frequencies offered by V-band it also is significant more sensitive to atmospheric attenuation, (e.g., oxygen absorption around 60 GHz), including rain fade, which is likely to affect signal integrity. This necessitates the development of advanced technologies for adaptive coding and modulation, power amplification, and beamforming to ensure reliable communication under various weather conditions. Several LEO satellite operators have expressed an interest in operationalizing the V-band in their satellite constellations (e.g., StarLink, OneWeb, Kuiper, Lightspeed). This band should be regarded as an emergent LEO frequency band.
Ka-Band 17.7 GHz to 20.2 GHz (Downlink) & 27.5 GHz to 30.0 GHz (Uplink). The Ka-band offers higher bandwidths, enabling greater data throughput than lower bands. Not surprising this band is favored by high-throughput satellite solutions. It is widely used by fixed satellite services (FSS). This makes it ideal for high-speed internet services. However, it is more susceptible to absorption and scattering by atmospheric particles, including raindrops and snowflakes. This absorption and scattering effect weakens the signal strength when it reaches the receiver. To mitigate rain fade effects in the Ka-band, satellite, and ground equipment must be designed with higher link margins, incorporating more powerful transmitters and more sensitive receivers. Additionally, adaptive modulation and coding techniques can be employed to adjust the signal dynamically in response to changing weather conditions. Overall, the system is more costly and, therefore, primarily used for satellite-to-earth ground station communications and high-performance satellite backhaul solutions.
For example, Starlink and OneWeb use the Ka-band to connect to satellite Earth gateways and point-of-presence, which connect to Internet Exchange and the wider internet. It is worth noticing that the terrestrial 5 G band n256 (26.5 to 29.5 GHz) falls within the Ka-band’s uplink frequency band. Furthermore, SES’s mPower satellites, operating at Middle Earth Orbit (MEO), operate exclusively in this band, providing internet backhaul services.
Ku-Band 12.75 GHz to 13.25 GHz (Downlink) & 14.0 GHz to 14.5 GHz (Uplink). The Ku-band is widely used for FSS satellite communications, including fixed satellite services, due to its balance between bandwidth availability and susceptibility to rain fade. It is suitable for broadband services, TV broadcasting, and backhaul connections. For example, Starlink and OneWeb satellites are using this band to provide broadband services to earth-based customer terminals.
X-Band 7.25 GHz to 7.75 GHz (Downlink) & 7.9 GHz to 8.4 GHz (Uplink). The X-band in satellite applications is governed by international agreements and national regulations to prevent interference between different services and to ensure the efficient use of the spectrum. The X-band is extensively used for secure military satellite communications, offering advantages like high data rates and relative resilience to jamming and eavesdropping. It supports a wide range of military applications, including mobile command, control, communications, computer, intelligence, surveillance, and reconnaissance (i.e., C4ISR) operations. Most defense-oriented satellites operate at geostationary orbit, ensuring constant coverage of specific geographic areas (e.g., Airbus Skynet constellations, Spain’s XTAR-EUR, and France’s Syracuse satellites). Most European LEO defense satellites, used primarily for reconnaissance, are fairly old, with more than 15 years since the first launch, and are limited in numbers (i.e., <10). The most recent European LEO satellite system is the French-based Multinational Space-based Imaging System (MUSIS) and Composante Spatiale Optique (CSO), where the first CSO components were launched in 2018. There are few commercial satellites utilizing the X-band.
C-Band 3.7 GHz to 4.2 GHz (Downlink) & 5.925 GHz to 6.425 GHz (Uplink) C-band is less susceptible to rain fade and is traditionally used for satellite TV broadcasting, maritime, and aviation communications. However, parts of the C-band are also being repurposed for terrestrial 5G networks in some regions, leading to potential conflicts and the need for careful coordination. The C-band is primarily used in geostationary orbit (GEO) rather than Low Earth Orbit (LEO), due to the historical allocation of C-band for fixed satellite services (FSS) and its favorable propagation characteristics. I haven’t really come across any LEO constellation using the C-band. GEO FSS satellite operators using this band extensively are SES (Luxembourg), Intelsat (Luxembourg/USA), Eutelsat (France), Inmarsat (UK), etc..
S-Band2.0 GHz to 4.0 GHz S-band is used for various applications, including mobile communications, weather radar, and some types of broadband services. It offers a good compromise between bandwidth and resistance to atmospheric absorption. Both Omnispace (USA) and Globalstar (USA) LEO satellites operate in this band. Omnispace is also interesting as they have expressed intent to have LEO satellites supporting the 5G services in the band n256 (26.5 to 29.5 GHz), which falls within the uplink of the Ka-band.
L-Band1.0 GHz to 2.0 GHz L-band is less commonly used for fixed satellite services but is notable for its use in mobile satellite services (MSS), satellite phone communications, and GPS. It provides good coverage and penetration characteristics. Both Lynk Mobile (USA), offering Direct-2-Device, IoT, and M2M services, and Astrocast (Switzerland), with their IoT/M2M services, are examples of LEO satellite businesses operating in this band.
UHF300 MHz to 3.0 GHz The UHF band is more widely used for satellite communications, including mobile satellite services (MSS), satellite radio, and some types of broadband data services. It is favored for its relatively good propagation characteristics, including the ability to penetrate buildings and foliage. For example, Fossa Systems LEO pico-satellites (i.e., 1p form-factor) use this frequency for their IoT and M2M communications services.
VHF30 MHz to 300 MHz
The VHF band is less commonly used in satellite communications for commercial broadband services. Still, it is important for applications such as satellite telemetry, tracking, and control (TT&C) operations and amateur satellite communications. Its use is often limited due to the lower bandwidth available and the higher susceptibility to interference from terrestrial sources. Swarm Technologies (USA and a SpaceX subsidiary) using 137-138 MHz (Downlink) and 148-150 MHz (Uplink). However, it appears that they have stopped taking new devices on their network. Orbcomm (USA) is another example of a satellite service provider using the VHF band for IoT and M2M communications. There is very limited capacity in this band due to many other existing use cases, and LEO satellite companies appear to plan to upgrade to the UHF band or to piggyback on direct-2-cell (or direct-2-device) satellite solutions, enabling LEO satellite communications with 3GPP compatible IoT and M2M devices.
SATELLITE ANTENNAS.
Satellites operating in Geostationary Earth Orbit (GEO), Medium Earth Orbit (MEO), and Low Earth Orbit (LEO) utilize a variety of antenna types tailored to their specific missions, which range from communication and navigation to observation (e.g., signal intelligence). The satellite’s applications influence the selection of an antenna, the characteristics of its orbit, and the coverage area required.
Antenna technology is intrinsically linked to spectral efficiency in satellite communications systems and of course any other wireless systems. Antenna designs influence how effectively a communication system can transmit and receive signals within a given frequency band, which is the essence of spectral efficiency (i.e., how much information per unit time in bits per second can I squeeze through my communications channel).
Thus, advancements in antenna technology are fundamental to improving spectral efficiency, making it a key area of research and development in the quest for more capable and efficient communication systems.
Parabolic dish antennas are prevalent for GEO satellites due to their high gain and narrow beam width, making them ideal for broadcasting and fixed satellite services. These antennas focus a tight beam on specific areas on Earth, enabling strong and direct signals essential for television, internet, and communication services. Horn antennas, while simpler, are sometimes used as feeds for larger parabolic antennas or for telemetry, tracking, and command functions due to their reliability. Additionally, phased array antennas are becoming more common in GEO satellites for their ability to steer beams electronically, offering flexibility in coverage and the capability to handle multiple beams and frequencies simultaneously.
Phased-array antennas are indispensable in for MEO satellites, such as those used in navigation systems like GPS (USA), BeiDou (China), Galileo (European), or GLONASS (Russian). These satellite constellations cover large areas of the Earth’s surface and can adjust beam directions dynamically, a critical feature given the satellites’ movement relative to the Earth. Patch antennas are also widely used in MEO satellites, especially for mobile communication constellations, due to their compact and low-profile design, making them suitable for mobile voice and data communications.
Phased-array antennas are very important for LEO satellites use cases as well, which include broadband communication constellations like Starlink and OneWeb. Their (fast) beam-steering capabilities are essential for maintaining continuous communication with ground stations and user terminals as the satellites quickly traverse the sky. The phased-array antenna also allow for optimizing coverage with both narrow as well as wider field of view (from the perspective of the satellite antenna) that allow the satellite operator to trade-off cell capacity and cell coverage.
Simpler Dipole antennas are employed for more straightforward data relay and telemetry purposes in smaller satellites and CubeSats, where space and power constraints are significant factors. Reflect array antennas, which offer a mix of high gain and beam steering capabilities, are used in specific LEO satellites for communication and observation applications (e.g., for signal intelligence gathering), combining features of both parabolic and phased array antennas.
Mission specific requirements drive the choice of antenna for a satellite. For example, GEO satellites often use high-gain, narrowly focused antennas due to their fixed position relative to the Earth, while MEO and LEO satellites, which move relatively closer to the Earth’s surface, require antennas capable of maintaining stable connections with moving ground terminals or covering large geographical areas.
Advanced antenna technologies such as beamforming, phased-arrays, and Multiple In Multiple Out (MMO) antenna configurations are crucial in managing and utilizing the spectrum more efficiently. They enable precise targeting of radio waves, minimizing interference, and optimizing bandwidth usage. This direct control over the transmission path and signal shape allows more data (bits) to be sent and received within the same spectral space, effectively increasing the communication channel’s capacity. In particular, MIMO antenna configurations and advanced antenna beamforming have enabled terrestrial mobile cellular access technologies (e.g., LTE and 5G) to quantum leap the effective spectral efficiency, broadband speed and capacity orders of magnitude above and beyond older technologies of 2G and 3G. Similar principles are being deployed today in modern advanced communications satellite antennas, providing increased capacity and quality within the satellite cellular coverage area provided by the satellite beam.
Moreover, antenna technology developments like polarization and frequency reuse directly impact a satellite system’s ability to maximize spectral resources. Allowing simultaneous transmissions on the same frequency through different polarizations or spatial separations effectively double the capacity without needing additional spectrum.
WHERE DO WE END UP.
If all current commercial satellite plans were realized, within the next decade, we would have more, possibly substantially more than 65 thousand satellites circling Earth. Today, that number is less than 10 thousand, with more than half that number realized by StarLink’s LEO constellation. Imagine the increase in, and the amount of, space debris circling Earth within the next 10 years. This will likely pose a substantial increase in operational risk for new space missions and will have to be addressed urgently.
Over the next decade, we may have at least 2 major LEO satellite constellations. One from Starlink with an excess of 12 thousand satellites, and one from China, the Guo Wang, the state network, likewise with 12 thousand LEO satellites. One global satellite constellation is from an American-based commercial company; the other is a worldwide satellite constellation representing the Chinese state. It would not be too surprising to see that by 2034, the two satellite constellations will divide Earth in part, being serviced by a commercial satellite constellation (e.g., North America, Europe, parts of the Middle East, some of APAC including India, possibly some parts of Africa). Another part will likely be served by a Chinese-controlled LEO constellation providing satellite broadband service to China, Russia, significant parts of Africa, and parts of APAC.
Over the next decade, satellite services will undergo transformative advancements, reshaping the architecture of global communication infrastructures and significantly impacting various sectors, including broadband internet, global navigation, Earth observation, and beyond. As these services evolve, we should anticipate major leaps in satellite technologies, driven by innovation in propulsion systems, miniaturization of technology, advancements in onboard processing capabilities, increasing use of AI and machine learning leapfrogging satellites operational efficiency and performance, breakthrough in material science reducing weight and increasing packing density, leapfrogs in antenna technology, and last but not least much more efficient use of the radio frequency spectrum. Moreover, we will see the breakthrough innovation that will allow better co-existence and autonomous collaboration of frequency spectrum utilization between non-terrestrial and terrestrial networks reducing the need for much regulatory bureaucracy that might anyway be replaced by decentralized autonomous organizations (DAOs) and smart contracts. This development will be essential as satellite constellations are being integrated into 5G and 6G network architectures as the non-terrestrial network cellular access component. This particular topic, like many in this article, is worth a whole new article on its own.
I expect that over the next 10 years we will see electronically steerable phased-array antennas, as a notable advancement. These would offer increased agility and efficiency in beamforming and signal direction. Their ability to swiftly adjust beams for optimal coverage and connectivity without physical movement makes them perfect for the dynamic nature of Low Earth Orbit (LEO) satellite constellations. This technology will becomes increasingly cost-effective and energy-efficient, enabling widespread deployment across various satellite platforms (not only LEO designs). The advance in phased-array antenna technology will facilitate substantial increase in the satellite system capacity by increasing the number of beams, the variation on beam size (possibly down to a customer ground station level), and support multi-band operations within the same antenna.
Another promising development is the integration of metamaterials in antenna design, which will lead to more compact, flexible, and lightweight antennas. The science of metamaterials is super interesting and relates to manufacturing artificial materials to have properties not found in naturally occurring materials with unique electromagnetic behaviors arising from their internal structure. Metamaterial antennas is going to offer superior performance, including better signal control and reduced interference, which is crucial for maintaining high-quality broadband connections. These materials are also important for substantially reducing the weight of the satellite antenna, while boosting its performance. Thus, the technology will also support bringing the satellite launch cost down dramatically.
Although primarily associated MIMO antennas with terrestrial networks, I would also expect that massive MIMO technology will find applications in satellite broadband systems. Satellite systems, just like ground based cellular networks, can significantly increase their capacity and efficiency by utilizing many antenna elements to simultaneously communicate with multiple ground terminals. This could be particularly transformative for next-generation satellite networks, supporting higher data rates and accommodating more users. The technology will increase the capacity and quality of the satellite system dramatically as it has done on terrestrial cellular networks.
Furthermore, advancements in onboard processing capabilities will allow satellites to perform more complex signal processing tasks directly in space, reducing latency and improving the efficiency of data transmission. Coupled with AI and machine learning algorithms, future satellite antennas could dynamically optimize their operational parameters in real-time, adapting to changes in the network environment and user demand.
Additionally, research into quantum antenna technology may offer breakthroughs in satellite communication, providing unprecedented levels of sensitivity and bandwidth efficiency. Although still early, quantum antennas could revolutionize signal reception and transmission in satellite broadband systems. In the context of LEO satellite systems, I am particularly excited about utilizing the Rydberg Effect to enhance system sensitivity could lead to massive improvements. The heightened sensitivity of Rydberg atoms to electromagnetic fields could be harnessed to develop ultra-sensitive detectors for radio frequency (RF) signals. Such detectors could surpass the performance of traditional semiconductor-based devices in terms of sensitivity and selectivity, enabling satellite systems to detect weaker signals, improve signal-to-noise ratios, and even operate effectively over greater distances or with less power. Furthermore, space could potentially be the near-ideal environment for operationalizing Rydberg antenna and communications systems as space had near-perfect vacuum, very low-temperatures (in Earth shadow at least or with proper thermal management), relatively free of electromagnetic radiation (compared to Earth), as well as its micro-gravity environment that may facilitate long-range “communications” between Rydberg atoms. This particular topic may be further out in the future than “just” a decade from now, although it may also be with satellites we will see the first promising results of this technology.
One key area of development will be the integration of LEO satellite networks with terrestrial 5G and emerging 6G networks, marking a significant step in the evolution of Non-Terrestrial Network (NTN) architectures. This integration promises to deliver seamless, high-speed connectivity across the globe, including in remote and rural areas previously underserved by traditional broadband infrastructure. By complementing terrestrial networks, LEO satellites will help achieve ubiquitous wireless coverage, facilitating a wide range of applications and use cases from high-definition video streaming to real-time IoT data collection.
The convergence of LEO satellite services with 5G and 6G will also spur network management and orchestration innovation. Advanced techniques for managing interference, optimizing handovers between terrestrial and non-terrestrial networks, and efficiently allocating spectral resources will be crucial. It would be odd not to mention it here, so artificial intelligence and machine learning algorithms will, of course, support these efforts, enabling dynamic network adaptation to changing conditions and demands.
Moreover, the next decade will likely see significant improvements in the environmental sustainability of LEO satellite operations. Innovations in satellite design and materials, along with more efficient launch vehicles and end-of-life deorbiting strategies, will help mitigate the challenges of space debris and ensure the long-term viability of LEO satellite constellations.
In the realm of global connectivity, LEO satellites will have bridged the digital divide, offering affordable and accessible internet services to billions of people worldwide unconnected today. In 2023 the estimate is that there are about 3 billion people, almost 40% of all people in the world today, that have never used internet. In the next decade, it must be our ambition that with LEO satellite networks this number is brought down to very near Zero. This will have profound implications for education, healthcare, economic development, and global collaboration.
FURTHER READING.
A. Vanelli-Coralli, N. Chuberre, G. Masini, A. Guidotti, M. El Jaafari, “5G Non-Terrestrial Networks.”, Wiley (2024). A recommended reading for deep diving into NTN networks of satellites, typically the LEO kind, and High-Altitude Platform Systems (HAPS) such as stratospheric drones.
Gwynne Shotwell, TED Talk from May 2018. She quotes here a total of USD 10 billion as a target for the 12,000 satellite network. This is just an amazing visionary talk/discussion about what may happen by 2028 (in 4-5 years ;-).
Lynk Global website: https://lynk.world/ (see also FCC Order and Authorization). It should be noted that Lynk can operate within 617 to 960 MHz (Space-to-Earth) and 663 to 915 MHz (Earth-to-Space). However, only outside the USA. Constellation Area: IoT / M2M, Satellite-to-Cellphone, Internet, Direct-to-Cell. 8 LEO satellites out of 10 planned.
Omnispace website: https://omnispace.com/Constellation Area: IoT / M2M, 5G. Ambition to have the world’s first global 5G non-terrestrial network. Initial support 3GPP-defined Narrow-Band IoT radio interface. Planned 200 LEO and <15 MEO satellites. So far, only 2 satellites have been launched.
NewSpace Index: https://www.newspace.im/ I find this resource to have excellent and up-to-date information on commercial satellite constellations.
“From an economic and customer experience standpoint, deploying stratospheric drones may be significantly more cost effective than establishing extra terrestrial infrastructures”.
As a mobile cellular industry expert and a techno-economist, the first time I was presented with the concept of stratospheric drones, I feel the butterflies in my belly. That tingling feeling that I was seeing something that could be a huge disruptor of how mobile cellular networks are being designed and built. Imagine getting rid of the profitability-challenged rural cellular networks (i.e., the towers, the energy consumption, the capital infrastructure investments), and, at the same time, offering much better quality to customers in rural areas than is possible with the existing cellular network we have deployed there. A technology that could fundamentally change the industry’s mobile cellular cost structure for the better at a quantum leap in quality and, in general, provide economical broadband services to the unconnected at a fraction of the cost of our traditional ways of building terrestrial cellular coverage.
Back in 2015, I got involved with Deutsche Telekom AG Group Technology, under the leadership of Bruno Jacobfeuerborn, in working out the detailed operational plans, deployment strategies, and, of course, the business case as well as general economics of building a stratospheric cellular coverage platform from scratch with the UK-based Stratospheric Platform Ltd [2] in which Deutsche Telekom is an investor. The investment thesis was really in the way we expected the stratospheric high-altitude platform to make a large part of mobile operators’ terrestrial rural cellular networks obsolete and how it might strengthen mobile operator footprints in countries where rural and remote coverage was either very weak or non-existing (e.g., The USA, an important market for Deutsche Telekom AG).
At the time, our thoughts were to have an operational stratospheric coverage platform operationally by 2025, 10 years after kicking off the program, with more than 100 high-altitude platforms covering a major Western European country serving rural areas. As it so often is, reality is unforgiving, as it often is with genuinely disruptive ideas. Getting to a stage of deployment and operation at scale of a high-altitude platform is still some years out due to the lack of maturity of the flight platform, including regulatory approvals for operating a HAP network at scale, increasing the operating window of the flight platform, fueling, technology challenges with the advanced antenna system, being allowed to deployed terrestrial-based cellular spectrum above terra firma, etc. Many of these challenges are progressing well, although slowly.
Globally, various companies are actively working on developing stratospheric drones to enhance cellular coverage. These include aerospace and defense giants like Airbus, advancing its Zephyr drone, and BAE Systems, collaborating with Prismatic for their PHASA-35 UAV. One of the most exciting HAPS companies focusing on developing world-leading high-altitude aircraft that I have come across during my planning work on how to operationalize a Stratospheric cellular coverage platform is the German company Leichtwerk AG, which has their hydrogen-fueled StratoStreamer as well as a solar-powered platform under development with the their StratoStreamer being close to production-ready. Telecom companies like Deutsche Telekom AG and BT Group are experimenting with hydrogen-powered drones in partnership with Stratospheric Platforms Limited. Through its subsidiary HAPSMobile, SoftBank is also a significant player with its Sunglider project. Additionally, entities like China Aerospace Science and Technology Corporation and Cambridge Consultants contribute to this field by co-developing enabling technologies (e.g., advanced phased-array antenna, fuel technologies, material science, …) critical for the success and deployability of high-altitude platforms at scale, aiming to improve connectivity in rural, remote, and underserved areas.
The work on integrating High Altitude Platform (HAP) networks with terrestrial cellular systems involves significant coordination with international regulatory bodies like the International Telecommunication Union Radiocommunication Sector (ITU-R) and the World Radiocommunication Conference (WRC). This process is crucial for securing permission to reuse terrestrial cellular spectrum in the stratosphere. Key focus areas include negotiating the allocation and management of frequency bands for HAP systems, ensuring they don’t interfere with terrestrial networks. These efforts are vital for successfully deploying and operating HAP systems, enabling them to provide enhanced connectivity globally, especially in rural areas where terrestrial cellular frequencies are already in use and remote and underserved regions. At the latest WRC-2023 conference, Softbank successfully gained approval within the Asia-Pacific region to use mobile spectrum bands for stratospheric drone-based mobile broadband cellular services.
Most mobile operators have at least 50% of their cellular network infrastructure assets in rural areas. While necessary for providing the coverage that mobile customers have come to expect everywhere, these sites carry only a fraction of the total mobile traffic. Individually, rural sites have poor financial returns due to their proportional operational and capital expenses.
In general, the Opex of the cellular network takes up between 50% and 60% of the Technology Opex, and at least 50% of that can be attributed to maintaining and operating the rural part of the radio access network. Capex is more cyclical than Opex due to, for example, the modernization of radio access technology. Nevertheless, over a typical modernization cycle (5 to 7 years), the rural network demands a little bit less but a similar share of Capex overall as for Opex. Typically, the Opex share of the rural cellular network may be around 10% of the corporate Opex, and its associated total cost is between 12% and 15% of the total expenses.
The global telecom towers market size in 2023 is estimated at ca. 26+ billion euros, ca. 2.5% of total telecom turnover, with a projected growth of CAGR 3.3% from now to 2030. The top 10 Tower management companies manage close to 1 million towers worldwide for mobile CSPs. Although many mobile operators have chosen to spin off their passive site infrastructure, there are still some remaining that may yet to spin off their cellular infrastructure to one of many Tower management companies, captive or independent, such as American Tower (224,019+ towers), Cellnex Telecom (112,737+ towers), Vantage Towers (46,100+ towers), GD Towers (+41,600 towers), etc…
IMAGINE.
Focusing on the low- or no-profitable rural cellular coverage.
Imagine an alternative coverage technology to the normal cellular one all mobile operators are using that would allow them to do without the costly and low-profitable rural cellular network they have today to satisfy their customers’ expectations of high-quality ubiquitous cellular coverage.
For the alternative technology to be attractive, it would need to deliver at least the same quality and capacity as the existing terrestrial-based cellular coverage for substantially better economics.
If a mobile operator with a 40% EBITDA margin did not need its rural cellular network, it could improve its margin by a sustainable 5% and increase its cash generation in relative terms by 50% (i.e., from 0.2×Revenue to 0.3×Revenue), assuming a capex-to-revenue ratio of 20% before implementing the technology being reduced to 15% after due to avoiding modernization and capacity investments in the rural areas.
Imagine that the alternative technology would provide a better cellular quality to the consumer for a quantum leap reduction of the associated cost structure compared to today’s cellular networks.
Such an alternative coverage technology might also impact the global tower companies’ absolute level of sustainable tower revenues, with a substantial proportion of revenue related to rural site infrastructure being at risk.
Figure 1 An example of an unmanned autonomous stratospheric coverage platform. Source: Cambridge Consultants presentation (see reference [2]) based on their work with Stratospheric Platforms Ltd (SPL) and SPL’s innovative high-altitude coverage platform.
TERRESTRIAL CELLULAR RURAL COVERAGE – A MATTER OF POOR ECONOMICS.
When considering the quality we experience in a terrestrial cellular network, a comprehensive understanding of various environmental and physical factors is crucial to predicting the signal quality accurately. All these factors generally work against cellular signal propagation regarding how far the signal can reach from the transmitting cellular tower and the achievable quality (e.g., signal strength) that a customer can experience from a cellular service.
Firstly, the terrain plays a significant role. Rural landscapes often include varied topographies such as hills, valleys, and flat plains, each affecting signal reach differently. For instance, hilly or mountainous areas may cause signal shadowing and reflection, while flat terrains might offer less obstruction, enabling signals to travel further.
At higher frequencies (i.e., above 1 GHz), vegetation becomes an increasingly critical factor to consider. Trees, forests, and other dense foliage can absorb and scatter radio waves, attenuating signals. The type and density of vegetation, along with seasonal changes like foliage density in summer versus winter, can significantly impact signal strength.
The height and placement of transmitting and receiving antennas are also vital considerations. In rural areas, where there are fewer tall buildings, the height of the antenna can have a pronounced effect on the line of sight and, consequently, on the signal coverage and quality. Elevated antennas mitigate the impact of terrain and vegetation to some extent.
Furthermore, the lower density of buildings in rural areas means fewer reflections and less multipath interference than in urban environments. However, larger structures, such as farm buildings or industrial facilities, must be factored in, as they can obstruct or reflect signals.
Finally, the distance between the transmitter and receiver is fundamental to signal propagation. With typically fewer cell towers spread over larger distances, understanding how signal strength diminishes with distance is critical to ensuring reliable coverage at a high quality, such as high cellular throughput, as the mobile customer expects.
The typical way for a cellular operator to mitigate the environmental and physical factors that inevitably result in loss of signal strength and reduced cellular quality (i.e., sub-standard cellular speed) is to build more sites and thus incur increasing Capex and Opex in areas that in general will have poor economical payback associated with any cellular assets. Thus, such investments make an already poor economic situation even worse as the rural cellular network generally would have very low utilization.
Figure 2 Cellular capacity or quality measured by the unit or total throughput is approximately driven by the amount of spectrum (in MHz) times the effective spectral efficiency (in Mbps/MHz/units) times the number of cells or capacity units deployed. When considering the effective spectral efficiency, one needs to consider the possible “boost” that a higher order MiMo or Advanced Antenna System will bring over and above the Single In Single Out (SISO) antenna would result in.
As our alternative technology also would need to provide at least the same quality and capacity it is worth exploring what can be expected in terms of rural terrestrial capacity. In general, we have that the cellular capacity (and quality) can be written as (also shown in Figure 2 above):
Throughput (in Mbps)= Spectral Bandwidth in MHz × Effective Spectral Efficiency in Mbps/MHz/Cell × Number of Cells
We need to keep in mind that an additional important factor when considering quality and capacity is that the higher the operational frequency, the lower the radius (all else being equal). Typically, we can improve the radius at higher frequencies by utilizing advanced antenna beam forming, that is, concentrate the radiated power per unit coverage area, which is why you will often hear that the 3.6 GHz downlink coverage radius is similar to that of 1800 MHz (or PCS). This 3.6 GHz vs. 1.8 GHz coverage radius comparison is made when not all else is equal. Comparing a situation where the 1800 MHz (or PCS) radiated power is spread out over the whole coverage area compared to a coverage situation where the 3.6 GHz (or C-band in general) solution makes use of beamforming, where the transmitted energy density is high, allowing to reach the customer at a range that would not be possible if the 3.6 GHz radiated power would have been spread out over the cell like the example of the 1800 MHz.
As an example, take an average Western European rural 5G site with all cellular bands between 700 and 2100 MHz activated. The site will have a total of 85 MHz DL and 75 MHz UL, with a 10 MHz difference between DL and UL due to band 38 Supplementary Downlink SDL) operational on the site. In our example, we will be optimistic and assume that the effective spectral efficiency is 2 Mbps per MHz per cell (average over all bands and antenna configurations), which would indicate a fair amount of 4×4 and 8×8 MiMo antenna systems deployed. Thus, the unit throughput we would expect to be supplied by the terrestrial rural cell would be 170 Mbps (i.e., 85 MHz × 2.0 Mbps/MHz/Cell). With a rural cell coverage radius between 2 and 3 km, we then have an average throughput per square kilometer of 9 Mbps/km2. Due to the low demand and high-frequency bandwidth per active customer, DL speeds exceeding 100+ Mbps should be relatively easy to sustain with 5G standalone, with uplink speeds being more compromised due to larger coverage areas. Obviously, the rural quality can be improved further by deploying advanced antenna systems and increasing the share of higher-order MiMo antennas in general, as well as increasing the rural site density. However, as already pointed out, this would not be an economically reasonable approach.
THE ADVANTAGE OF SEEING FROM ABOVE.
Figure 3 illustrates the difference between terrestrial cellular coverage from a cell tower and that of a stratospheric drone or high-altitude platform (“Antenna-in-the-Sky”). The benefit of seeing the world from above is that environmental and physical factors have substantially less impact on signal propagation and quality primarily being impacted by distance as it approximates free space propagation. This situation is very different for a terrestrial-based cellular tower with its radiated signal being substantially impacted by the environment as well as physical factors.
It may sound silly to talk about an alternative coverage technology that could replace the need for the cellular tower infrastructure that today is critical for providing mobile broadband coverage to, for example, rural areas. What alternative coverage technologies should we consider?
If, instead of relying on terrestrial-based tower infrastructure, we could move the cellular antenna and possibly the radio node itself to the sky, we would have a situation where most points of the ground would be in the line of sight to the “antenna-in-the-sky.” The antenna in the sky idea is a game changer in terms of coverage itself compared to conventional terrestrial cellular coverage, where environmental and physical factors dramatically reduce signal propagation and signal quality.
The key advantage of an antenna in the sky (AIS) is that the likelihood of a line-of-sight to a point on the ground is very high compared to establishing a line-of-sight for terrestrial cellular coverage that, in general, would be very low. In other words, the cellular signal propagation from an AIS closely approximates that of free space. Thus, all the various environmental signal loss factors we must consider for a standard terrestrial-based mobile network do not apply to our antenna in the sky.
Over the last ten years, we have gotten several technology candidates for our antenna-in-the-sky solution, aiming to provide terrestrial broadband services as a substitute, or enhancement, for terrestrial mobile and fixed broadband services. In the following, I will describe two distinct types of antenna-in-the-sky solutions: (a) Low Earth Orbit (LEO) satellites, operating between 500 to 2000 km above Earth, that provide terrestrial broadband services such as we know from Starlink (SpaceX), OneWeb (Eutelsat Group), and Kuiper (Amazon), and (b) So-called, High Altitude Platforms (HAPS), operating at altitudes between 15 to 30 km (i.e., in the stratosphere). Such platforms are still in the research and trial stages but are very promising technologies to substitute or enhance rural network broadband services. The HAP is supposed to be unmanned, highly autonomous, and ultimately operational in the stratosphere for an extended period (weeks to months), fueled by green hydrogen and possibly solar. The high-altitude platform is thus also an unmanned aerial vehicle (UAV), although I will use the term stratospheric drone and HAP interchangeably in the following.
Low Earth Orbit (LEO) satellites and High Altitude Platforms (HAPs) represent two distinct approaches to providing high-altitude communication and observation services. LEO satellites, operating between 500 km and 2,000 km above the Earth, orbit the planet, offering broad global coverage. The LEO satellite platform is ideal for applications like satellite broadband internet, Earth observation, and global positioning systems. However, deploying and maintaining these satellites involves complex, costly space missions and sophisticated ground control. Although, as SpaceX has demonstrated with the Starlink LEO satellite fixed broadband platform, the unitary economics of their satellites significantly improve by scale when the launch cost is also considered (i.e., number of satellites).
Figure 4 illustrates a non-terrestrial network architecture consisting of a Low Earth Orbit (LEO) satellite constellation providing fixed broadband services to terrestrial users. Each hexagon represents a satellite beam inside the larger satellite coverage area. Note that, in general, there will be some coverage overlap between individual satellites, ensuring a continuous service including interconnected satellites. The user terminal (UT) dynamically aligns itself, aiming at the best quality connection provided by the satellites within the UT field of vision.
Figure 4 Illustrating a Non-Terrestrial Network consisting of a Low Earth Orbit (LEO) satellite constellation providing fixed broadband services to terrestrial users (e.g., Starlink, Kuiper, OneWeb,…). Each hexagon represents a satellite beam inside the larger satellite coverage area. Note that, in general, there will be some coverage overlap between individual satellites, ensuring a continuous service. The operating altitude of a LEO satellite constellation is between 300 and 2,000 km. It is assumed that the satellites are interconnected, e.g., laser links. The User Terminal antenna (UT) is dynamically orienting itself after the best line-of-sight (in terms of signal quality) to a satellite within UT’s field-of-view (FoV). The FoV has not been shown in the picture above so as not to overcomplicate the illustration. It should be noted just like with the drone it is possible to integrate the complete gNB on the LEO satellite. There might even be applications (e.g., defense, natural & unnatural disaster situations, …) where a standalone 5G SA core is integrated.
On the other hand, HAPs, such as unmanned (autonomous) stratospheric drones, operate at altitudes of approximately 15 km to 30 km in the stratosphere. Unlike LEO satellites, the stratospheric drone can hover or move slowly over specific areas, often geostationary relative to the Earth’s surface. This characteristic makes them more suitable for localized coverage tasks like regional broadband, surveillance, and environmental monitoring. The deployment and maintenance of the stratospheric drones are managed from the Earth’s surface and do not require space launch capabilities. Furthermore, enhancing and upgrading the HAPs is straightforward, as they will regularly be on the ground for fueling and maintenance. Upgrades are not possible with an operational LEO satellite solution where any upgrade would have to wait on a subsequent generation and new launch.
Figure 5 illustrates the high-level network architecture of an unmanned autonomous stratospheric drone-based constellation providing terrestrial cellular broadband services to terrestrial mobile users delivered to their normal 5G terminal equipment. Each hexagon represents a beam arising from the phased-array antenna integrated into the drone’s wingspan. To deliver very high-availability services to a rural area, one could assign three HAPs to cover a given area. The drone-based non-terrestrial network is drawn consistent with the architectural radio access network (RAN) elements from Open RAN, e.g., Radio Unit (RU), Distributed Unit (DU), and Central Unit (CU). It should be noted that the whole 5G gNB (the 5G NodeB), including the CU, could be integrated into the stratospheric drone, and in fact, so could the 5G standalone (SA) packet core, enabling full private mobile 5G networks for defense and disaster scenarios or providing coverage in very remote areas with little possibility of ground-based infrastructure (e.g., the arctic region, or desert and mountainous areas).
Figure 5 illustrates a Non-Terrestrial Network consisting of a stratospheric High Altitude Platform (HAP) drone-based constellation providing terrestrial Cellular broadband services to terrestrial mobile users delivered to their normal 5G terminal equipment. Each hexagon represents a beam inside the larger coverage area of the stratospheric drone. To deliver very high-availability services to a rural area, one could assign three HAPs to cover a given area. The operating altitude of a HAP constellation is between 10 to 50 km with an optimum of around 20 km. It is assumed that there is inter-HAP connectivity, e.g., via laser links. Of course, it is also possible to contemplate having the gNB (full 5G radio node) in the stratospheric drone entirely, which would allow easier integration with LEO satellite backhauls, for example. There might even be applications (e.g., defense, natural & unnatural disaster situations, …) where a standalone 5G SA core is integrated.
The unique advantage of the HAP operating in the stratosphere is (1) The altitude is advantageous for providing wider-area cellular coverage with a near-ideal quality above and beyond what is possible with conventional terrestrial-based cellular coverage because of very high line-of-sight likelihood due to less environment and physical issues that substantially reduces the signal propagation and quality of a terrestrial coverage solution, and (2) More stable atmospheric conditions characterize the stratosphere compared to the troposphere below it. This stability allows the stratospheric drone to maintain a consistent position and altitude with less energy expenditure. The stratosphere offers more consistent and direct sunlight exposure for a solar-powered HAP with less atmospheric attenuation. Moreover, due to the thinner atmosphere at stratospheric altitudes, the stratospheric drone will experience a lower air resistance (drag), increasing the energy efficiency and, therefore, increasing the operational airtime.
Figure 6 illustrates Leichtwerk AG’s StratoStreamer HAP design that is near-production ready. Leichtwerk AG works closely together with AESA towards the type certificate that would make it possible to operationalize a drone constellation in Europe. The StratoStreamer has a wingspan of 65 meter and can carry a payload of 100+ kg. Courtesy: Leichtwerk AG.
Each of these solutions has its unique advantages and limitations. LEO satellites provide extensive coverage but come with higher operational complexities and costs. HAPs offer more focused coverage and are easier to manage, but they need the global reach of LEO satellites. The choice between these two depends on the specific requirements of the intended application, including coverage area, budget, and infrastructure capabilities.
In an era where digital connectivity is indispensable, stratospheric drones could emerge as a game-changing technology. These unmanned (autonomous) drones, operating in the stratosphere, offer unique operational and economic advantages over terrestrial networks and are even seen as competitive alternatives to low earth orbit (LEO) satellite networks like Starlink or OneWeb.
STRATOSPHERIC DRONES VS TERRESTRIAL NETWORKS.
Stratospheric drones positioned much closer to the Earth’s surface than satellites, provide distinct signal strength and latency benefits. The HAP’s vantage point in the stratosphere (around 20 km above the Earth) ensures a high probability of line-of-sight with terrestrial user devices, mitigating the adverse effects of terrain obstacles that frequently challenge ground-based networks. This capability is particularly beneficial in rural areas in general and mountainous or densely forested areas, where conventional cellular towers struggle to provide consistent coverage.
Why the stratosphere? The stratosphere is the layer of Earth’s atmosphere located above the troposphere, which is the layer where weather occurs. The stratosphere is generally characterized by stable, dry conditions with very little water vapor and minimal horizontal winds. It is also home to the ozone layer, which absorbs and filters out most of the Sun’s harmful ultraviolet radiation. It is also above the altitude of commercial air traffic, which typically flies at altitudes ranging from approximately 9 to 12 kilometers (30,000 to 40,000 feet). These conditions (in addition to those mentioned above) make operating a stratospheric platform very advantageous.
Figure 6 illustrates the coverage fundamentals of (a) a terrestrial cellular radio network with the signal strength and quality degrading increasingly as one moves away from the antenna and (b) the terrestrial coverage from a stratospheric drone (antenna in the sky) flying at an altitude of 15 to 30 km. The stratospheric drone, also called a High-Altitude Platform (HAP), provides near-ideal signal strength and quality due to direct line-of-sight (LoS) with the ground, compared to the signal and quality from a terrestrial cellular site that is influenced by its environment and physical factors and the fact that LoS is much less likely in a conventional terrestrial cellular network. It is worth keeping in mind that the coverage scenarios where a stratospheric drone and a low earth satellite may excel in particular are in rural areas and outdoor coverage in more dense urban areas. In urban areas, the clutter, or environmental features and objects, will make line-of-site more challenging, impacting the strength and quality of the radio signals.
Figure 6 The chart above illustrates the coverage fundamentals of (a) a terrestrial cellular radio network with the signal strength and quality degrading increasingly as one moves away from the antenna and (b) the terrestrial coverage from a stratospheric drone (antenna in the sky) flying at an altitude of 15 to 30 km. The stratospheric drone, also called a High Altitude Platform (HAP), provides near-ideal signal strength and quality due to direct line-of-sight (LoS) with the ground, compared to the signal & quality from a terrestrial cellular site that is influenced by its environment and physical factors and the fact that LoS is much less likely in a conventional terrestrial cellular network.
From an economic and customer experience standpoint, deploying stratospheric drones may be significantly more cost-effective than establishing extensive terrestrial infrastructure, especially in remote or rural areas. The setup and operational costs of cellular towers, including land acquisition, construction, and maintenance, are substantially higher compared to the deployment of stratospheric drones. These aerial platforms, once airborne, can cover vast geographical areas, potentially rendering numerous terrestrial towers redundant. At an operating height of 20 km, one would expect a coverage radius ranging from 20 km up to 500 km, depending on the antenna system, application, and business model (e.g., terrestrial broadband services, surveillance, environmental monitoring, …).
The stratospheric drone-based coverage platform, and by platform, I mean the complete infrastructure that will replace the terrestrial cellular network, will consist of unmanned autonomous drones with a considerable wingspan (e.g., 747-like of ca. 69 meters). For example, European (German) Leichtwerk’s StratoStreamer has a wingspan of 65 meters and a wing area of 197 square meters with a payload of 120+ kg (note: in comparison a Boing 747 has ca. 500+ m2 wing area but its payload is obviously much much higher and in the range of 50 to 60 metric tons). Leichtwerk AG work closely together with AESA in order to achieve the European Union Aviation Safety Agency (EASA) type certificate that would allow the HAPS to integrate into civil airspace (see refs. [34] for what that means).
An advanced antenna system is positioned under the wings (or the belly) of the drone. I will assume that the coverage radius provided by a single drone is 50 km, but it can dynamically be made smaller or larger depending on the coverage scenario and use case. The drone-based advanced antenna system breaks up the coverage area (ca. six thousand five hundred plus square kilometers) into 400 patches (i.e., a number that can be increased substantially), averaging approx. 16 km2 per patch and a radius of ca. 2.5 km. Due to its near-ideal cellular link budget, the effective spectral efficiency is expected to be initially around 6 Mbps per MHz per cell. Additionally, the drone does not have the same spectrum limitations as a rural terrestrial site and would be able to support frequency bands in the downlink from ~900 MHz up to 3.9 GHz (and possibly higher, although likely with different antenna designs). Due to the HAP altitude, the Earth-to-HAP uplink signal will be limited to a lower frequency spectrum to ensure good signal quality is being received at the stratospheric antenna. It is prudent to assume a limit of 2.1 GHz to possibly 2.6 GHz. All under the assumption that the stratospheric drone operator has achieved regulatory approval for operating the terrestrial cellular spectrum from their coverage platform. It should be noted that today, cellular frequency spectrum approved for terrestrial use cannot be used at an altitude unless regulatory permission has been given (more on this later).
Let’s look at an example. We would need ca. 46 drones to cover the whole of Germany with the above-assumed specifications. Furthermore, if we take the average spectrum portfolio of the 3 main German operators, this will imply that the stratospheric drone could be functioning with up to 145 MHz in downlink and at least 55 MHz uplink (i.e., limiting UL to include 2.1 GHz). Using the HAP DL spectral efficiency and coverage area we get a throughput density of 70+ Mbps/km2 and an effective rural cell throughput of 870 Mbps. In terrestrial-based cellular coverage, the contribution to quality at higher frequencies is rapidly degrading as a function of the distance to the antenna. This is not the case for HAP-based coverage due to its near-ideal signal propagation.
In comparison, the three incumbent German operators have on average ca. 30±4k sites per operator with an average terrestrial coverage area of 12 km2 and a coverage radius of ca. 2.0 km (i.e., smaller in cities, ~1.3 km, larger in rural areas, ~2.7 km). Assume that the average cost of ownership related only to the passive part of the site is 20+ thousand euros and that 50% of the 30k sites (expect a higher number) would be redundant as the rural coverage would be replaced by stratospheric drones. Such a site reduction quantum conservatively would lead to a minimum gross monetary reduction of 300 million euros annually (not considering the cost of the alternative technology coverage solution).
In our example, the question is whether we can operate a stratospheric drone-based platform covering rural Germany for less than 300 million euros yearly. Let’s examine this question. Say the stratospheric drone price is 1 million euros per piece (similar to the current Starlink satellite price, excluding the launch cost, which would add another 1.1 million euros to the satellite cost). For redundancy and availability purposes, we assume we need 100 stratospheric drones to cover rural Germany, allowing me to decommission in the radius of 15 thousand rural terrestrial sites. The decommissioning cost and economical right timing of tower contract termination need to be considered. Due to the standard long-term contracts may be 5 (optimistic) to 10+ years (realistic) year before the rural network termination could be completed. Many Telecom businesses that have spun out their passive site infrastructure have done so in mutual captivity with the Tower management company and may have committed to very “sticky” contracts that have very little flexibility in terms of site termination at scale (e.g., 2% annually allowed over total portfolio).
We have a capital expense of 100 million for the stratospheric drones. We also have to establish the support infrastructure (e.g., ground stations, airfield suitability rework, development, …), and consider operational expenses. The ballpark figure for this cost would be around 100 million euros for Capex for establishing the supporting infrastructure and another 30 million euros in annual operational expenses. In terms of steady-state Capex, it should be at most 20 million per year. In our example, the terrestrial rural network would have cost 3 billion euros, mainly Opex, over ten years compared to 700 million euros, a little less than half as Opex, for the stratospheric drone-based platform (not considering inflation).
The economical requirements of a stratospheric unmanned and autonomous drone-based coverage platform should be superior compared to the current cellular terrestrial coverage platform. As the stratospheric coverage platform scales and increasingly more stratospheric drones are deployed, the unit price is also likely to reduce accordingly.
Spectrum usage rights yet another critical piece.
It should be emphasized that the deployment of cellular frequency spectrum in stratospheric and LEO satellite contexts is governed by a combination of technical feasibility, regulatory frameworks, coordination to prevent interference, and operational needs. The ITU, along with national regulatory bodies, plays a central role in deciding the operational possibilities and balancing the needs and concerns of various stakeholders, including satellite operators, terrestrial network providers, and other spectrum users. Today, there are many restrictions and direct regulatory prohibitions in repurposing terrestrially assigned cellular frequencies for non-terrestrial purposes.
The role of the World Radiocommunications Conference (WRC) role is pivotal in managing the global radio-frequency spectrum and satellite orbits. Its decisions directly impact the development and deployment of various radiocommunication services worldwide, ensuring their efficient operation and preventing interference across borders. The WRC’s work is fundamental to the smooth functioning of global communication networks, from television and radio broadcasting to cellular networks and satellite-based services. The WRC is typically held every three to four years, with the latest one, WRC-23, held in Dubai at the end of 2023, reference [13] provides the provisional final acts of WRC-23 (December 2023). In landmark recommendation, WRC-23 relaxed the terrestrial-only conditions for the 698 to 960 MHz and 1,71 to 2.17 GHz, and 2.5 to 2.69 GHz frequency bands to also apply for high-altitude platform stations (HAPS) base stations (“Antennas-in -Sky”). It should be noted that there are slightly different frequency band ranges and conditions, depending on which of the three ITU-R regions (as well as exceptions for particular countries within a region) the system will be deployed in. Also the HAPS systems do not enjoy protection or priority over existing use of those frequency bands terrestrially. It is important to note that the WRC-23 recommendation only apply to coverage platforms (i.e., HAPS) in the range from 20 to 50 km altitude. These WRC-23 frequency-bands relaxation does not apply to satellite operation. With the recognized importance of non-terrestrial networks and the current standardization efforts (e.g., towards 6G), it is expected that the fairly restrictive regime on terrestrial cellular spectrum may be relaxed further to also allow mobile terrestrial spectrum to be used in “Antenna-in-the-Sky” coverage platforms. Nevertheless, HAPS and terrestrial use of cellular frequency spectrum will have to be coordinated to avoid interference and resulting capacity and quality degradation.
SoftBank announced recently (i.e., 28 December 2023 [11]), after deliberations at the WRC-23, that they had successfully gained approval within the Asia-Pacific region (i.e., ITU-R region 3) to use mobile spectrum bands, namely 700-900MHz, 1.7GHz, and 2.5GHz, for stratospheric drone-based mobile broadband cellular services (see also refs. [13]). As a result of this decision, operators in different countries and regions will be able to choose a spectrum with greater flexibility when they introduce HAPS-based mobile broadband communication services, thereby enabling seamless usage with existing smartphones and other devices.
Another example of re-using terrestrial licensed cellular spectrum above ground is SpaceX direct-to-cell capable 2nd generation Starlink satellites.
On January 2nd, 2024, SpaceX launched their new generation of Starlink satellites with direct-to-cell capabilities to close a connection to a regular mobile cellular phone (e.g., smartphone). The new direct-to-cell Starlink satellites use T-Mobile US terrestrial licensed cellular frequency band (i.e., 2×5 MHz Band 25, PCS G-block) and will work, according to T-Mobile US, with most of their existing mobile phones. The initial direct-to-cell commercial plans will only support low-bandwidth text messaging and no voice or more bandwidth-heavy applications (e.g., streaming). Expectations are that the direct-to-cell system would deliver up to 18.3 Mbps (3.66 Mbps/MHz/cell) downlink and up to 7.2 Mbps (1.44 Mbps/MHz/cell) uplink over a channel bandwidth of 5 MHz (maximum).
Given that terrestrial 4G LTE systems struggle with such performance, it will be super interesting to see what the actual performance of the direct-to-cell satellite constellation will be.
COMPARISON WITH LEO SATELLITE BROADBAND NETWORKS.
When juxtaposed with LEO satellite networks such as Starlink (SpaceX), OneWeb (Eutelsat Group), or Kuiper (Amazon), stratospheric drones offer several advantages. Firstly, the proximity to the Earth’s surface (i.e., 300 – 2,000 km) results in lower latency, a critical factor for real-time applications. While LEO satellites, like those used by Starlink, have reduced latency (ca. 3 ms round-trip-time) compared to traditional geostationary satellites (ca. 240 ms round-trip-time), stratospheric drones can provide even quicker response times (one-tenth of an ms in round-trip-time), making the stratospheric drone substantially more beneficial for applications such as emergency services, telemedicine, and high-speed internet services.
A stratospheric platform operating at 20 km altitude and targeting surveillance, all else being equal, would be 25 times better at distinguishing objects apart than an LEO satellite operating at 500 km altitude. The global aerial imaging market is expected to exceed 7 billion euros by 2030, with a CAGR of 14.2% from 2021. The flexibility of the stratospheric drone platform allows for combining cellular broadband services and a wide range of advanced aerial imaging services. Again, it is advantageous that the stratospheric drone regularly returns to Earth for fueling, maintenance, and technology upgrades and enhancements. This is not possible with an LEO satellite platform.
Moreover, the deployment and maintenance of stratospheric drones are, in theory, less complex and costly than launching and maintaining a constellation of satellites. While Starlink and similar projects require significant upfront investment for satellite manufacturing and rocket launches, stratospheric drones can be deployed at a fraction of the cost, making them a more economically viable option for many applications.
The Starlink LEO satellite constellation currently is the most comprehensive satellite (fixed) broadband coverage service. As of November 2023, Starlink had more than 5,000 satellites in low orbit (i.e., ca. 550 km altitude), and an additional 7,000+ are planned to be deployed, with a total target of 12+ thousand satellites. The current generation of Starlink satellites has three downlink phased-array antennas and one uplink phase-array antenna. This specification translates into 48 beams downlink (satellite to ground) and 16 beams uplink (ground to satellite). Each Starlink beam covers approx. 2,800 km2 with a coverage range of ca. 30 km, over which a 250 MHz downlink channel (in the Ku band) has been assigned. According to Portillo et al. [14], the spectral efficiency is estimated to be 2.7 Mbps per MHz, providing a total throughput of a maximum of 675 Mbps in the coverage area or a throughput density of ca. 0.24 Mbps per km2.
According to the latest Q2-2023 Ookla speed test it is found that “among the 27 European countries that were surveyed, Starlink had median download speeds greater than 100 Mbps in 14 countries, greater than 90 Mbps in 20 countries, and greater than 80 in 24 countries, with only three countries failing to reach 70 Mbps” (see reference [18]). Of course, the actual customer experience will depend on the number of concurrent users demanding resources from the LEO satellite as well as weather conditions, proximity of other users, etc. Starlink themselves seem to have set an upper limit of 220 Mbps download speed for their so-called priority service plan or otherwise 100 Mbps (see [19] below). Quite impressive performance if there are no other broadband alternatives available.
According to Elon Musk, SpaceX aims to reduce each Starlink satellite’s cost to less than one million euros. However, according to Elon Musk, the unit price will depend on the design, capabilities, and production volume. The launch cost using the SpaceX Falcon 9 launch vehicle starts at around 57 million euros, and thus, the 50 satellites would add a launch cost of ca. 1.1 million euros per satellite. SpaceX operates, as of September 2023, 150 ground stations (“Starlink Gateways”) globally that continue to connect the satellite network with the internet and ground operations. At Starlink’s operational altitude, the estimated satellite lifetime is between 5 and 7 years due to orbital decay, fuel and propulsion system exhaustion, and component durability. Thus, a LEO satellite business must plan for satellite replacement cycles. This situation differs greatly from the stratospheric drone-based operation, where the vehicles can be continuously maintained and upgraded. Thus, they are significantly more durable, with an expected useful lifetime exceeding ten years and possibly even 20 years of operational use.
Let’s consider our example of Germany and what it would take to provide LEO satellite coverage service targeting rural areas. It is important to understand that a LEO satellite travels at very high speeds (e.g., upwards of 30 thousand km per hour) and thus completes an orbit around Earth in between 90 to 120 minutes (depending on the satellite’s altitude). It is even more important to remember that Earth rotates on its axis (i.e., 24 hours for a full rotation), and the targeted coverage area will have moved compared to a given satellite orbit (this can easily be several hundreds to thousands of kilometers). Thus, to ensure continuous satellite broadband coverage of the same area on Earth, we need a certain number of satellites in a particular orbit and several orbits to ensure continuous coverage at a target area on Earth. We would need at least 210 satellites to provide continuous coverage of Germany. Most of the time, most satellites would not cover Germany, and the operational satellite utilization will be very low unless other areas outside Germany are also being serviced.
Economically, using the Starlink numbers above as a guide, we incur a capital expense of upwards of 450 million euros to realize a satellite constellation that could cover Germany. Let’s also assume that the LEO satellite broadband operator (e.g., Starlink) must build and launch 20 satellites annually to maintain its constellation and thus incur an additional Capex of ca. 40+ million euros annually. This amount does not account for the Capex required to build the ground network and the operations center. Let’s say all the rest requires an additional 10 million euros Capex to realize and for miscellaneous going forward. The technology-related operational expenses should be low, at most 30 million euros annually (this is a guesstimate!) and likely less. So, covering Germany with an LEO broadband satellite platform over ten years would cost ca. 1.3 billion euros. Although substantially more costly than our stratospheric drone platform, it is still less costly than running a rural terrestrial mobile broadband network.
Despite being favorable compared in economic to the terrestrial cellular network, it is highly unlikely to make any operational and economic sense for a single operator to finance such a network, and it would probably only make sense if shared between telecom operators in a country and even more so over multiple countries or states (e.g., European Union, United States, PRC, …).
Despite the implied silliness of a single mobile operator deploying a satellite constellation for a single Western European country (irrespective of it being fairly large), the above example serves two purposes; (1) To illustrates how economically in-efficient rural mobile networks are that a fairly expansive satellite constellation could be more favorable. Keep in mind that most countries have 3 or 4 of them, and (2) It also shows that the for operators to share the economics of a LEO satellite constellation over larger areal footprint may make such a strategy very attractive economically,
Due to the path loss at 550 km (LEO) being substantially higher than at 20 km (stratosphere), all else being equal, the signal quality of the stratospheric broadband drone would be significantly better than that of the LEO satellite. However, designing the LEO satellite with more powerful transmitters and sensitive receivers can compensate for the factor of almost 30 in altitude difference to a certain extent. Clearly, the latency performance of the LEO satellite constellation would be inferior to that of the stratospheric drone-based platform due to the significantly higher operating altitude.
It is, however, the capacity rather than shared cost could be the stumbling block for LEOs: For a rural cellular network or stratospheric drone platform, we see the MNOs effectively having “control” over the capex costs of the network, whether it be the RAN element for a terrestrial network, or the cost of whole drone network (even if it in the future, this might be able to become a shared cost).
However, for the LEO constellation, we think the economics of a single MNO building a LEO constellation even for their own market is almost entirely out of the question (ie multiple €bn capex outlay). Hence, in this situation, the MNOs will rely on a global LEO provider (ie Starlink, or AST Space Mobile) and will “lend” their spectrum to their in their respective geography in order to provide service. Like the HAPs, this will also require further regulatory approvals in order to free up terrestrial spectrum for satellites in rural areas.
We do not yet have the visibility of the payments the LEOs will require, so there is the potential that this could be a lower cost alternative again to rural networks, but as we show below, we think the real limitation for LEOs might not be the shared capacity rental cost, but that there simply won’t be enough capacity available to replicate what a terrestrial network can offer today.
However, the stratospheric drone-based platform provides a near-ideal cellular performance to the consumer, close to the theoretical peak performance of a terrestrial cellular network. It should be emphasized that the theoretical peak cellular performance is typically only experienced, if at all, by consumers if they are very near the terrestrial cellular antenna and in a near free-space propagation environment. This situation is a very rare occurrence for the vast majority of mobile consumers.
Figure 7 summarizes the above comparison between a rural terrestrial cellular network with the non-terrestrial cellular networks such as LEO satellites and Stratospheric drones.
Figure 7 Illustrating a comparison between terrestrial cellular coverage with stratospheric drone-based (“Antenna-in-the-sky”) cellular coverage and Low Earth Orbit (LEO) satellite coverage options.
While the majority of the 5,500+ Starlink constellation is 13 GHz (Ku-band), at the beginning of 2024, Space X launched a few 2nd generation Starlink satellites that support direct connections from the satellite to a normal cellular device (e.g., smartphone), using 5 MHz of T-Mobile USA’s PCS band (1900 MHz). The targeted consumer service, as expressed by T-Mobile USA, is providing texting capabilities over areas with no or poor existing cellular coverage across the USA. This is fairly similar to services at similar cellular coverage areas presently offered by, for example, AST SpaceMobile, OmniSpace, and Lynk Global LEO satellite services with reported maximum speed approaching 20 Mbps. The so-called Direct-2-Device, where the device is a normal smartphone without satellite connectivity functionality, is expected to develop rapidly over the next 10 years and continue to increase the supported user speeds (i.e., utilized terrestrial cellular spectrum) and system capacity in terms of smaller coverage areas and higher number of satellite beams.
Table 1 below provides an overview of the top 10 LEO satellite constellations targeting (fixed) internet services (e.g., Ku band), IoT and M2M services, and Direct-to-Device (or direct-to-cell) services. The data has been compiled from the NewSpace Index website, which should be with data as of 31st of December 2023. The Top-10 satellite constellation rank has been based on the number of launched satellites until the end of 2023. Two additional Direct-2-Cell (D2C or Direct-to-Device, D2D) LEO satellite constellations are planned for 2024-2025. One is SpaceX Starlink 2nd generation, which launched at the beginning of 2024, using T-Mobile USA’s PCS Band to connect (D2D) to normal terrestrial cellular handsets. The other D2D (D2C) service is Inmarsat’s Orchestra satellite constellation based on L-band (for mobile terrestrial services) and Ka for fixed broadband services. One new constellation (Mangata Networks) targeting 5G services. With two 5G constellations already launched, i.e., Galaxy Space (Yinhe) launched 8 LEO satellites, 1,000 planned using Q- and V-bands (i.e., not a D2D cellular 5G service), and OmniSpace launched two satellites and have planned 200 in total. Moreover, currently, there is one planned constellation targeting 6G by the South Korean Hanwha Group (a bit premature, but interesting nevertheless) with 2,000 6G LEO Satellites planned. Most currently launched and planned satellite constellations offering (or plan to provide) Direct-2-Cell services, including IoT and M2M, are designed for low-frequency bandwidth services that are unlikely to compete with terrestrial cellular networks’ quality of service where reasonable good coverage (or better) exists.
In Table 1 below, we then show 5 different services with the key input variables as cell radius, spectral efficiency and downlink spectrum. From this we can derive what the “average” capacity could be per square kilometer of rural coverage.
We focus on this metric as the best measure of capacity available once multiple users are on the service the spectrum available is shared. This is different from “peak” speeds which are only relevant in the case of very few users per cell.
We start with terrestrial cellular today for bands up to 2.1GHz and show that assuming a 2.5km cell radius, the average capacity is equivalent to 11Mbps per sq.km.
For a LEO service using Ku-band, i.e., with 250MHz to an FWA dish, the capacity could be ca. 2Mbps per sq.km.
For a LEO-based D2D device, what is unknown is what the ultimate spectrum allowance could be for satellite services with cellular spectrum bands, and spectral efficiency. Giving the benefit of the doubt on both, but assuming the beam radius is always going to be larger, we can get to an “optimistic” future target of 2Mbps per sq. km, i.e., 1/5th of a rural terrestrial network.
Finally, we show for a stratospheric drone, that given similar cell radius to a rural cell today, but with higher downlink available and greater spectral efficiency, we can reach ca. 55Mbps per sq. km, i.e. 5x what a current rural network can offer.
INTEGRATING WITH 5G AND BEYOND.
The advent of 5G, and eventually 6G, technology brings another dimension to the utility of stratospheric drones delivering mobile broadband services. The high-altitude platform’s ability to seamlessly integrate with existing 5G networks makes them an attractive option for expanding coverage and enhancing network capacity at superior economics, particularly in rural areas where the economics for terrestrial-based cellular coverage tend to be poor. Unlike terrestrial networks that require extensive groundwork for 5G rollout, the non-terrestrial network operator (NTNO) can rapidly deploy stratospheric drones to provide immediate 5G coverage over large areas. The high-altitude platform is also incredibly flexible compared to both LEO satellite constellations and conventional rural cellular network flexibility. The platform can easily be upgraded during its ground maintenance window and can be enhanced as the technology evolves. For example, upgrading to and operationalizing 6G would be far more economical with a stratospheric platform than having to visit thousands or more rural sites to modernize or upgrade the installed active infrastructure.
SUMMARY.
Stratospheric drones represent a significant advancement in the realm of wireless communication. Their strategic positioning in the stratosphere offers superior coverage and connectivity compared to terrestrial networks and low-earth satellite solutions. At the same time, their economic efficiency makes them an attractive alternative to ground-based infrastructures and LEO satellite systems. As technology continues to evolve, these high-altitude platforms (HAPs) are poised to play a crucial role in shaping the future of global broadband connectivity and ultra-high availability connectivity solutions, complementing the burgeoning 5G networks and paving the way for next-generation three-dimensional communication solutions. Moving away from today’s flat-earth terrestrial-locked communication platforms.
The strategic as well as the disruptive potential of the unmanned autonomous stratospheric terrestrial coverage platform is enormous, as shown in this article. It has the potential to make most of the rural (at least) cellular infrastructure redundant, resulting in substantial operational and economic benefits to existing mobile operators. At the same time, the HAPs could, in rural areas, provide much better service overall in terms of availability, improved coverage, and near-ideal speeds compared to what is the case in today’s cellular networks. It might also, at scale, become a serious competitive and economical threat to LEO satellite constellations, such as, for example, Starlink and Kuipers, that would struggle to compete on service quality and capacity compared to a stratospheric coverage platform.
Although the strategic, economic, as well as disruptive potential of the unmanned autonomous stratospheric terrestrial coverage platform is enormous, as shown in this article, the flight platform and advanced antenna technology are still in a relatively early development phase. Substantial regulatory work remains in terms of permitting the terrestrial cellular spectrum to be re-used above terra firma at the “Antenna-in-the-Sky. The latest developments out of WRC-23 for Asia Pacific appear very promising, showing that we are moving in the right direction of re-using terrestrial cellular spectrum in high-altitude coverage platforms. Last but not least, operating an unmanned (autonomous) stratospheric platform involves obtaining certifications as well as permissions and complying with various flight regulations at both national and international levels.
Terrestrial Mobile Broadband Network – takeaway:
It is the de facto practice for mobile cellular networks to cover nearly 100% geographically. The mobile consumer expects a high-quality, high-availability service everywhere.
A terrestrial mobile network has a relatively low area coverage per unit antenna with relatively high capacity and quality.
Mobile operators incur high and sustainable infrastructure costs, especially in rural areas with low or no return on that cost.
Physical obstructions and terrain limit performance (i.e., non-free space characteristics).
Well-established technology with high reliability.
The potential for high bandwidth and low latency in urban areas with high demand may become a limiting factor for LEO satellite constellations and stratospheric drone-based platforms. Thus, it is less likely to provide operational and economic benefits covering high-demand, dense urban, and urban areas.
LEO Satellite Network – takeaway:
The technology is operational and improving. There is currently some competition (e.g., Starlink, Kuiper, OneWeb, etc.) in this space, primarily targeting fixed broadband and satellite backhaul services. Increasingly, new LEO satellite-based business models are launched providing lower-bandwidth cellular-spectrum based direct-to-device (D2D) text, 4G and 5G services to regular consumer and IoT devices (i.e., Starlink, Lynk Global, AST SpaceMobile, OmniSpace, …).
Broader coverage, suitable for global reach. It may only make sense when the business model is viewed from a worldwide reach perspective (e.g., Starlink, OneWeb,…), resulting in much-increased satellite network utilization.
An LEO satellite broadband network can cover a vast area per satellite due to its high altitude. However, such systems are in nature capacity-limited, although beam-forming antenna technologies (e.g., phased array antennas) allow better capacity utilization.
The LEO satellite solutions are best suited for low-population areas with limited demand, such as rural and largely unpopulated areas (e.g., sea areas, deserts, coastlines, Greenland, polar areas, etc.).
Much higher latency compared to terrestrial and drone-based networks.
Less flexible once in orbit. Upgrades and modernization only via replacement.
The LEO satellite has a limited useful operational lifetime due to its lower orbital altitude (e.g., 5 to 7 years).
Lower infrastructure cost for rural coverage compared to terrestrial networks, but substantially higher than drones when targeting regional areas (e.g., Germany or individual countries in general).
Complementary to the existing mobile business model of communications service providers (CSPs) with a substantial business risk to CSPs in low-population areas where little to no capacity limitations may occur.
Requires regulatory permission (authorization) to operate terrestrial frequencies on the satellite platform over any given country. This process is overseen by national regulatory bodies in coordination with the International Telecommunication Union (ITU) as well as national regulators (e.g., FCC in the USA). Satellite operators must apply for frequency bands for uplink and downlink communications and coordinate with the ITU to avoid interference with other satellites and terrestrial systems. In recent years, however, there has been a trend towards more flexible spectrum regulations, allowing for innovative uses of the spectrum like integrating terrestrial and satellite services. This flexibility is crucial in accommodating new technologies and service models.
Operating a LEO satellite constellation requires a comprehensive set of permissions and certifications that encompass international and national space regulations, frequency allocation, launch authorization, adherence to space debris mitigation guidelines, and various liability and insurance requirements.
Both LEO and MEO satellites is likely going to be complementary or supplementary to stratospheric drone-based broadband cellular networks offering high-performing transport solutions and possible even acts as standalone or integrated (with terrestrial networks) 5G core networks or “clouds-in-the-sky”.
Stratospheric Drone-Based Network – takeaway:
It is an emerging technology with ongoing research, trials, and proof of concept.
A stratospheric drone-based broadband network will have lower deployment costs than terrestrial and LEO satellite broadband networks.
In rural areas, the stratospheric drone-based broadband network offers better economics and near-ideal quality than terrestrial mobile networks. In terms of cell size and capacity, it can easily match that of a rural mobile network.
The solution offers flexibility and versatility and can be geographically repositioned as needed. The versatility provides a much broader business model than “just” an alternative rural coverage solution (e.g., aerial imaging, surveillance, defense scenarios, disaster area support, etc.).
Reduced latency compared to LEO satellites.
Also ideal for targeted or temporary coverage needs.
Complementary to the existing mobile business model of communications service providers (CSPs) with additional B2B and public services business potential from its application versatility.
Potential substantial negative impact on the telecom tower business as the stratospheric drone-based broadband network would make (at least) rural terrestrial towers redundant.
May disrupt a substantial part of the LEO satellite business model due to better service quality and capacity leaving the LEO satellite constellations revenue pool to remote areas and specialized use cases.
Requires regulatory permission to operate terrestrial frequencies (i.e., frequency authorization) on the stratospheric drone platform (similar to LEO satellites). Big steps have are already been made at the latest WRC-23, where the frequency bands 698 to 960 MHz, 1710 to 2170 MHz, and 2500 to 2690 MHz has been relaxed to allow for use in HAPS operating at 20 to 50 km altitude (i.e., the stratosphere).
Operating a stratospheric platform in European airspace involves obtaining certifications as well as permissions and (of course) complying with various regulations at both national and international levels. This includes the European Union Aviation Safety Agency (EASA) type certification and the national civil aviation authorities in Europe.
Leichtwerk AG, “High Altitude Platform Stations (HAPS) – A Future Key Element of Broadband Infrastructure” (2023). I recommend to closely follow Leichtwerk AG which is a world champion in making advanced gliding planes. The hydrogen powered StratoStreamer HAP is near-production ready, and they are currently working on a solar-powered platform. Germany is renowned for producing some of the best gliding planes in the world (after WWII Germany was banned from developing and producing aircrafts, military as well as civil. These restrictions was only relaxed in the 60s). Germany has a long and distinguished history in glider development, dating back to the early 20th century. German manufacturers like Schleicher, Schempp-Hirth, and DG Flugzeugbau are among the world’s leading producers of high-quality gliders. These companies are known for their innovative designs, advanced materials, and precision engineering, contributing to Germany’s reputation in this field.
ITU Publication, World Radiocommunications Conference 2023 (WRC-23), Provisional Final Acts, (December 2023). Note1: The International Telecommunication Union (ITU) divides the world into three regions for the management of radio frequency spectrum and satellite orbits: Region 1: includes Europe, Africa, the Middle East west of the Persian Gulf including Iraq, the former Soviet Union, and Mongolia, Region 2: covers the Americas, Greenland, and some of the eastern Pacific Islands, and Region 3: encompasses Asia (excl. the former Soviet Union), Australia, the southwest Pacific, and the Indian Ocean’s islands.
Geoff Huston, “Starlink Protocol Performance” (November 2023). Note 2: The recommendations, such as those designated with “ADD” (additional), are typically firm in the sense that they have been agreed upon by the conference participants. However, they are subject to ratification processes in individual countries. The national regulatory authorities in each member state need to implement these recommendations in accordance with their own legal and regulatory frameworks.
Lynk Global website: https://lynk.world/ (see also FCC Order and Authorization). It should be noted that Lynk can operate within 617 to 960 MHz (Space-to-Earth) and 663 to 915 MHz (Earth-to-Space). However, only outside the USA. Constellation Area: IoT / M2M, Satellite-to-Cellphone, Internet, Direct-to-Cell. 8 LEO satellites out of 10 planned.
Omnispace website: https://omnispace.com/Constellation Area: IoT / M2M, 5G. World’s first global 5G non terrestrial network. Initial support 3GPP-defined Narrow-Band IoT radio interface. Planned 200 LEO and <15 MEO satellites. So far only 2 satellites launched.
NewSpace Index: https://www.newspace.im/ I find this resource having excellent and up-to date information of commercial satellite constellations.
LEOLABS Space visualization – SpaceX Starlink mapping. (deselect “Debris”, “Beams”, and “Instruments”, and select “Follow Earth”). An alternative visualization service for Starlink & OneWeb satellites is the website Satellitemap.space (you might go to settings and turn on signal Intensity which will give you the satellite coverage hexagons).
European Union Aviation Safety Agency (EASA). Note that an EASA-type Type Certificate is a critical document in the world of aviation. This certificate is a seal of approval, indicating that a particular type of aircraft, engine, or aviation component meets all the established safety and environmental standards per EASA’s stringent regulations. When an aircraft, engine, or component is awarded an EASA Type Certificate, it signifies a thorough and rigorous evaluation process that it has undergone. This process assesses everything from design and manufacturing to performance and safety aspects. The issuance of the certificate confirms that the product is safe for use in civil aviation and complies with the necessary airworthiness requirements. These requirements are essential to ensure aircraft operating in civil airspace safety and reliability. Beyond the borders of the European Union, an EASA Type Certificate is also highly regarded globally. Many countries recognize or accept these certificates, which facilitate international trade in aviation products and contribute to the global standardization of aviation safety.
ACKNOWLEDGEMENT.
I greatly acknowledge my wife, Eva Varadi, for her support, patience, and understanding during the creative process of writing this article.
I also greatly appreciate my past collaboration and the many discussions on the topic of Stratospheric Drones in particular and advanced antenna designs and properties in general that I have had with Dr. Jaroslav Holis, Senior R&D Manager (Group Technology, Deutsche Telekom AG) over the last couple of years. When it comes to my early involvement in Stratospheric Drones activities with Group Technology Deutsche Telekom AG, I have to recognize my friend, mentor, and former boss, Dr. Bruno Jacobfeuerborn, former CTO Deutsche Telekom AG and Telekom Deutschland, for his passion and strong support for this activity since 2015. My friend and former colleague Rachid El Hattachi deserves the credit for “discovering” and believing in the opportunities that a cellular broadband-based stratospheric drone brings to the telecom industry.
Many thanks to CEO Dr. Reiner Kickert of Leichtwerk AG for providing some high resolution pictures of his beautiful StratoStreamer.
Thanks to my friend Amit Kerenfor suggesting a great quote that starts this article.
Any errors or unclarities are solely due to myself and not the collaborators and colleagues that have done their best to support this piece.
To my friend Rudolf van der Berg this story is not about how volumetric demand (bytes or bits) results in increased energy consumption (W·h). That notion is silly, as we both “violently” agree on ;-). I recommend that readers also check out Rudolf’s wonderful presentation, “Energy Consumption of the Internet (May 2023),” which he delivered at the RIPE86 student event this year in 2023.
Recently, I had the privilege to watch a presentation by a seasoned executive talk about what his telco company is doing for the environment regarding sustainability and CO2 reduction in general. I think the company is doing something innovative beyond compensating shortfalls with buying certificates and (mis)use of green energy resources.
They replace (reasonably) aggressively their copper infrastructure (country stat for 2022: ~90% of HH/~16% subscriptions) with green sustainable fiber (country stat for 2022: ~78%/~60%). This is an obvious strategy that results in a quantum leap in customer experience potential and helps reduce overall energy consumption resulting from operating the ancient copper network.
Missing a bit imo, was the consideration of and the opportunity to phase out the HFC network (country stat for 2022: ~70%/~60%) and reduce the current HFC+Fibre overbuild of 1.45 and, of course, reduce the energy consumption and operational costs (and complexity) of operating two fixed broadband technologies (3 if we include the copper). However, maybe understandably enough, substantial investments have been made in upgrading to Docsis 3.1. An investment that possibly still is somewhat removed from having been written off.
The “wtf-moment” (in an otherwise very pleasantly and agreeable session) came when the speaker alluded that as part of their sustainability and CO2 reduction strategy, the telco was busy migrating from 4G LTE to 5G with the reasoning that 5G is 90% more energy efficient compared to 4G.
Firstly, it is correct that 5G is (in apples-for-apples comparisons!) ca. 90% more efficient in delivering a single bit compared to 4G. The metric we use is Joules-per-bit or Watts-seconds-per-bit. It is also not uncommon at all to experience Telco executives hinting at the relative greenness of 5G (it is, in my opinion, decidedly not a green broadband communications technology … ).
Secondly, so what! Should we really care about relative energy consumption? After all, we pay for absolute energy consumption, not for whatever relativized measure of consumed energy.
I think I know the answer from the CFO and the in-the-know investors.
If the absolute energy consumption of 5G is higher than that of 4G, I will (most likely) have higher operational costs attributed to that increased power consumption with 5G. If I am not in an apples-for-apples situation, which rarely is the case, and I am anyway really not in, the 5G technology requires substantially more power to provide for new requirements and specifications. I will be worse off regarding the associated cost in absolute terms of money. Unless I also have a higher revenue associated with 5G, I am economically worse off than I was with the older technology.
Having higher information-related energy efficiency in cellular communications systems is a feature of the essential requirement of increasingly better spectral efficiency all else being equal. It does not guarantee that, in absolute monetary terms, a Telco will be better off … far from it!
THE ENERGY OF DELIVERING A BIT.
Energy, which I choose to represent in Joules, is equal to the Power (in Watt or W) that I need to consume per time-unit for a given output unit (e.g., a bit) times the unit of time (e.g., a second) it took to provide the unit.
Take a 4G LTE base station that consumes ca. 5.0kW to deliver a maximum throughput of 160 Mbps per sector (@ 80 MHz per sector). The information energy efficiency of the specific 4G LTE base station (e.g., W·s per bit) would be ca. 10 µJ/bit. The 4G LTE base station requires 10 micro (one millionth) Joules to deliver 1 bit (in 1 second).
In the 5G world, we would have a 5G SA base station, using the same frequency bands as 4G and with an additional 10 MHz @ 700MHz and 100 MHz @ 3.5 GHz included. The 3.5 GHz band is supported by an advanced antenna system (AAS) rather than a classical passive antenna system used for the other frequency bands. This configuration consumes 10 kW with ~40% attributed to the 3.5 GHz AAS, supporting ~1 Gbps per sector (@ 190 MHz per sector). This example’s 5G information energy efficiency would be ca. 0.3 µJ/bit.
In this non-apples-for-apples comparison, 5G is about 30 times more efficient in delivering a bit than 4G LTE (in the example above). Regarding what an operator actually pays for, 5G is twice as costly in energy consumption compared to 4G.
It should be noted that the power consumption is not driven by the volumetric demand but by the time that demand exists and the load per unit of time. Also, base stations will have a power consumption even when idle with the degree depending on the intelligence of the energy management system applied.
So, more formalistic, we have
E per bit = P (in W) · time (in sec) per bit, or in the basic units
J / bit = W·s / bit = W / (bit/s) = W / bps = W / [ MHz · Mbps/MHz/unit · unit-quantity ]
E per bit = P (in W) / [ Bandwidth (in MHz) · Spectral Efficiency (in Mbps/MHz/unit) · unit-quantity ]
It is important to remember that this is about the system spec information efficiency and that there is no direct relationship between the Power that you need and the outputted information your system will ultimately support bit-wise.
and
Thus, the relative efficiency between 4G and 5G is
Currently (i.e., 2023), the various components of the above are approximately within the following ranges.
The power consumption of a 5G RAT is higher than that of a 4G RAT. As we add higher frequency spectrum (e.g., C-band, 6GHz, 23GHz,…) to the 5G RAT, increasingly more spectral bandwidth (B) will be available compared to what was deployed for 4G. This will increase the bit-wise energy efficiency of 5G compared to 4G, although the power consumption is also expected to increase as higher frequencies are supported.
If the bandwidth and system power consumption is the same for both radio access technologies (RATs), then we have the relative information energy efficiency is
Depending on the relative difference in spectral efficiency. 5G is specified and designed to have at least ten times (10x) the spectral efficiency of 4G. If you do the math (assuming apples-to-apples applies), it is no surprise that 5G is specified to be 90% more efficient in delivering a bit (in a given unit of time) compared to 4G LTE.
And just to emphasize the obvious,
RAT refers to the radio access technology, BB is the baseband, freq the cellular frequencies, and idle to the situation where the system is not being utilized.
Volume in Bytes (or bits) does not directly relate to energy consumption. As frequency bands are added to a sector (of a base station), the overall power consumption will increase. Moreover, the more computing is required in the antenna, such as for advanced antenna systems, including massive MiMo antennas, the more power will be consumed in the base station. The more the frequency bands are being utilized in terms of time, the higher will the power consumption be.
Indirectly, as the cellular system is being used, customers consume bits and bytes (=8·bit) that will depend on the effective spectral efficiency (in bps/Hz), the amount of effective bandwidth (in Hz) experienced by the customers, e.g., many customers will be in a coverage situation where they may not benefit for example from higher frequency bands), and the effective time they make use of the cellular network resources. The observant reader will see that I like the term “effective.” The reason is that customers rarely enjoy the maximum possible spectral efficiency. Likely, not all the frequency spectrum covering customers is necessarily being applied to individual customers, depending on their coverage situation.
In the report “A Comparison of the Energy Consumption of Broadband Data Transfer Technologies (November 2021),” the authors show the energy and volumetric consumption of mobile networks in Finland over the period from 2010 to 2020. To be clear, I do not support the author’s assertion of causation between volumetric demand and energy consumption. As I have shown above, volumetric usage does not directly cause a given power consumption level. Over the 10-year period shown in the report, they observe a 70% increase in absolute power consumption (from 404 to 686 GWh, CAGR ~5.5%) and a factor of ~70 in traffic volume (~60 TB to ~4,000 TB, CAGR ~52%). Caution should be made in resisting the temptation to attribute the increase in energy over the period to be directly related to the data volume increase, however weak it is (i.e., note that the authors did not resist that temptation). Rudolf van der Berg has raised several issues with the approach of the above paper (as well as with many other related works) and indicated that the data and approach of the authors may not be reliable. Unfortunately, in this respect, it appears that systematic, reliable, and consistent data in the Telco industry is hard to come by (even if that data should be available to the individual telcos).
Technology change from 2G/3G to 4G, site densification, and more frequency bands can more than easily explain the increase in energy consumption (and all are far better explanations than data volume). It should be noted that there will also be reasons that decrease power consumption over time, such as more efficient electronics (e.g., via modernization), intelligent power management applications, and, last but not least, switching off of older radio access technologies.
The factors that drive a cell site’s absolute energy consumption is
Radio access technology with new technologies generally consumes more energy than older ones (even if the newer technologies have become increasingly more spectrally efficient).
The antenna type and configuration, including computing requirements for advanced signal processing and beamforming algorithms (that will improve the spectral efficiency at the expense of increased absolute energy consumption).
Equipment efficiency. In general, new generations of electronics and systems designs tend to be more energy-efficient for the same level of performance.
Intelligent energy management systems that allow for effective power management strategies will reduce energy consumption compared to what it would have been without such systems.
The network optimization goal policy. Is the cellular network planned and optimized for meeting the demands and needs of the customers (i.e., the economic design framework) or for providing the peak performance to as many customers as possible (i.e., the Umlaut/Ookla performance-driven framework)? The Umlaut/Ookla-optimized network, maxing out on base station configuration, will observe substantially higher energy consumption and associated costs.
The absolute cellular energy consumption has continued to rise as new radio access technologies (RAT) have been introduced irrespective of the leapfrog in those RATS spectral (bits per Hz) and information-related (Joules per bit) efficiencies.
WHY 5G IS NOT A GREEN TECHNOLOGY?
Let’s first re-acquaint ourselves with the 2015 vision of the 5G NGMN whitepaper;
“5G should support a 1,000 times traffic increase in the next ten years timeframe, with energy consumption by the whole network of only half that typically consumed by today’s networks. This leads to the requirement of an energy efficiency increase of x2000 in the next ten years timeframe.” (Section 4.2.2 Energy Efficiency, 5G White Paper by NGMN Alliance, February 2015).
The bold emphasis is my own and not in the paper itself. There is no doubt that the authors of the 5G vision paper had the ambition of making 5G a sustainable and greener cellular alternative than historically had been the case.
So, from the above statement, we have two performance figures that illustrate the ambition of 5G relative to 4G. Firstly, we have a requirement that the 5G energy efficiency should be 2000x higher than 4G (as it was back in the beginning of 2015).
or
if
Getting more spectrum bandwidth is relatively trivial as you go up in frequency and into, for example, the millimeter wave range (and beyond). However, getting 20+ GHz (e.g., 200+x100 MHz @ 4G) of additional practically usable spectrum bandwidth would be rather (=understatement) ambitious.
And that the absolute energy consumption of the whole 5G network should be half of what it was with 4G
If you think about this for a moment. Halfing the absolute energy consumption is an enormous challenge, even if it would have been with the same RAT. It requires innovation leapfrogs across the RAT electronic architecture, design, and material science underlying all of it. In other words, fundamental changes are required in the RF frontend (e.g., Power amplifiers, transceivers), baseband processing, DSP, DAC, ADC, cooling, control and management systems, algorithms, compute, etc…
But reality eats vision for breakfast … There really is no sign that the super-ambitious goal set by the NGMN Alliance in early 2015 is even remotely achievable even if we would give it another ten years (i.e., 2035). We are more than two orders of magnitude away from the visionary target of NGMN, and we are almost at the 10-year anniversary of the vision paper. We more or less get the benefit of the relative difference in spectral efficiency (x10), but no innovation beyond that has contributed very much to quantum leap cellular energy efficiency bit-wise.
I know many operators who will say that from a sustainability perspective, at least before the energy prices went through the roof, it really does not matter that 5G, in absolute terms, leads to substantial increases in energy consumption. They use green energy to supply the energy demand from 5G and pay off $CO_2$ deficits with certificates.
First of all, unless the increased cost can be recovered with the customers (e.g., price plan increase), it is a doubtful economic venue to pursue (and has a bit of a Titanic feel to it … going down together while the orchestra is playing).
Second, we should ask ourselves whether it is really okay for any industry to greedily consume sustainable and still relatively scarce green resources without being incentivized (or encouraged) to pursue alternatives and optimize across mobile and fixed broadband technologies. Particularly when fixed broadband technologies, such as fiber, are available, that would lead to a very sizable and substantial reduction in energy consumption … as customers increasingly adapt to fiber broadband.
Fiber is the greenest and most sustainable access technology we can deploy compared to cellular broadband technologies.
SO WHAT?
5G is a reality. Telcos are and will continue to invest substantially into 5G as they migrate their customers from 4G LTE to what ultimately will be 5G Standalone. The increase in customer experience and new capabilities or enablers are significant. By now, most Telcos will (i.e., 2023) have a very good idea of the operational expense associated with 5G (if not … you better do the math). Some will have been exploring investing in their own green power plants (e.g., solar, wind, hydrogen, etc.) to mitigate part of the energy surge arising from transitioning to 5G.
I suspect that as Telcos start reflecting on Open RAN as they pivot towards 6G (-> 2030+), above and beyond what 6G, as a RAT, may bring of additional operational expense pain, there will be new energy consumption and sustainability surprises to the cellular part of Telcos P&L. In general, breaking up an electronic system into individual (non-integrated) parts, as opposed to being integrated into a single unit, is likely to result in an increased power consumption. Some of the operational in-efficiencies that occur in breaking up a tightly integrated design can be mitigated by power management strategies. Though in order to get such power management strategies to work at the optimum may force a higher degree of supplier uniformity than the original intent of breaking up the tightly integrated system.
However, only Telcos that consider both their mobile and fixed broadband assets together, rather than two silos apart, will gain in value for customers and shareholders. Fixed-mobile (network) conversion should be taken seriously and may lead to very different considerations and strategies than 10+ years ago.
With increasing coverage of fiber and with Telcos stimulating aggressive uptake, it will allow those to redesign the mobile networks for what they were initially supposed to do … provide convenience and service where there is no fixed network present, such as when being mobile and in areas where the economics of a fixed broadband network makes it least likely to be available (e.g., rural areas) although LEO satellites (i.e., here today), maybe stratospheric drones (i.e., 2030+), may offer solid economic alternatives for those places. Interestingly, further simplifying the cellular networks supporting those areas today.
TAKE AWAY.
Volume in Bytes (or bits) does not directly relate to the energy consumption of the underlying communications networks that enable the usage.
The duration, the time scale, of the customer’s usage (i.e., the use of the network resources) does cause power consumption.
The bit-wise energy efficiency of 5G is superior to that of 4G LTE. It is designed that way via its spectral efficiency. Despite this, a 5G site configuration is likely to consume more energy than a 4G LTE site in the field and, thus, not a like-for-like in terms of number of bands and type of antennas deployed.
The absolute power consumption of a 5G configuration is a function of the number of bands deployed, the type of antennas deployed, intelligent energy management features, and the effective time 5G resources that customers have demanded.
Due to its optical foundation, Fiber is far more energy efficient in both bit-wise relative terms and absolute terms than any other legacy fixed (e.g., xDSL, HFC) or cellular broadband technology (e.g., 4G, 5G).
Looking forward and with the increasing challenges of remaining sustainable and contributing to CO2 reduction, it is paramount to consider an energy-optimized fixed and mobile converged network architecture as opposed to today’s approach of optimizing the fixed network separately from the cellular network. As a society, we should expect that the industry works hard to achieve an overall reduction in energy consumption, relaxing the demand on existing green energy infrastructures.
With 5G as of today, we are orders of magnitude from the original NGMN vision of energy consumption of only half of what was consumed by cellular networks ten years ago (i.e., 2014), requiring an overall energy efficiency increase of x2000.
Be aware that many Telcos and Infrastructure providers will use bit-wise energy efficiency when they report on energy consumption. They will generally report impressive gains over time in the energy that networks consume to deliver bits to their customers. This is the least one should expect.
Last but not least, the telco world is not static and is RAT-wise not very clean, as mobile networks will have several RATs deployed simultaneously (e.g., 2G, 4G, and 5G). As such, we rarely (if ever) have apples-to-apples comparisons on cellular energy consumption.
ACKNOWLEDGEMENT.
I greatly acknowledge my wife, Eva Varadi, for her support, patience, and understanding during the creative process of writing this article. I also greatly appreciate the discussion on this topic that I have had with Rudolf van der Berg over the last couple of years. I thank him for pointing out and reminding me (when I forget) of the shortfalls and poor quality of most of the academic work and lobbying activities done in this area.
PS
If you are aiming at a leapfrog in absolute energy reduction of your cellular network, above and beyond what you get with your infrastructure suppliers (e.g., Nokia, Ericsson, Huawei…), I really recommend you take a look at Opanga‘s machine learning-based Joule ML solution. The Joules ML has been proven to reduce RAN energy costs by 20% – 40% on top of what the RAT supplier’s (e.g., Ericsson, Nokia, Huawei, etc.) own energy management solutions may bring.
Disclosure: I am associated with Opanga and on their Industry Advisory Board.
I am getting a bit sentimental as I haven’t written much about cellular data consumption for the last 10+ years. At the time, it did not take long for most folks in and out of our industry to realize that data traffic and, thereby, so many believed, the total cost of providing the cellular data would be growing far beyond the associated data revenues, e.g., remember the famous scissor chart back in the early two thousand tens. Many believed (then) that cellular data growth would be the undoing of the cellular industry. In 2011 many believed that the Industry only had a few more years before the total cost of providing cellular data would exceed the revenue rendering cellular data unprofitable. Ten years after, our industry remains alive and kicking (though they might not want to admit it too loudly).
Much of the past fear was due to not completely understanding the technology drivers, e.g., bits per second is a driver, and bytes that price plans were structured around not so much. The initial huge growth rates of data consumption that were observed did not make the unease smaller, i.e., often forgetting that a bit more can be represented as a huge growth rate when you start with almost nothing. Moreover, we also did have big scaling challenges with 3G data delivery. It became quickly clear that 3G was not what it had been hyped to be by the industry.
And … despite the historical evidence to the contrary, there are still to this day many industry insiders that believe that a Byte lost or gained is directly related to a loss or gain in revenue in a linear fashion. Our brains prefer straight lines and linear thinking, happily ignoring the unpleasantries of the non-linear world around us, often created by ourselves.
Figure 1 illustrates linear or straight-line thinking (left side), preferred by our human brains, contrasting the often non-linear reality (right side). It should be emphasized that horizontal and vertical lines, although linear, are not typically something that instinctively enters the cognitive process of assessing real-world trends.
Of course, if the non-linear price plans for cellular data were as depicted above in Figure 1, such insiders would be right even if anchored in linear thinking (i.e., even in the non-linear example to the right, an increase in consumption (GBs) leads to an increase in revenue). However, when it comes to cellular data price plans, the price vs. consumption is much more “beastly,” as shown below (in Figure 2);
Figure 2 illustrates the two most common price plan structures in Telcoland; (a, left side) the typical step function price logic that associates a range of data consumption with a price point, i.e., the price is a constant independent of the consumption over the data range. The price level is presented as price versus the maximum allowed consumption. This is by far the most common price plan logic in use. (b, right side) The “unlimited” price plan logic has one price level and allows for unlimited data consumption. T-Mobile US, Swisscom, and SK Telecom have all endorsed the unlimited with good examples of such pricing logic. The interesting fact is that most of those operators have several levels of unlimited tied to the consumptive behavior where above a given limit, the customer may be throttled (i.e., the speed will be reduced compared to before reaching the limit), or (and!) the unlimited plan is tied to either radio access technology (e.g., 4G, 4G+5G, 5G) or a given speed (e.g., 50 Mbps, 100 Mbps, 1Gbps, ..).
Most cellular data price plans follow a step function-like pricing logic as shown in Figure 2 (left side), where within each level, the price is constant up to the nominal data consumption value (i.e., purple dot) of the given plan, irrespective of the consumption. The most extreme version of this logic is the unlimited price plan, where the price level is independent of the volumetric data consumption. Although, “funny” enough, many operators have designed unlimited price plans that, in one way or another, depend on the customers’ consumption, e.g., after a certain level of unlimited consumption (e.g., 200 GB), cellular speed is throttled substantially (at least if the cell under which the customer demand resources are congested). So the “logic” is that if you wanted true unlimited, you still need to pay more than if you only require “unlimited”. Note that for the mathematically inclined, the step function is regarded as (piece-wise) linear … Although our linear brains might not appreciate that finesse very much. Maybe a heuristic that “The brain thinks in straight lines” would be more precisely restated as “The brain thinks in continuous non-constant monotonous straight lines”.
Any increase in consumption within a given pricing-consumption level will not result in any additional revenue. Most price plans allow for considerable growth without incurring additional associated revenues.
NETHERLANDS vs INDONESIA – BRIEFLY.
I like to keep informed and updated about markets I have worked in, with operators I have worked for, and with. I have worked across the globe in many very diverse markets and with operators in vastly different business cycles gives an interesting perspective on our industry. Throughout my career, I have been super interested in the difference between Telco operations and strategies in so-called mature markets versus what today may be much more of a misnomer than 10+ years ago, emerging markets.
The average cellular, without WiFi, consumption per customer in Indonesia was ca. 8 GB per month in 2022. That consumption would cost around 50 thousand Rp (ca. 3 euros) per month. For comparison, in The Netherlands, that consumption profile would cost a consumer around 16 euros per month. As of May 2023, the median cellular download speed was 106 Mbps (i.e., helped by countrywide 5G deployment, for 4G only, the speed would be around 60 to 80 Mbps) compared with 22 Mbps in Indonesia (i.e., where 5G has just been launched. Interestingly, although most likely coincidental, in Indonesia, a cellular data customer would pay ca. 5 times less than in the Netherlands for the same volumetric consumption. Note that for 2023, the average annual income in Indonesia is about one-quarter of that in the Netherlands. However, the Indonesian cellular consumer would also have one-fifth of the quality measured by downlink speed from the cellular base station to the consumer’s smartphone.
Let’s go deeper into how effective consumptive growth of cellular data is monetized… what may impact the consumptive growth, positively and negatively, and how it relates to the telco’s topline.
CELLULAR BUSINESS DYNAMICS.
Figure 3 Between 2016 and 2021, Western European Telcos lost almost 7% of their total cellular turnover (ca. 7+ billion euros over the markets I follow). This corresponds to a total revenue loss of ca. 1.4% per year over the period. To no surprise, the loss of cellular voice-based revenue has been truly horrendous, with an annual loss ca. 30%, although the Covid year (2021 and 2022, for that matter) was good to voice revenues (as we found ourselves confined to our homes and a call away from our colleagues). On the positive side, cellular data-based revenues have “positively” contributed to the revenue in Western Europe over the period (we don’t really know the counterfactual), with an annual growth of ca. 4%. Since 2016 cellular data revenues have exceeded that of cellular voice revenues and are 2022 expected to be around 70% of the total cellular revenue (for Western Europe). Cellular revenues have been and remain under pressure, even with a positive contribution from cellular data. The growth of cellular data volume (not including the contribution generated from WiFi usage) has continued to grow with a 38% annualized growth rate and is today (i.e., 2023) more than five times that of 2016. The annual growth rate of cellular data consumption per customer is somewhat lower ranging from the mid-twenties to the end-thirties percent. Needless to say that the corresponding cellular ARPU has not experienced anywhere near similar growth. In fact, cellular ARPU has generally been lowered over the period.
Some, in my opinion, obvious observations that are worth making on cellular data (I come to realize that although I find these obvious, I am often confronted with a lack of awareness or understanding of those);
Cellular data consumption grows much (much) faster than the corresponding data revenue (i.e., 38% vs 4% for Western Europe).
The unit growth of cellular data consumption does not lead to the same unit growth in the corresponding cellular data revenues.
Within most finite cellular data plans (thus the not unlimited ones), substantial data growth potential can be realized without resulting in a net increase of data-related revenues. This is, of course, trivial for unlimited plans.
The anticipated death of the cellular industry back in the twenty-tens was an exaggeration. The Industry’s death by signaling, voluptuous & unconstrained volumes of demanded data, and ever-decreasing euros per Bytes remains a fading memory and, of course, in PowerPoints of that time (I have provided some of my own from that period below). A good scare does wonders to stimulate innovation to avoid “Armageddon.” The telecom industry remains alive and well.
Figure 4 The latest data (up to 2022) from OECD on mobile data consumption dynamics. Source data can be found at OECD Data Explorer. The data illustrates the slowdown in cellular data growth from a customer perspective and in terms of total generated mobile data. Looking over the period, the 5-year cumulative growth rate between 2016 and 2021 is higher than 2017 to 2022 as well as the growth rate between 2022 and 2021 was, in general, even lower. This indicates a general slowdown in mobile data consumption as 4G consumption (in Western Europe) saturates and 5G consumption still picks up. Although this is not an account of the observed growth dynamics over the years, given the data for 2022 was just released, I felt it was worth including these for completeness. Unfortunately, I have not yet acquired the cellular revenue structure (e.g., voice and data) for 2022, it is work in progress.
WHAT DRIVES CONSUMPTIVE DATA GROWTH … POSITIVE & NEGATIVE.
What drives the consumer’s cellular data consumption? As I have done with my team for many years, a cellular operator with data analytics capabilities can easily check the list of positive and negative contributors driving cellular data consumption below.
Positive Growth Contributors:
Customer or adopter uptake. That is, new or old, customers that go from non-data to data customers (i.e., adopting cellular data).
Increased data consumption (i.e., usage per adopter) within the cellular data customer base that is driven by a lot of the enablers below;
Affordable pricing and suitable price plans.
More capable Radio Access Technology (RAT), e.g., HSDPA → HSPA+ → LTE → 5G, effectively higher spectral efficiency from advanced antenna systems. Typically will drive up the per-customer data consumption to the extent that pricing is not a barrier to usage.
More available cellular frequency spectrum is provisioned on the best RAT (regarding spectral efficiency).
Good enough cellular network consistent with customer demand.
Affordable and capable device ecosystem.
Faster mobile device CPU leads to higher consumption.
Faster & more capable mobile GPUs lead to higher consumption.
Device screen size. The larger the screen, the higher the consumption.
Access to popular content and social media.
Figure 5 illustrates the description of data growth as depending on the uptake of Adopters and the associated growth rate α(t) multiplied by the Usage per Adopter and the associated growth rate of usage μ(t). The growth of the Adopters can typically be approximated by an S-curve reaching its maximum as there are few more customers left to adopt a new service or product or RAT (i.e., α(t)→0%). As described in this section, the growth of usage per adopter, μ(t), will depend on many factors. Our intuition of μ is that it is positive for cellular data and historically has exceeded 30%. A negative μ would be an indication of consumptive churn. It should not be surprising that overall cellular data consumption growth can be very large as the Adopter growth rate is at its peak (i.e., around the S-curve inflection point), and Usage growth is high as well. It also should not be too surprising that after Adopter uptake has reached the inflection point, the overall growth will slow down and eventually be driven by the Usage per Adopter growth rate.
Figure 6 Using the OECD data (OECD Data Explorer) for the Western European mobile data per customer consumptive growth from 2011 to 2022, the above illustrates the annual growth rate of per-customer data mobile consumption. Mobile data consumption is a blend of usage across the various RATs enabling packet data usage. There is a clear increased annual growth after introducing LTE (4G) followed by a slowdown in annual growth, possibly due to reaching saturation in 4G adaptation, i.e., α3G→4G(t) → 0% leaving μ4G(t) driving the cellular data growth. There is a relatively weak increase in 2021, and although the timing coincides with 5G non-standalone (NSA) introduction (typically at 700 MHz or dynamics spectrum share (DSS) with 4G, e.g., Vodafone-Ziggo NL using their 1800 MHz for 4G and 5G) the increase in 2020 may be better attributed to Covid lockdown than a spurt in data consumption due to 5G NSA intro.
Anything that creates more capacity and quality (e.g., increased spectral efficiency, more spectrum, new, more capable RAT, better antennas, …) will, in general, result in an increased usage overall as well as on a per-customer basis (remember most price plans allow for substantial growth within the plans data-volume limit without incurring more cost for the customer). If one takes the above counterfactual, it should not be surprising that this would result in slower or negative consumption growth.
Negative growth contributors:
Cellular congestion causes increased packet loss, retransmissions, and deteriorating latency and speed performance. All in all, congestion may have a substantial negative impact on the customer’s service experience.
Throttling policies will always lower consumption and usage in general, as quality is intentionally lowered by the Telco.
Increased share of QUIC content on the network. The QUIC protocol is used by many streaming video providers (e.g., Youtube, Facebook, TikTok, …). The protocol improves performance (e.g., speed, latency, packet delivery, network changes, …) and security. Services using QUIC will “bully” other applications that use TCP/IP, encouraging TCP/IP to back off from using bandwidth. In this respect, QUIC is not a fair protocol.
Elephant flow dynamics (e.g., few traffic flows causing cell congestion and service degradation for the many). In general, elephant flows, particularly QUIC based, will cause an increase in TCP/IP data packet retransmissions and timing penalties. It is very much a situation where a few traffic flows cause significant service degradation for many customers.
One of the manifestations of cell congestion is packet loss and packet retransmission. Packet loss due to congestion ranges from 1% to 5%. or even several times higher at moments of peak traffic or if the user is in a poor cellular coverage area. The higher the packet loss, the worse the congestion, and the worse the customer experience. The underlying IP protocols will attempt to recover a lost packet by retransmission. The retransmission rate can easily exceed 10% to 15% in case of congestion. Generally, for a reliable and well-operated network, the packet loss should be well below 1% and even as low as 0.1%. Likewise, one would expect a packet retransmission rate of less than 2% (I believe the target should be less than 1%).
Thus, customers that happen to be under a given congested cell (e.g., caused by an elephant flow) would incur a substantially higher rate of retransmitted data packages (i.e., 10% to 15% or higher) as the TCP/IP protocol tries to make up for lost data packages. The customer may experience substantial service quality degradation and, as a final (unintended) “insult”, often be charged for those additional retransmitted data volumes.
From a cellular perspective, as the congestion has been relieved, the cellular operator may observe that the volume on the congested cell actually drops. The reason is that the packet loss and retransmission drops to a level far below the congested one (e.g., typically below 1%). As the quality improves for all customers demanding service from the previously overloaded (i.e., congested) cell, sustainable volume growth will commence in total and as well as will the average consumption on a customer basis. As will be shown below for normal cellular data consumption and most (if not all) price plans, a few percentage points drop in data volume will not have any meaningful effect on revenues. Either because the (temporary) drop happens within the boundaries of a given price plan level and thus has no effect on revenue, or because the overall gainful consumptive growth, as opposed to data volume attributed to poor quality, far exceeds the volume loss due to improved capacity and quality of a congested cell.
Well-balanced and available cellular sites will experience positive and sustainable data traffic growth.
Congested and over-loaded cellular sites will experience a negative and persistent reduction of data traffic.
Actively managing the few elephant flows and their negative impact on the many will increasecustomer satisfaction, reduce consumptive churn, and increase data growth, easily compensating for the congestion-induced increases due to packet retransmission. And unless an operator consistently is starved for radio access investments, or has poor radio access capacity management processes, most cell congestion can be attributed to the so-called elephant flows.
CELLULAR DATA CONSUMPTION IN REAL NETWORKS – ON A SECTOR LEVEL.
And irrespective of whatever drives positive and negative growth, it is worth remembering that daily traffic variations on a sector-by-sector basis and an overall cellular network level are entirely natural. An illustration of such natural sector variation over a (non-holiday) week is shown below in Figure 7 (c) for a sector in the top-20% of busiest sectors. In this example, the median variation over all sectors in the same week, as shown below, was around 10%. I often observe that even telco people (that should know better) find this natural variation quite worrisome as it appears counterintuitive to their linear growth expectations. Proper statistical measurement & analysis methodologies must be in place if inferences and solid analysis are required on a sector (or cell) basis over a relatively short time period (e.g., day, days, week, weeks,…).
Figure 7 illustrates the cellular data consumption daily variation over a (non-holiday) week. In the above, there are three examples (a) a sector from the bottom 20% in terms of carried volume, (b) a sector with a median data volume, and (c) a sector taken from the top 20% of carried data volume. Over the three different sectors (low, median, high) we observe very different variations over weekdays. From the top-20%, we have an almost 30% variation between the weekly minimum (Tuesday) and the weekly maximum (Thursday) to the bottom-20% with a variation in excess of 200% over the week. The charts above show another trend we observe in cellular networks regarding consumptive variations over time. Busy sectors tend to have a lower weekly variation than less busy sectors. I should point out that I have made no effort to select particular sectors. I could easily find some (of the less busy sectors) with even more wild variations than shown above.
The day-to-day variation is naturally occurring based on the dynamic behavior of the customers served by a given sector or cell (in a sector). I am frequently confronted with technology colleagues (whom I respect for their deep technical knowledge) that appear to expect (data) traffic on all levels monotonously increase with a daily growth rate that amounts to the annual CAGR observed by comparing the end-of-period volume level with the beginning of period volume level. Most have not bothered to look at actual network data and do not understand (or, to put it more nicely, simply ignore) the naturally statistical behavior of traffic that drives hourly, daily, weekly, and monthly variations. If you let statistical variations that you have no control over drive your planning & optimization decisions. In that case, you will likely fail to decide on the business-critical ones you can control.
An example of a high-traffic (top-20%) sector’s complete 365 day variations of data consumption is shown below in Figure 8. We observe that the average consumption (or traffic demand) increases nicely over the year with a bit of a slowdown (in this European example) during the summer vacation season (same around official holidays in general). Seasonal variations is naturally occurring and often will result in a lower-than-usual daily growth rate and a change in daily variations. In the sector traffic example below, Tuesdays and Saturdays are (typically) lower than the average, and Thursdays are higher than average. The annual growth is positive despite the consumptive lows over the year, which would typically freak out my previously mentioned industry colleagues. Of course, every site, sector, and cell will have a different yearly growth rate, most likely close to a normal distribution around the gross annual growth rate.
Figure 8 illustrates a top-20% sector’s data traffic growth dynamics (in GB) over a calendar year’s 365 days. Tuesdays and Saturdays are likely below the weekly average data consumption, and Thursdays are more likely to be above. Furthermore, the daily traffic growth is slowing around national holidays and in the summer vacation (i.e., July & August for this particular Western European country).
And to nail down the message. As shown in the example in Figure 9 below, every sector in your cellular network from one time period to the other will have a different positive and negative growth rate. The net effect over time (in terms of months more than days or weeks) is positive as long as customers adopt the supplied RAT (i.e., if customers are migrating from 4G to 5G, it may very well be that 4G consumed data will decline while the 5G consumed data will increase) and of course, as long as the provided quality is consistent with the expected and demanded quality, i.e., sectors with congestion, particular so-called elephant-flow induced congestion, will hurt the quality of the many that may reduce their consumptive behavior and eventually churn.
Figure 9 illustrates the variation in growth rates across 15+ thousand sectors in a cellular network comparing the demanded data volume between two consecutive Mondays per sector. Statistical analysis of the above data shows that the overall average value is ca. 0.49% and slightly skewed towards the positive growths rates (e.g., if you would compare a Monday with a Tuesday, the histogram would typically be skewed towards the negative side of the growth rates as Tuesday are a lower traffic day compared to Monday). Also, with the danger of pointing out the obvious, the daily or weekly growth rates expected from an annual growth rate of, for example, 30% are relatively minute, with ca. 0.07% and 0.49%, respectively.
The examples above (Figures 7, 8, and 9) are from a year in the past when Verstappen had yet to win his first F1 championship. That particular weekend also did not show F1 (or Sunday would have looked very different … i.e., much higher) or any other big sports event.
CELLULAR DATA PRICE PLAN LOGIC.
Figure 10 above is an example of the structure of a price plan. Possibly represented slightly differently from how your marketeer would do (and I am at peace with that). We observe the illustration of a price level of 8 data volume intervals on the upper left chart. This we can also write as (following the terminology of the lower right corner);
Thus, for the package allowing the customer to consume up to 3 GB is priced at 20 (irrespective of whether the customer would consume less). For package a consumer would pay 100 for a data consumption allowance up to 35 GB. Of course, we assume that the consumer choosing this package would generally consume more than 24 GB, which is the next cheaper package (i.e., ).
The price plan example above clearly shows that each price level offers customers room to grow before upgrading to the next level. For example, a customer consuming no more than 8 GB per month, fitting into , could increase consumption with 4 GB (+50%) before considering the next level price plan (i.e., ). This is just to illustrate that even if the customer’s consumption may grow substantially, one should not per se be expecting more revenue.
Even though it should be reasonably straightforward that substantial growth of a customer base data consumption cannot be expected to lead to an equivalent growth in revenue, many telco insiders instinctively believe this should be the case. I believe that the error may be due to many mentally linearizing the step-function price plans (see Figure 2 upper right side) and simply (but erroneously) believing that any increase (decrease) in consumption directly results in an increase (or decrease) in revenue.
DATA PRICING LOGIC & USAGE DISTRIBUTION.
If we want to understand how consumptive behavior impacts cellular operators’ toplines, we need to know how the actual consumption distributes across the pricing logic. As a high-level illustration, Figure 11 (below) shows the data price step-function logic from Figure 9 with an overall consumptive distribution superimposed (orange solid line). It should be appreciated that while this provides a fairly clear way of associating consumption with pricing, it is an oversimplification at best. It will nevertheless allow me to estimate crudely the number of customers that are likely to have chosen a particular price plan matching their demand (and affordability). In reality, we will have customers that have chosen a given price plan but either consume less than the limit of the next cheaper plan (thus, if consistently so, could save but go to that plan). We will also have customers that consume more than their allowed limit. Usually, this would result in the operator throttling the speed and sending a message to the customer that the consumption exceeds the limit of the chosen price plan. If a customer would consistently overshoots the limits (with a given margin) of the chosen plan, it is likely that eventually, the customer will upgrade to the next more expensive plan with a higher data allowance.
Figure 11 above illustrates on the left side a consumptive distribution (orange line) identified by its mean and standard deviation superimposed on our price plan step-function logic example. The right summarizes the consumptive distribution across the eight price plan levels. Note that there is a 9th level in case the 200 GB limit is breached (0.2% in this example). I am assuming that such customers pay twice the price for the 200 GB price plan (i.e., 320).
In the example of an operator with 100 million cellular customers, the consumptive distribution and the given price plan lead to a fiat of 7+ billion per month. However, with a consumptive growth rate of 30% to 40% annually per active cellular data user (on average), what kind of growth should we expect from the associated cellular data revenues?
Figure 12 In the above illustration, I have mapped the consumptive distribution to the price plan levels and then developed the begin-of-period consumptive distribution (i.e., the light green curve) month by month until month 12 has been reached (i.e., the yellow curve). I assume the average monthly consumptive cellular data growth is 2.5% or ca. 35% after 12 months. Furthermore, I assume that for the few customers falling outside the 200 GB limit that they will purchase another 200 GB plan. For completeness, the previous 12 months (previous year) need to be carried out to compare the total cumulated cellular data revenue between the current and previous periods.
Within the current period (shown in Figure 12 above), the monthly cellular data revenue CAGR comes out at 0.6% or a total growth of 7.4% of monthly revenue between the beginning period and the end period. Over the same period, the average data consumption (per user) grew by ca. 34.5%. In terms of the current year’s total data revenue to the previous year’s total data revenue, we get an annual growth rate of 8.3%. This illustrates that it should not be surprising that the revenue growth can be far smaller than the consumptive growth given price plans such as the above.
It should be pointed out that the above illustration of consumptive and revenue growth simplifies the growth dynamics. For example, the simulation ignores seasonal swings over a 12-month period. Also, it attributes 1-to-1 all consumption falling within the price range to that particular price level when there is always spillover on both upper and lower levels of a price range that will not incur higher or lower revenues. Moreover, while mapping the consumptive distribution to the price-plan giga-byte intervals makes the simulation faster (and setup certainly easier), it is also not a very accurate approach to the coarseness of the intervals.
A LEVEL DEEPER.
While working with just one consumptive distribution, as in Figure 11 and Figure 12 above, allows for simpler considerations, it does not fully reflect the reality that every price plan level will have its own consumptive distribution. So let us go that level deeper and see whether it makes a difference.
Figure 13 above, illustrates the consumptive distribution within a given price plan range, e.g., the “5 GB @ 30” price-plan level for customers with a consumption higher than 3 GB and less than or equal to 5 GB. It should come as no surprise that some customers may not reach even the 3 GB, even though they pay for (up to) 5 GB, and some may occasionally exceed the 5 GB limit. In the example above, 10% of customers have a consumption below 3 GB (and could have chosen the next cheaper plan of up to 3 GB), and 3% exceed the limits of the chosen plan (an event that may result in the usage speed being throttled). As the average usage within a given price plan level approaches the ceiling (e.g., 5 GB in the above illustration), in general, the standard deviation will reduce accordingly as customers will jump to the Next Expensive Plan to meet their consumptive needs (e.g., “12 GB @ 50” level in the illustration above).
Figure 14 generalizes Figure 11 to the full price plan and, as illustrated in Figure 12, let the consumption profiles develop in time over a 12-month period (Initial and +12 month shown in the above illustration). The difference between the initial and 12 months can be best appreciated with the four smaller figures that break up the price plan levels in 0 to 40 GB and 40 to 200 GB.
The result in terms of cellular data revenue growth is comparable to that of the higher-level approach of Figure 12 (ca. 8% annual revenue growth vs 34 % overall consumptive annual growth rate). The detailed approach of Figure 11 is, however, more complicated to get working and requires much more real data to work with (which obviously should be available to operators in this time and age). One should note that in the illustrated example price plan (used in the figures above) that at a 2.5% monthly consumptive growth rate (i.e., 34% annually), it would take a customer an average of 24 months (spread of 14 to 35 month depending on level) to traverse a price plan level from the beginning of the level (e.g., 5 GB) to the end of the level (12 GB). It should also be clear that as a customer enters the highest price plan levels (e.g., 100 GB and 200 GB), little additional can be expected to be earned on those customers over their consumptive lifetime.
The illustrated detailed approach shown above is, in particular, useful to test a given price plan’s profitability and growth potential, given the particularities of the customers’ consumptive growth dynamics.
The additional finesse that could be considered in the analysis could be an affordability approach because the growth within a given price level slows down as the average consumption approaches the limit of the given price level. This could be considered by slowing the mean growth rate and allowing for the variance to narrow as the density function approaches the limit. In my simpler approach, the consumptive distributions will continue to grow at a constant growth rate. In particular, one should consider more sophisticated approaches to modeling the variance that determines the spillover into less and more expensive levels. An operator should note that consumption that reduces or consistently falls into the less expensive level expresses consumptive churn. This should be monitored on a customer level as well as on a radio access cell level. Consumptive churn often reflects the supplied radio access quality is out of sync with the customer demand dynamics and expectations. On a radio access cell level, the diligent operator will observe a sharp increase in retransmitted data packages and increased latency on a flow (and active customer basis) hallmarks of a congested cell.
WRAPPING UP.
To this day, 20+ odd years after the first packet data cellular price plans were introduced, I still have meetings with industry colleagues where they state that they cannot implement quality-enhancing technologies for the fear that data consumption may reduce and by that their revenues. Funny enough, often the fear is that by improving the quality for typically many of their customers being penalized by a few customers’ usage patterns (e.g., the elephants in the data pipe), the data packet loss and TCP/IP retransmissions are reducing as the quality is improving and more customers are getting the service they have paid for. It is ignoring the commonly established fact of our industry that improving the customer experience leads to sustainable growth in consumption that consequently may also have a positive topline impact.
I am often in situations where I am surprised with how little understanding and feeling Telco employees have for their own price plans, consumptive behavior, and the impact these have on their company’s performance. This may be due to the fairly complex price plans telcos are inventing, and our brain’s propensity for linear thinking certainly doesn’t make it easier. It may also be because Telcos rarely spend any effort educating their employees about their price plans and products (after all, employees often get all the goodies for “free”, so why bother?). Do a simple test at your next town hall meeting and ask your CXOs about your company’s price plans and their effectiveness in monetizing consumption.
So what to look out for?
Many in our industry have an inflated idea (to a fault) about how effective consumptive growth is being monetized within their company’s price plans.
Most of today’s cellular data plans can accommodate substantial growth without leading to equivalent associated data revenue growth.
The apparent disconnect between the growth rate of cellular data consumption (CAGR ~30+%), in its totality as well on an average per-customer basis, and cellular data revenues growth rate (CAGR < 10%) is simply due to the industry’s price plan structures allowing for substantial growth without a proportion revenue growth.
ACKNOWLEDGEMENT.
I greatly acknowledge my wife, Eva Varadi, for her support, patience, and understanding during the creative process of writing this Blog.
Tellabs “End of Profit” study executive summary (wordpress.com), (2011). This study very much echoed the increasing Industry concern back in 2010-2012 that cellular data growth would become unprofitable and the industry’s undoing. The basic premise was that the explosive growth of cellular data and, thus, the total cost of maintaining the demand would lead to a situation where the total cost per GB would exceed the revenue per GB within the next couple of years. This btw. was also a trigger point for many cellular-focused telcos to re-think their strategies towards the integrated telco having internal access to fixed and mobile broadband.
B. de Langhe et al., “Linear Thinking in a Nonlinear World”, Harvard Business Review, (May-June, 2017). It is a very nice and compelling article about how difficult it is to get around linear thinking in a non-linear world. Our brains prefer straight lines and linear patterns and dependencies. However, this may lead to rather amazing mistakes and miscalculations in our clearly nonlinear world.
OECD Data Explorer A great source of telecom data, for example, cellular data usage per customer, and the number of cellular data customers, across many countries. Recently includes 2022 data.
I have used Mobile Data – Europe | Statista Market Forecast to better understand the distribution between cellular voice and data revenues. Most Telcos do not break out their cellular voice and data revenues from their total cellular revenues. Thus, in general, such splits are based on historical information where it was reported, extrapolations, estimates, or more comprehensive models.
K.-C. Lan and J. Heidemann, “A measurement study of correlations of Internet flow characteristic” (February 2006). This seminal paper has inspired many other research works on elephant flows. A flow should be understood as an unidirectional series of IP packets with the same source and destination addresses, port numbers, and protocol numbers. The authors define elephant flows as flows with a size larger than the mean plus three standard deviations of the sampled data. Though it is important to point out that the definition is less important. Such elephant flows are typically few (less than 20%) but will cause cell congestion by reducing the quality of many requiring a service in such an affected cell.
Opanga Networks is a fascinating and truly innovative company. Using AI, they have developed their solution around the idea of how to manage data traffic flows, reduce congestion, and increase customer quality. Their (N2000) solution addresses particular network situations where a limited number of customer data usage takes up a disproportionate amount of resources within the cellular network (i.e., the problem with elephant flows). Opanga’s solution optimizes those traffic congestion-impacting flows and results in an overall increase in service quality and customer experience. Thus, the beauty of the solution is that the few traffic patterns, causing the cellular congestion, continue without degradation, allowing the many traffic patterns that were impacted by the few to continue at their optimum quality level. Overall, many more customers are happy with their service. The operator avoids an investment of relatively poor return and can either save the capital or channel it into a much higher IRR (internal rate of return) investment. I have seen tangible customer improvements exceeding 30+ percent improvement to congested cells, avoiding substantial RAN Capex and resulting Opex. And the beauty is that it does not involve third-party network vendors and can be up and running within weeks with an investment that is easily paid back within a few months. Opanga’s product pipeline is tailor-made to alleviate telecom’s biggest and thorniest challenges. Their latest product, with the appropriate name Joules, enables substantial radio access network energy savings above and beyond what features the telcos have installed from their Radio Access Network suppliers. Disclosure:I am associated with Opanga as an advisor to their industrial advisory board.
I built my first Telco technology Capex model back in 1999. I had just become responsible for what then was called Fixed Network Engineering with a portfolio of all technology engineering design & planning except for the radio access network but including all transport aspects from access up to Core and out to the external world. I got a bit frustrated that every time an assumption changed (e.g., business/marketing/sales), I needed to involve many people in my organization to revise their Capex demand. People that were supposed to get our greenfield network rolled out to our customers. Thus, I built my first Capex model that would take the critical business assumptions, size my network (including the radio access network), and consistently assign the right Capex amounts to each category. The model allowed for rapid turnaround on revised business assumptions and a highly auditable track of changes, planning drivers, and unit prices. Since then, I have built best-practice Capex (and technology Opex) models for many Deutsche Telekom AGs and Ooredoo Group entities. Moreover, I have been creating numerous network and business assessment and valuation models (with an eye on M&A), focusing on technology drivers behind Capex and Opex for many different types of telco companies (30+) operating in an extensive range of market environments around the world (20+). Creating and auditing techno-economical models, making those operational and of high quality, it has (for me) been essential to be extensively involved operationally in the telecom sector.
PRELUDE TO CAPEX.
Capital investments, or Capital Expenditures, or just Capex for short, make Telcos go around. Capex is the monetary means used by your Telco to acquire, develop, upgrade, modernize, and maintain tangible, as well as, in some instances, intangible, assets and infrastructure. We can find Capex back under “Property, Plants, and Buildings” (or PPB) in a company’s balance sheet or directly in the profit & loss (or income) statement. Typically for an investment to be characterized as a capital expense, it needs to have a useful lifetime of at least 2 years and be a physical or tangible asset.
What about software? A software development asset is, by definition, intangible or non-physical. However, it can, and often is, assigned Capex status, although such an assignment requires a bit more judgment (and auditorial approvals) than for a real physical asset.
The “Modern History of Telecom” (in Europe) is well represented by Figure 1, showing the fixed-mobile total telecom Capex-to-Revenue ratio from 1996 to 2025.
From 1996 to 2012, most of the European Telco Capex-to-Revenue ratio was driven by investment into mobile technology introductions such as 2G (GSM) in 1996 and 3G (UMTS) in 2000 to 2002 as well as initial 4G (LTE) investments. It is clear that investments into fixed infrastructure, particularly modernizing and enhancing, have been down-prioritized only until recently (e.g., up to 2010+) when incumbents felt obliged to commence investing in fiber infrastructure and urgent modernization of incumbents’ fixed infrastructures in general. For a long time, the investment focus in the telecom industry was mobile networks and sweating the fixed infrastructure assets with attractive margins.
Figure 1 illustrates the “Modern History of Telecom” in Europe. It shows the historical development of Western Europe Telecom Capex to Revenue ratio trend from 1996 to 2025. The maximum was about 28% at the time 2G (GSM) was launched and at minimum after the cash crunch after ultra-expensive 3G licenses and the dot.com crash of 2020. In recent years, since 2008, Capex to Revenue has been steadily increasing as 4G was introduced and fiber deployment started picking up after 20210. It should be emphasized that the Capex to Revenue trend is for both Mobile and Fixed. It does not include frequency spectrum investments.
Across this short modern history of telecom, possibly one of the worst industry (and technology) investments have been the investments we did into 3G. In Europe alone, we invested 100+ billion Euro (i.e., not included in the Figure) into 2100 MHz spectrum licenses that were supposed to provide mobile customers “internet-in-their-pockets”. Something that was really only enabled with the introduction of 4G from 2010 onwards.
Also, from 2010 onwards, telecom companies (in Europe) started to invest increasingly in fiber deployment as well as upgrading their ailing fixed transport and switching networks focusing on enabling competitive fixed broadband services. But fiber investments have picked up in a significant way in the overall telecom Capex, and I suspect it will remain so for the foreseeable future.
Figure 2 When we take the European Telco revenue (mobile & fixed) over the period 1996 to 2025, it is clear that the mobile business model quantum leaped revenue from its inception to around 2008. After this, it has been in steady decline, even if improvement has been observed in the fixed part of the telco business due to the transition from voice-dominated to broadband. Source:https://stats.oecd.org/
As can be observed from Figure 1, since the telecom credit crunch between 2000 and 2003, the Capex share of revenue has steadily increased from just around 12% in 2004, right after the credit crunch, to almost 20% in 2021. Over the period from 2008 to 2021, the industry’s total revenue has steadily declined, as can be seen in Figure 2. Taking the last 10 years (2011-2021) of mobile and fixed revenue data has, on average, reduced by 4+ billion euros a year. The cumulative annual growth rate (CAGR) was at a great +6% from the inception of 2G services in 1996 to 2008, the year of the “great recession.” From 2008 until 2021, the CAGR has been almost -2% in annual revenue loss for Western Europe.
What does that mean for the absolute total Capex spend over the same period? Figure 3 provides the trend of mobile and fixed Capex spending over the period. Since the “happy days” of 2G and 3G Capex spending, Capex rapidly declined after the industry spent 100+ billion Euro on 3G spectrum alone (i.e., 800+ million euros per MHz or 4+ euros per MHz-pop) before the required multi-billion Euro in 3G infrastructure. Though, after 2009, which was the lowest Capex spend after the 3G licenses were acquired, the telecom industry has steadily grown its annual total Capex spend with ca. +1 billion Euro per year (up to 2021) financing new technology introductions (4G and 5G), substantial mobile radio and core modernizations (a big refresh ca. every 6 -7 years), increasing capacity to continuously cope with consumer demand for broadband, fixed transport, and core infrastructure modernization, and last but not least (since the last ~ 8 years) increasing focus on fiber deployment. Over the same period from 2009 to 2021, the total revenue has declined by ca. 5 billion euros per year in Western Europe.
Figure 3 Using the above “Total Capex to Revenue” (Figure 1) and “Total Revenue” (Figure 2) allows us to estimate the absolute “Total Capex” over the same period. Apart from the big Capex swing around the introduction of 2G and 3G and the sharp drop during the “credit crunch” (2000 – 2003), Capex has grown steadily whilst the industry revenue has declined.
It will be very interesting to see how the next 10 years will develop for the telecom industry and its capital investment. There is still a lot to be done on 5G deployment. In fact, many Telcos are just getting started with what they would characterize as “real 5G”, which is 5G standalone at mid-band frequencies (e.g., > 3 GHz for Europe, 2.5 GHz for the USA), modernizing antenna structures from standard passive (low-order) to active antenna systems with higher-order MiMo antennas, possible mmWave deployments, and of course, quantum leap fiber deployment in laggard countries in Europe (e.g., Germany, UK, Greece, Netherlands, … ). Around 2028 to 2030, it would be surprising if the telecoms industry would not commence aggressively selling the consumer the next G. That is 6G.
At this moment, the next 3 to 5 years of Capital spending are being planned out with the aim of having the 2024 budgets approved by November or December. In principle, the long-term plans, that is, until 2027/2028, have agreed on general principles. Though, with the current financial recession brewing. Such plans would likely be scrutinized as well.
I have, over the last year since I published this article, been asked whether I had any data on Ebitda over the period for Western Europe. I have spent considerable time researching this, and the below chart provides my best shot at such a view for the Telecom industry in Western Europe from the early days of mobile until today. This, however, should be taken with much more caution than the above Caex and Revenues, as individual Telco’ s have changed substantially over the period both in their organizational structure and how results have been represented in their annual reports.
Figure 4 illustrates the historical development of the EBITDA margin over the period from 1995 to 2022 and a projection of the possible trends from 2023 onwards. Caution: telcos’ corporate and financial structures (including reporting and associated transparency into details) have substantially changed over the period. The early first 10+ years are more uncertain concerning margin than the later years. Directionally it is representative of the European Telco industry. Take Deutsche Telekom AG, it “lost” 25% of its revenue between 2005 and 2015 (considering only German & European segments). Over the same period, it shredded almost 27% of its Opex.
CAVEATS
Of course, Capex to Revenue ratios, any techno-economical ratio you may define, or cost distributions of any sort are in no way the whole story of a Telco life-and-budget cycle. Over time, due to possible structural changes in how Telcos operate, the past may not reflect the present and may even be less telling in the future.
Telcos may have merged with other Telcos (e.g., Mobile with Fixed), they may have non-Telco subsidiaries (i.e., IT consultancies, management consultancies, …), they may have integrated their fixed and mobile business units, they may have spun off their infrastructure, making use of towercos for their cell site needs (e.g., GD Towers, Vantage, Cellnex, American Towers …), open fibercos (e.g., Fiberhost Poland, Open Dutch Fiber, …) for their fiber needs, hyperscale cloud providers (e.g., AWS, Amazon, Microsoft Azure, ..) for their platform requirements. Capex and Opex will go left and right, up and down, depending on each of the above operational elements. All that may make comparing one Telco’s Capex with another Telco’s investment level and operational state-of-affairs somewhat uncertain.
I have dear colleagues who may be much more brutal. In general, they are not wrong but not as brutally right as their often high grounds could indicate. But then again, I am not a black-and-white guy … I like colors.
So, I believe that investment levels, or more generally, cost levels, can be meaningfully compared between Telcos. Cost, be it Opex or Capex, can be estimated or modeled with relatively high accuracy, assuming you are in the know. It can be compared with other comparables or non-comparables. Though not by your average financial controller with no technology knowledge and in-depth understanding.
Alas, with so many things in this world, you must understand what you are doing, including the limitations.
IT’S THAT TIME OF THE YEAR … CAPEX IS IN THE AIR.
It is the time of the year when many telcos are busy updating their business and financial planning for the following years. It is not uncommon to plan for 3 to 5 years ahead. It involves scenario planning and stress tests of those scenarios. Scenarios would include expectations of how the relevant market will evolve as well as the impact of the political and economic environment (e.g., covid lockdowns, the war in Ukraine, inflationary pressures, supply-chain challenges, … ) and possible changes to their asset ownership (e.g., infrastructure spin-offs).
Typically, between the end of the third or beginning of the fourth quarter, telecommunications businesses would have converged upon a plan for the coming years, and work will focus on in-depth budget planning for the year to come, thus 2024. This is important for the operational part of the business, as work orders and purchase orders for the first quarter of the following year would need to be issued within the current year.
The planning process can be sophisticated, involving many parts of the organization considering many scenarios, and being almost mathematical in its planning nature. It can be relatively simple with the business’s top-down financial targets to adhere to. In most instances, it’s likely a combination of both. Of course, if you are a publicly-traded company or part of one, your past planning will generally limit how much your new planning can change from the old. That is unless you improve upon your old plans or have no choice but to disappoint investors and shareholders (typically, though, one can always work on a good story). In general, businesses tend to be cautiously optimistic about uncertain business drivers (e.g., customer growth, churn, revenue, EBITDA) and conservatively pessimistic on business drivers of a more certain character (e.g., Capex, fixed cost, G&A expenses, people cost, etc..). All that without substantially and negatively changing plans too much between one planning horizon to the next.
Capital expense, Capex, is one of the foundations, or enablers, of the telco business. It finances the building, expansion, operation, and maintenance of the telco network, allowing customers to enjoy mobile services, fixed broadband services, TV services, etc., of ever-increasing quality and diversity. I like to look at Capex as the investments I need to incur in order to sustain my existing revenues, grow my revenues (preferably beating inflationary pressures), and finance any efficiency activities that will reduce my operational expenses in the future.
If we want to make the value of Capex to the corporation a little firmer, we need a little bit of financial calculus. We can write a company’s value (CV) as
With g being the expected growth rate in free cash flow in perpetuity, WACC is the Weighted Average Cost of Capital, and FCFF is the Free Cash Flow to the Firm (i.e., company) that we can write as follows;
FCFF = NOPLAT + Depreciation & Amortization (DA) – ∆ Working Capital – Capex,
with NOPLAT being the Net Operating Profit Less Adjusted Taxes (i.e., EBIT – Cash Taxes). So if I have two different Capex budgets with everything else staying the same despite the difference in Capex (if true life would be so easy, right?);
assuming that everything except the proposed Capex remains the same. With a difference of, for example, 10 Million euros, a future growth rate g = 0% (maybe conservative), and a WACC of 5% (note: you can find the latest average WACC data for the industry here, which is updated regularly by New York University Leonard N. Stern School of Business. The 5% chosen here serves as an illustration only (e.g., this was approximately representative of Telco Europe back in 2022, as of July 2023, it was slightly above 6%). You should always choose the weighted average cost of capital that is applicable to your context). The above formula would tell us that the investment plan having 10 Million euros less would be 200 Million euros more valuable (20× the Capex not spent). Anyone with a bit of (hands-on!) experience in budget business planning would know that the above valuation logic should be taken with a mountain of salt. If you have two Capex plans with no positive difference in business or financial value, you should choose the plan with less Capex (and don’t count yourself rich on what you did not do). Of course, some topics may require Capex without obvious benefits to the top or bottom line. Such examples are easy to find, e.g., regulatory requirements or geo-political risks force investments that may appear valueless or even value destructive. Those require meticulous considerations, and timing may often play a role in optimizing your investment strategy around such topics. In some cases, management will create a narrative around a corporate investment decision that fits an optimized valuation, typically hedging on one-sided inflated risks to the business if not done. Whatever decision is made, it is good to remember that Capex, and resulting Opex, is in most cases a certainty. The business benefits in terms of more revenue or more customers are uncertain as is assuming your business will be worth more in a number of years if your antennas are yellow and not green. One may call this the “Faith-based case of more Capex.”
Figure 5 provides an overview of Western Europe of annual Fixed & Mobile Capex, Total and Service Revenues, and Capex to Revenue ratio (in %). Source: New Street Research Western Europe data.
Figure 5 provides an overview of Western European telcos’ revenue, Capex, and Capex to Revenue ratio. Over the last five years, Western European telcos have been spending increasingly higher Capex levels. In 2021 the telecom Capex was 6 billion euros higher than what was spent in 2017, about 13% higher. Fixed and mobile service revenue increased by 14 billion euros, yielding a Capex to Service revenue ratio of 23% in 2021 compared to 20.6% in 2017. In most cases, the total revenue would be reported, and if luck has its way (or you are a subscriber to New Street Research), the total Capex. Thus, capturing both the mobile and the fixed business, including any non-service-related revenues from the company. As defined in this article, non-service-related revenues would comprise revenues from wholesales, sales of equipment (e.g., mobile devices, STB, and CPEs), and other non-service-specific revenues. As a rule of thumb, the relative difference between total and service-related revenues is usually between 1.1 to 1.3 (e.g., the last 5-year average for WEU was 1.17).
One of the main drivers for the Western European Capex has firstly been aggressive fiber-to-the-premise (FTTP) deployment and household fiber connectivity, typically measured in homes passed across most of the European metropolitan footprint as well as urban areas in general. As fiber covers more and more residential households, increased subscription to fiber occurs as well. This also requires substantial additional Capex for a fixed broadband business. Figure 6 illustrates the annual FTTP (homes passed) deployment volume in Western Europe as well as the total household fiber coverage.
Figure 6 above shows the fiber to the premise (FTTP) home passed deployment per anno from 2018 to 2021 Actual (source: European Commission’s “Broadband Coverage in Europe 2021” authored by Omdia et al.) and 2021 to 2025 projected numbers (i.e., this author’s own assessment). During the period from 2018 to 2021, household fiber coverage grew from 27% to 43% and is expected to grow to at least 71% by 2026 (not including overbuilt, thus unique household covered). The overbuilt data are based on a work in progress model and really should be seen as directional (it is difficult to get data with respect to the overbuilt).
A large part of the initial deployment has been in relatively dense urban areas as well as relying on aerial fiber deployment outside bigger metropolitan centers. For example, in Portugal, with close to 90% of households covered with fiber as of 2021, the existing HFC infrastructure (duct, underground passageways, …) was a key enabler for the very fast, economical, and extensive household fiber coverage there. Although many Western European markets will be reaching or exceeding 80% of fiber coverage in their urban areas, I would expect to continue to see a substantial amount of Capex being attributed. In fact, what is often overlooked in the assessment of the Capex volume being committed to fiber deployment, is that the unit-Capex is likely to increase substantially as countries with no aerial deployment option pick up their fiber rollout pace (e.g., Germany, the UK, Netherlands) and countries with an already relatively high fiber coverage go increasingly suburban and rural.
Figure 7 above shows the total fiber to the premise (FTTP) home remaining per anno from 2018 to 2021 Actual (source: European Commission’s “Broadband Coverage in Europe 2021” authored by Omdia et al.). The 2022 to 2030 projected remaining households are based on the author’s own assessment and does not consider overbuilt numbers.
The second main driver is in the domain of mobile network investment. The 5G radio access deployment has been a major driver in 2020 and 2021. It is expected to continue to contribute significantly to mobile operators Capex in the coming 5 years. For most Western European operators, the initial 5G deployment was at 700 MHz, which provides a very good 5G coverage. However, due to limited frequency spectral bandwidth, there are not very impressive speeds unless combined with a solid pre-existing 4G network. The deployment of 5G at 700 MHz has had a fairly modest effect on Mobile Capex (apart from what operators had to pay out in the 5G spectrum auctions to acquire the spectrum in the first place). Some mobile networks would have been prepared to accommodate the 700 MHz spectrum being supported by existing lower-order or classical antenna infrastructure. In 2021 and going forward, we will see an increasing part of the mobile Capex being allocated to 3.X GHz deployment. Far more sophisticated antenna systems, which co-incidentally also are far more costly in unit-Capex terms, will be taken into use, such as higher-order MiMo antennas from 8×8 passive MiMo to 32×32 and 64×64 active antennas systems. These advanced antenna systems will be deployed widely in metropolitan and urban areas. Some operators may even deploy these costly but very-high performing antenna systems in suburban and rural clutter with the intention to provide fixed-wireless access services to areas that today and for the next 5 – 7 years continue to be under-served with respect to fixed broadband fiber services.
Overall, I would also expect mobile Capex to continue to increase above and beyond the pre-2020 level.
As an external investor with little detailed insights into individual telco operations, it can be difficult to assess whether individual businesses or the industry are investing sufficiently into their technical landscape to allow for growth and increased demand for quality. Most publicly available financial reporting does not provide (if at all) sufficient insights into how capital expenses are deployed or prioritized across the many facets of a telco’s technical infrastructure, platforms, and services. As many telcos provide mobile and fixed services based on owned or wholesaled mobile and fixed networks (or combinations there off), it has become even more challenging to ascertain the quality of individual telecom operations capital investments.
Figure 8 illustrates why analysts like to plot Total Revenue against Total Capex (for fixed and mobile). It provides an excellent correlation. Though great care should be taken not to assume causation is at work here, i.e., “if I invest X Euro more, I will have Y Euro more in revenues.” It may tell you that you need to invest a certain level of Capex in sustaining a certain level of Revenue in your market context (i.e., country geo-socio-economic context). Source: New Street Research Western Europe data covering the following countries: AT, BE, DK, FI, FR, DE, GR, IT, NL, NO, PT, ES, SE, CH, and UK.
Why bother with revenues from the telco services? These would typically drive and dominate the capital investments and, as such, should relate strongly to the Capex plans of telcos. It is customary to benchmark capital spending by comparing the Capex to Revenue (see Figure 8), indicating how much a business needs to invest into infrastructure and services to obtain a certain income level. If nothing is stated, the revenue used for the Capex-to-Revenue ratio would be total revenue. For telcos with fixed and mobile businesses, it’s a very high-level KPI that does not allow for too many insights (in my opinion). It requires some de-averaging to become more meaningful.
THE TELCO TECHNOLOGY FACTORY
Figure 8 (below) illustrates the main capital investment areas and cost drivers for telecommunications operations with either a fixed broadband network, a mobile network, or both. Typically, around 90% of the capital expenditures will be invested into the technology factory comprising network infrastructure, products, services, and all associated with information technology. The remaining ca. 10% will be spent on non-technical infrastructures, such as shops, office space, and other non-tech tangible assets.
Figure 9 Telco Capex is spent across physical (or tangible) infrastructure assets, such as communications equipment, brick & mortar that hosts the equipment, and staff. Furthermore, a considerable amount of a telcos Capex will also go to human development work, e.g., for IT, products & services, either carried out directly by own staff or third parties (i.e., capitalized labor). The above illustrates the macro-levels that make out a mobile or fixed telecommunications network, and the most important areas Capex will be allocated to.
If we take the helicopter view on a telco’s network, we have the customer’s devices, either mobile devices (e.g., smartphone, Internet of Things, tablet, … ) or fixed devices, such as the customer premise equipment (CPE) and set-top box. Typically the broadband network connection to the customer’s premise would require a media converter or optical network terminator (ONT). For a mobile network, we have a wireless connection between the customer device and the radio access network (RAN), the cellular network’s most southern point (or edge). Radio access technology (e.g., 3G, 4G, or 5G) is very important determines for the customer experience. For a fixed network connection, we have fiber or coax (cable) or copper connecting the customer’s premise and the fixed network (e.g., street cabinet). Access (in general) follows the distribution of the customers’ locations and concentration, and their generated traffic is aggregated increasingly as we move north and up towards and into the core network. In today’s modern networks, big-fat-data broadband connections interconnect with the internet and big public data centers hosting both 3rd party and operator-provided content, services, and applications that the customer base demands. In many existing networks, data centers inside the operator’s own “walls” likewise will have service and application platforms that provide customers with more of the operator’s services. Such private data centers, including what is called micro data centers (μDCs) or edge DCs, may also host 3rd party content delivery networks that enable higher quality content services to a telco’s customer base due to a higher degree of proximity to where the customers are located compared to internet-based data centers (that could be located anywhere in the world).
Figure 10 illustrates break-out the details of a mobile as well as a fixed (fiber-based) network’s infrastructure elements, including the customers’ various types of devices.
Figure 10 illustrates that on a helicopter level, a fixed and a classical mobile network structure are reasonably similar, with the main difference of one network carrying the mobile traffic and the other the fixed traffic. The traffic in the fixed network tends to be at least ten larger than in the mobile network. They mainly differ in the access node and how it connects to the customer. For fixed broadband, the physical connection is established between, for example, the ONL (Optical Line Terminal) in the optical distribution network and ONT (Optical Line Terminal) at the customer’s home via a fiber line (i.e., wired). The wireless connection for mobile is between the Radio Node’s antenna and the end-user device. Note: AAS: Advanced Antenna System (e.g., MiMo, massive-MiMo), BBU: Base-band unit, CPE: Customer Premise Equipment, IOT: Internet of Things, IX: Internet Exchange, OLT: Optical Line Termination, and ONT: Optical Network Termination (same as ONU: Optical Network Unit).
From Figure 10 above, it should be clear that there are a lot of similarities between the mobile and fixed networks, with the biggest difference being that the mobile access network establishes a wireless connection to the customer’s devices versus the fixed access network physically wired connection to the device situated at the customer’s premises.
This is good news for fixed-mobile telecommunications operators as these will have considerable architectural and, thus, investment synergies due to those similarities. Although, the sad truth is that even today, many fixed-mobile telco companies, particularly incumbent, remain far away from having achieved fixed-mobile network harmonization and conversion.
Moreover, there are many questions to be asked as well as concerns when it comes to our industry’s Capex plans; what is the Capex required to accommodate data growth, are existing budgets allowing for sufficient network densification (to accommodate growth and quality), and what is the Capex trade-off between frequency spectrum acquisition, antenna technology, and site densification, how much Capex is justified to pursue the best network in a given market, what is the suitable trade-off between investing in fiber to the home and aggressive 5G deployment, should (incumbent) telco’s pursue fixed wireless access (FWA) and how would that impact their capital plans, what is the right antenna strategy, etc…
On a high level, I will provide guidance on many of the above questions, in this article and in forthcoming ones.
THE CAPEX STRUCTURE OF A TELECOM COMPANY.
When taking a macro look at Capex and not yet having a good idea about the breakdown between mobile and fixed investment levels, we are helped that on a macro level, the Capex categories are similar for a fixed and a mobile network. Apart from the last mile (access) in a fixed network is a fixed line (e.g., fiber, coax, or copper) and a wireless connection in a mobile network; the rest is comparable in nature and function. This is not surprising as a business with a fixed-mobile infrastructure would (should!) leverage the commonalities in transport and part of the access architecture.
In the fixed business, devices required to enable services on the fixed-line network at the fixed customers’ home (e.g., CPE, STB, …) are a capital expense driven by new customers and device replacement. This is not the case for mobile devices (i.e., an operational expense).
Figure 11 above illustrates the major Capex elements and their distribution defined by the median, lower and upper quantiles (the box), and lower and upper extremes (the whiskers) of what one should expect of various elements’ contribution to telco Capex. Note: CPE: Customer Premise Equipment, STB: Set-Top Box.
CUSTOMER PREMISE EQUIPMENT (CPE) & SET-TOP BOXES (STB) investments ARE between 10% to 20% of the TelEcoM Capex.
The capital investment level into Customer premise equipment (CPE) depends on the expected growth in the fixed customer base and the replacement of old or defective CPEs already in the fixed customer base. We would generally expect this to make out between 10% to 20% of the total Capex of a fixed-mobile telco (and 0% in a mobile-only business). When migrating from one access technology (e.g., copper/xDSL phase-out, coaxial cable) to another (e.g., fiber or hybrid coaxial cable), more Capex may be required. Similar considerations for set-top boxes (STB) replacement due to, for example, a new TV platform, non-compliance with new requirements, etc. Many Western European incumbents are phasing out their extensive and aging copper networks and replacing those with fiber-based networks. At the same time, incumbents may have substantial capital requirements phasing out their legacy copper-based access networks, the capital burden on other competitor telcos in markets where this is happening if such would have a significant copper-based wholesale relationship with the incumbent.
In summary, over the next five years, we should expect an increase in CPE-based Caped due to the legacy copper phase-out of incumbent fixed telcos. This will also increase the capital pressure in transport and access categories.
CPE & STB Capex KPIs: Capex share of Total and Capex per Gross Added Customer.
Capex modeling comment: Use your customer forecast model as the driver for new CPEs. Your research should give you an idea of the price range of CPEs used by your target fixed broadband business. Always include CPE replacement in the existing base and the gross adds for the new CPEs. Many fixed broadband retail businesses have been conservative in the capabilities of CPEs they have offered to their customer base (e.g., low-end cheaper CPEs, poor WiFi quality, ≤1Gbps), and it should be considered that these may not be sufficient for customer demand in the following years. An incumbent with a large install base of xDSL customers may also have a substantial migration (to fiber) cost as CPEs are required to be replaced with fiber cable CPEs. Due to the current supply chain and delivery issues, I would assume that operators would be willing to pay a premium for getting critical stock as well as having priority delivery as stock becomes available (e.g., by more expensive shipping means).
Core network & service platformS, including data centers, investments ARE between 8% to 12% of the telecom Capex.
Core network and service platforms should not take up more than 10% of the total Capex. We would regard anything less than 5% or more than 15% as an anomaly in Capital prioritization. This said, over the next couple of years, many telcos with mobile operations will launch 5G standalone core networks, which is a substantial change to the existing core network architecture. This also raises the opportunity for lifting and shifting from monolithic systems or older cloud frameworks to cloud-native and possibly migrating certain functions onto public cloud domains from one or more hyperscalers (e.g., AWS, Azure, Google). As workloads are moved from telco-owned data centers and own monolithic core systems, telco technology cost structure may change from what prior was a substantial capital expense to an operational expense. This is particularly true for software-related developments and licensing.
Another core network & service platform Capex pressure point may come from political or investor pressure to replace Chinese network elements, often far removed from obsolescence and performance issues, with non-Chinese alternatives. This may raise the Core network Capex level for the next 3 to 5 years, possibly beyond 12%. Alas, this would be temporary.
In summary, the following topics would likely be on the Capex priority list;
1. Life-cycle management investments (I like to call Business-as-Usual demand) into software and hardware maintenance, end-of-life replacements, growth (software licenses, HW expansions), and miscellaneous topics. This area tends to dominate the Capex demand unless larger transformational projects exist. It is also the first area to be de-prioritized if required. Working with Priority 1, 2, and 3 categorizations is a good Capital planning methodology. Where Priority 1 is required within the following budget year 1, Prio. 2 is important but can wait until year two without building up too much technical debt and Prio. 3 is nice to have and not expected to be required for the next two subsequent budget years.
3. Network cloudification, initially lift-and-shift with subsequent cloud-native transformation. The trigger point will be enabling the deployment of the 5G standalone (SA) core. Operators will also take the opportunity to clean up their data centers and network core location (timeline: 24 – 36 months).
4. Although edge computing data centers (DC) typically are supposed to support the radio access network (e.g., for Open-RAN), the capital assignment would be with the core network as the expertise for this resides here. The intensity of this Capex (if built by the operator, otherwise, it would be Opex) will depend on the country’s size and fronthaul/backhaul design. The investment trigger point would generally commence on Open-RAN deployment (e.g., 1&1 & Telefonica Germany). The edge DC (or μDC) would most like be standard container-sized (or half that size) and could easily be provided by independent towerco or specific edge-DC 3rd party providers lessening the Capex required for the telco. For smaller geographies (e.g., Netherlands, Denmark, Austria, …), I would not expect this item to be a substantial topic for the Capex plans. Mainly if Open-RAN is not being pursued over the next 5 – 10 years by mainstream incumbent telcos.
5. Chinese supplier replacement. The urgency would depend on regulatory pressure, whether compensation is provided (unlikely) or not, and the obsolescence timeline of the infrastructure in question. Given the high quality at very affordable economics, I expect this not to have the biggest priority and will be executed within timelines dictated more by economics and obsolescence timelines. In any case, I expect that before 2025 most European telcos will have phased out Chinese suppliers from their Core Networks, incl. any Service platforms in use today (timeline: max. 36 months).
6. Cybersecurity investments strengthen infrastructure, processes, and vital data residing in data centers, service platforms, and core network elements. I expect a substantial increase in Capex (and Opex) arising from the telco’s focus on increasing the cyber protection of their critical telecom infrastructure (timeline: max 18 months with urgency).
Core Capex KPIs: Capex share of Total (knowing the share, it is straightforward to get the Capex per Revenue related to the Core), Capex per Incremental demanded data traffic (in Gigabits and Gigabyte per second), Capex per Total traffic, Capex per customer.
Capex modeling comment: In case I have little specific information about an operator’s core network and service platforms, I would tend to model it as a Euro per Customer, Euro per-incremental customer, and Euro per incremental traffic. Checking that I am not violating my Capex range that this category would typically fall within (e.g., 8% to 12%). I would also have to consider obsolescence investments, taking, for example, a percentage of previous cumulated core investments. As mobile operators are in the process, or soon will be, of implementing a 5G standalone core, having an idea of the number of 5G customers and their traffic would be useful to factor that in separately in this Capex category.
Estimating the possible Capex spend on Edge-RAN locations, I would consider that I need ca. 1 μDC per 450 to 700 km2 of O-RAN coverage (i.e., corresponding to a fronthaul distance between the remote radio and the baseband unit of 12 to 15 km). There may be synergies between fixed broadband access locations and the need for μ-datacenters for an O-RAN deployment for an integrated fixed-mobile telco. I suspect that 3rd party towercos, or alike, may eventually also offer this kind of site solutions, possibly sharing the cost with other mobile O-RAN operators.
Transport – core, metro & aggregation investments are between 5% to 15% of Telecom Capex.
The transport network consists of an optical transport network (OTN) connecting all infrastructure nodes via optical fiber. The optical transport network extends down to the access layer from the Core through the Metro and Aggregation layers. On top, the IP network ensures logical connection and control flow of all data transported up and downstream between the infrastructure nodes. As data traffic is carried from the edge of the network upstream, it is aggregated at one or several places in the network (and, of course, disaggregated in the downstream direction). Thus, the higher the transport network, the more bandwidth is supported on the optical and the IP layers. Most of the Capex investment needs would ensure that sufficient optical and IP capacity is available, supporting the growth projections and new service requirements from the business and that no bottlenecks can occur that may have disastrous consequences on customer experience. This mainly comes down to adding cards and ports to the already installed equipment, upgrading & replacing equipment as it reaches capacity or quality limitations, or eventually becoming obsolete. There may be software license fees associated with growth or the introduction of new services that also need to be considered.
Figure 12 above illustrates (high-level) the transport network topology with the optical transport network and IP networking on top. Apart from optical and IP network equipment, this area often includes investments into IP application functions and related hardware (e.g., BNG, DHCP, DNS, AAA RADIUS Servers, …), which have not been shown in the above. In most cases, the underlying optical fiber network would be present and sufficiently scalable, not requiring substantial Capex apart from some repair and minor extensions. Note DWDM: Dense Wavelength-Division multiplexing is an optical fiber multiplexing technology that increases the bandwidth utilization of a FON, BNG: Border Network Gateway connecting subscribers to a network or an internet service providers (ISP) network, important in wholesale arrangements where a 3rd party provides aggregation and access. DHCP: Dynamic Host Configuration Protocol providing IP address allocation and client configurations. AAA: Authentication, Authorization, and Accounting of the subscriber/user, RADIUS: Remote Authentication Dial-In User Service (Server) providing the AAA functionalities.
Although many telcos operate fixed-mobile networks and might even offer fixed-mobile converged services, they may still operate largely separate fixed and mobile networks. It is not uncommon to find very different transport design principles as well as supplier landscapes between fixed and mobile. The maturity, when each was initially built, and technology roadmaps have historically been very different. The fixed traffic dynamics and data volumes are several times higher than mobile traffic. The geographical presence between fixed and mobile tends to be very different (unless the telco of interest is the incumbent with a considerable copper or HFC network). However, the biggest reason for this state of affairs has been people and technology organizations within the telcos resisting change and much more aggressive transport consolidation, which would have been possible.
The mobile traffic could (should!) be accommodated at least from the metro/aggregation layers and upstream through the core transport. There may even be some potential for consolidation on front and backhauls that are worth considering. This would lead to supplier consolidation and organizational synergies as the technology organizations converged into a fixed-mobile engineering organization rather than two separate ones.
I would expect the share of Capex to be on the higher end of the likely range and towards the 10+% at least for the next couple of years, mainly if fixed and mobile networks are being harmonized on the transport level, which may also create an opportunity reduce and harmonize the supplier landscape.
In summary, the following topics would likely be on the Capex priority list;
Life-cycle management (business-as-usual) investments, accommodating growth including new service and quality requirements (annual business-as-usual). There are no indications that the traffic or mobile traffic growth rate over the next five years will be very different from the past. If anything, the 5-year CAGR is slightly decreasing.
Consolidating fixed and mobile transport networks (timelines: 36 to 60 months, depending on network size and geography). Some companies are already in the process of getting this done.
Chinese supplier replacement. To my knowledge, there are fewer regulatory discussions and political pressure for telcos to phase out transport infrastructure. Nevertheless, with the current geopolitical climate (and the upcoming US election in 2024), telcos need to consider this topic very carefully; despite economic (less competition, higher cost), quality, and possible innovation, consequences may result in a departure from such suppliers. It would be a natural consideration in case of modernization needs. An accelerated phase-out may be justified to remove future risks arising from geopolitical pressures.
While I have chosen not to include the Access transport under this category, it is not uncommon to see its budget demand assigned to this category, as the transport side of access (fronthaul and backhaul transport) technically is very synergetic with the transport considerations in aggregation, metro, and core.
Transport Capex KPIs: Capex share of Total, the amount of Capex allocated to Mobile-only and Fixed-only (and, of course, to a harmonized/converged evolved transport network), The Utilization level (if data is available or modeled to this level). The amount of Capex-spend on fiber deployment, active and passive optical transport, and IP.
Capex modeling comment: I would see whether any information is available on a number of core data centers, aggregation, and metro locations. If this information is available, it is possible to get an impression of both core, aggregation, and metro transport networks. If this information is not available, I would assume a sensible transport topology given the particularities of the country where the operator resides, considering whether the operator is an incumbent fixed operator with mobile, a mobile-only operation, or a mobile operator that later has added fixed broadband to its product portfolio. If we are not talking about a greenfield operation, most, if not all, will already be in place, and mainly obsolescence, incremental traffic, and possible transport network extensions would incur Capex. It is important to understand whether fixed-mobile operations have harmonized and integrated their transport infrastructure or large-run those independently of each other. There is substantial Capex synergy in operating an integrated transport network, although it will take time and Capex to get to that integration point.
Access investments are typically between 35% to 50% of the Telecom Capex.
Figure 13 (above) is similar to Figure 8 (above), emphasizing the access part of Fixed and Mobile networks. I have extended the mobile access topology to capture newer development of Open-RAN and fronthaul requirements with pooling (“centralizing”) the baseband (BBU) resources in an edge cloud (e.g., container-sized computing center). Fronthaul & Open-RAN poses requirements to the access transport network. It can be relatively costly to transform a legacy RAN backhaul-only based topology to an Open-RAN fronthaul-based topology. Open-RAN and fronthaul topologies for Greenfield deployments are more flexible and at least require less Capex and Opex.
Mobile Access Capex.
I will define mobile access (or radio access network, RAN) as everything from the antenna on the site location that supports the customers’ usage (or traffic demand) via the active radio equipment (on-site or residing in an edge-cloud datacenter), through the fronthaul and backhaul transport, up to the point before aggregation (i.e., pre-aggregation). It includes passive and active infrastructure on-site, steal & mortar or storage container, front- and backhaul transport, data center software & equipment (that may be required in an edge data center), and any other hardware or software required to have a functional mobile service on whatever G being sold by the mobile operator.
Figure 14 above illustrates a radio access network architecture that is typically deployed by an incumbent telco supporting up to 4G and 5G. A greenfield operation on 5G (and maybe 4G) could (maybe should?) choose to disaggregate the radio access node using an open interface, allowing for a supplier mix between the remote radio head (RRH and digital frontend) at the site location and the centralized (or distributed) baseband unit (BBU). Fronthaul connects the antenna and RRH with a remote BBU that is situated at an edge-cloud data center (e.g., storage container datacenter unit = micro-data center, μDC). Due to latency constraints, the distance between the remote site and the BBU should not be much more than 10 km. It is customary to name the 5G new radio node a gNB (g-Node-B) like the 4G radio node is named eNB (evolved-Node-B).
When considering the mobile access network, it is good to keep in mind that, at the moment, there are at least two main flavors (that can be mixed, of course) to consider. (1) A classical architecture with the site’s radio access hardware and software from a single supplier, with a remote radio head (RRH) as well as digital frontend processing at or near the antenna. The radio nodes do not allow for mixing suppliers between the remote RF and the baseband. Radio nodes are connected to backhaul transmission that may be enabled by fiber or microwave radios. This option is simple and very well-proven. However, it comes with supplier lock-in and possibly less efficient use of baseband resources as these are likewise fixed to the radio node that the baseband unit is installed. (2) A new Open- or disaggregated radio access network (O-RAN), with the Antenna and RHH at the site location (the RU, radio unit in O-RAN), then connected via fronthaul (≤ 10 – 20 km distance) to a μDC that contains the baseband unit (the DU, distributed unit in O-RAN). The μDC would then be connected to the backhaul that connects northbound to the Central Unit (CU), aggregation, and core. The open interface between the RRH (and digital frontend) and the BBU allows different suppliers and hosts the RAN-specific software on common off-the-shelf (COTS) computing equipment. It allows (in theory) for better scaling and efficiency with the baseband resources. However, the framework has not been standardized by the usual bodies of standardization (e.g., 3GPP) and is not universally accepted as a common standard that all telco suppliers would adhere to. It also has not reached maturity yet (sort of obvious) and is currently (as of July 2022) seen to be associated with substantial cyber-security risks (re: maturity). It may be an interesting deployment model for greenfield operations (e.g., Rakuten Mobile Japan, Jio India, 1&1 Germany, Dish Mobile USA). The O-RAN options are depicted in Figure 15 below.
Figure 15 The above illustrates a generic Open RAN architecture starting with the Advanced Antenna System (AAS) and the Radio Unit (RU). The RU contains the functionality associated with the (OSI model) layer 1, partitioned into the lower layer 1 functions with the upper layer 1 functions possibly moved out of the RU and into the Distributed Unit (DU) connected via the fronthaul transport. The DU, which typically will be connected to several RUs, must ensure proper data link management, traffic control, addressing, and reliable communication with the RU (i.e., layer 2 functionalities). The distributed unit connects via the mid-haul transport link to the so-called Central Unit (CU), which typically will be connected to several DUs. The CU plays an important role in the overall ORAN architecture, acting as a central control and management vehicle that coordinates the operations of DUs and RUs, ensuring an efficient and effective operation of the ORAN network. As may be obvious, from the summary of its functionality, layer 3 functionalities reside in the CU. The Central Unit connects via backhaul, aggregation, and core transport to the core network.
For established incumbent mobile operators, I do not see Option (2) as very attractive, at least for the next 5 – 7 years when many legacy technologies (i.e., non-5G) remain to be supported. The main concern should be the maturity, lack of industry-wise standardization, as well as cost of transforming existing access transport networks into compliance with a fronthaul framework. Most likely, some incumbents, the “brave” ones, will deploy O-RAN for 1 or a few 5G bands and keep their legacy networks as is. Most incumbent mobile operators will choose (actually have chosen already) conventional suppliers and the classical topology option to provide their 5G radio access network as it has the highest synergy with the access infrastructure already deployed. Thus, if my assertion is correct, O-RAN will only start becoming mass-market mainstream in 5 to 7 years, when existing deployments become obsolete, and may ultimately become mass-market viable by the introduction of 6G towards the end of the twenties. The verdict is very much still out there, in my opinion.
Planning the mobile-radio access networks Capex requirements is not (that) difficult. Most of it can be mathematically derived and be easily assessed against growth expectations, expected (or targeted) network utilization (or efficiency), and quality. The growth expectations (should) come from consumer and retail businesses’ forecast of mobile customers over the next 3 to 5 years, their expected usage (if they care, otherwise technology should), or data-plan distribution (maybe including technology distributions, if they care. Otherwise, technology should), as well as the desired level of quality (usually the best).
Figure 16 above illustrates a typical cellular planning structural hierarchy from the sector perspective. One site typically has 3 sectors. One sector can have multiple cells depending on the frequency bands installed in the (multi-band) antennas. Massive MiMo antenna systems provide target cellular beams toward the user’s device that extend the range of coverage (via the beam). Very fast scheduling will enable beams to be switched/cycled to other users in the covered sector (a bit oversimplified). Typically, the sector is planned according to the cell utilization, thus on a frequency-by-frequency basis.
Figure 17 illustrates that most investment drivers can be approached as statistical distributions. Those distributions will tell us how much investment is required to ensure that a critical parameter X remains below a pre-defined critical limit Xc within a given probability (i.e., the proportion of the distribution exceeding Xc). The planning approach will typically establish a reference distribution based on actual data. Then based on marketing forecasts, the planners will evolve the reference based on the expected future usage that drives the planning parameter. Example: Let X be the customer’s average speed in a radio cell (e.g., in a given sector of an antenna site) in the busy hour. The business (including technology) has decided it will target 98% of its cells and should provide better than 10 Mbps for more than 50% of the active time a customer uses a given cell. Typically, we will have several quality-based KPIs, and the more breached they are, the more likely it will be that a Capex action is initiated to improve the customer experience.
Network planners will have access to much information down to the cell level (i.e., the active frequency band in a given sector). This helps them develop solid planning and statistical models that provide confidence in the extrapolation of the critical planning parameters as demand changes (typically increases) that subsequently drive the need for expansions, parameter adjustments, and other optimization requirements. As shown in Figure 17 above, it is customary to allow for some cells to breach a defined critical limit Xc, usually though it is kept low to ensure a given customer experience level. Examples of planning parameters could be cell (and sector) utilization in the busy hour, active concurrent users in cell (or sector), duration users spend at a or lower deemed poor speed level in a given cell, physical resource block (the famous PRB, try to ask what it stands for & what it means😉) utilization, etc.
The following topics would likely be on the Capex priority list;
New radio access deployment Capex. This may be for building new sites for coverage, typically in newly built residential areas, and due to capacity requirements where existing sites can no longer support the demand in a given area. Furthermore, this Capex also covers a new technology deployment such as 5G or deploying a new frequency band requiring a new antenna solution like 3.X GHz would do. As independent tower infrastructure companies (towerco) increasingly are used to providing the required passive site infrastructure solution (e.g., location, concrete, or steel masts/towers/poles), this part will not be a Capex item but be charged as Opex back to the mobile operator. From a European mobile radio access network Capex perspective, the average cost of a total site solution, with active as well as passive infrastructure, should have been reduced by ca. 100 thousand plus Euro, which may translate into a monthly Opex charge of 800 to 1300 Euro per site solution. It should be noted that while many operators have spun off their passive site solutions to third parties and thus effectively reduced their site-related Capex, the cost of antennas has increased dramatically as operators have moved away from classical simple SiSo (Single-in Singe-out) passive antennas to much more advanced antenna systems supporting multiple frequency bands, higher-order antennas (e.g., MiMo) and recently also started deploying active antennas (i.e., integrated amplifiers). This is largely also driven by mobile operators commissioning more and more frequency bands on their radio-access sites. The planning horizon needs at least to be 2 years and preferably 3 to 5 years.
Capex investments that accommodate anticipated radio access growth and increased quality requirements. It is normal to be between 18 – 24 months ahead of the present capacity demand overall, accepting no more than 2% to 5% of cells (in BH) to breach a critical specification limit. Several such critical limits would be used for longer-term planning and operational day-to-day monitoring.
Life-cycle management (business-as-usual) investments such as software annual fees, including licenses that are typically structured around the technologies deployed (e.g., 2G, 3G, 4G, and 5G) and active infrastructure modernization replacing radio access equipment (e.g., baseband units, radio units, antennas, …) that have become obsolete. Site reworks or construction optimization would typically be executed (on request from the operator) by the Towerco entity, where the mobile operator leases the passive site infrastructure. Thus, in such instances may not be a Capex item but charged back as an Operational expense to the telco.
Even if there have been fewer regulatory discussions and political pressure for telcos to phase out radio access, Chinese supplier replacement should be considered. Nevertheless, with the current geopolitical climate (and the upcoming US election), telcos need to consider this topic very carefully; despite economic (less competition, higher cost), quality, and possible innovation, consequences may result in a departure from such suppliers. It would be a natural consideration in case of modernization needs. An accelerated phase-out may be justified to remove future risks arising from geopolitical pressures, although it would result in above-and-beyond capital commitment over a shorter period than otherwise would be the case. Telco valuation may suffer more in the short to medium term than otherwise would have been the case with a more natural phaseout due to obsolescence.
Mobile Access Capex KPIs: Capex share of Total, Access Utilization (reported/planned data traffic demand to the data traffic that could be supplied if all or part of the spectrum was activated), Capex per Site location, Capex per Incremental data traffic demand (in Gigabyte and Gigabit per second which is the real investment driver), Capex per Total Traffic (in Gigabyte and Gigabit per second), Capex per Mobile Customer and Capex to Mobile Revenue (preferably service revenue but the total is fine if the other is not available). As a rule of thumb, 50% of a mobile network typically covers rural areas, which also may carry less than 20% of the total data traffic.
Whether actual and planned Capex is available or an analyst is modeling it, the above KPIs should be followed over an extended period. A single year does not tell much of a story.
Capex modeling comment: When modeling the Capex required for the radio access network, you need to have an idea about how many sites your target telco has. There are many ways to get to that number. In most European countries, it is a matter of public record. Most telcos, nowadays, rarely build their own passive site infrastructure but get that from independent third-party tower companies (e.g., CellNex w. ca. 75k locations, Vantage Towers w. ca. 82k locations, … ) or site-share on another operators site locations if available. So, modeling the RAN Capex is a matter of having a benchmark of the active equipment, knowing what active equipment is most likely to be deployed and how much. I see this as being an iterative modeling process. Given the number of sites and historical Capex, it is possible to come to a reasonable estimate of both volumes of sites being changed and the range of unit Capex (given good guestimates of active equipment pricing range). Of course, in case you are doing a Capex review, the data should be available to you, and the exercise should be straightforward. The mobile Capex KPIs above will allow for consistency checks of a modeling exercise or guide a Capex review process.
I recommend using the classical topology described above when building a radio access model. That is unless you have information that the telco under analysis is transforming to a disaggregated topology with both fronthaul and backhaul. Remember you are not only required to capture the Capex for what is associated with the site location but also what is spent on the access transport. Otherwise, there is a chance that you over-estimate the unit-Capex for the site-related investments.
It is also worth keeping in mind that typically, the first place a telecom company would cut Capex (or down-prioritize) is pressured during the planning process would be in the radio access network category. The reason is that the site-related unitary capex tends to be incredibly well-defined. If you reduce your rollout to 100 site-related units, you should have a very well-defined quantum of Capex that can be allocated to another category. Also, the operational impact of cutting in this category tends to be very well-defined. Depending on how well planned the overall Capex has been done, there typically would be a slack of 5% to 10% overall that could be re-assigned or ultimately reduced if financial results warrant such a move.
Fixed Access Capex.
As mobile access, fixed access is about getting your service out to your customers. Or, if you are a wholesale provider, you can provide the means of your wholesale customer reaching their customer by providing your own fixed access transport infrastructure. Fixed access is about connecting the home, the office, the public institution (e.g., school), or whatever type of dwelling in general.
Figure 18 illustrates a fixed access network and its position in the overall telco architecture. The following make up the ODN (Optical Distribution Network); OLT: Optical Line Termination, ODF: Optical Distribution Frame, POS: Passive Optical Splitter, ONT: Optical Network Termination. At the customer premise, besides the ONT, we have the CPE: Customer Premise Equipment and the STB: Set-Top Box. Suppose you are an operator that bought wholesale fixed access from another telco’ (incl. Open Access Providers, OAPs). In that case, you may require a BNG to establish the connection with your customer’s CPE and STB through the wholesale access network.
As fiber optical access networks are being deployed across Europe, this tends to be a substantial Capex item on the budgets of telcos. Here we have two main Capex drivers. First is the Capex for deploying fibers across urban areas, which provides coverage for households (or dwellings) and is measured as Capex-per-homes passed. Second is the Capex required for establishing the connection to households (or dwellings). The method of fiber deployment is either buried, possibly using existing ducts or underground passageways, or via aerial deployment using established poles (e.g., power poles or street furniture poles) or new poles deployed with the fiber deployment. Aerial deployment tends to incur lower Capex than buried fiber solutions due to requiring less civil work. The OLT, ODF, POS, and optical fiber planning, design, and build to provide home coverage depends on the home-passed deployment ambition. The fiber to connect a home (i.e., civil work and materials), ONT, CPE, and STBs are driven by homes connected (or FTTH connected). Typically, CPE and STBs are not included in the Access Capex but should be accounted for as a separate business-driven Capex item.
The network solutions (BNG, OLT, Routers, Switches, …) outside the customer’s dwelling come in the form of a cabinet and appropriate cards to populate the cabinet. The cards provide the capacity and serviced speed (e.g., 100 Mbps, 300 Mbps, 1 Gbps, 10 Gbps, …) sold to the fixed broadband customer. Moreover, for some of the deployed solutions, there is likely a mandatory software (incl. features) fee and possibly both optional and custom-specific features (although rare to see that in mainstream deployments). It should be clear (but you would be surprised) that ONT and CPE should support the provisioned speed of the fixed access network. The customer cannot get more quality than the minimum level of either the ONT, CPE, or what the ODN has been built to deliver. In other words, if the networking cards have been deployed only to support up to 1 Gbps and your ONT, and CPE may support 3 Gbps or more, your customer will not be able to have a service beyond 1 Gbps. Of course, the other way around as well. I cannot stress enough the importance of longer-term planning in this respect. Your network should be as flexible as possible in providing customer services. It may seem that Capex savings can be made by only deploying capacity sold today or may be required by business over the next 12 months. While taking a 3 to 5-year view on the deployed network capacity and ONT/CPEs provided to customers avoids having to rip out relatively new equipment or finance the significant replacement of obsolete customer premise equipment that no longer can support the services required.
When we look at the economic drivers for fixed access, we can look at the capital cost of deploying a kilometer of fiber. This is particularly interesting if we are only interested in the fiber deployment itself and nothing else. Depending on the type of clutter, deployment, and labor cost occur. Maybe it is more interesting to bundle your investment into what is required to pass a household and what is required to connect a household (after it has been passed). Thus, we look at the Capex-per-home (or dwellings) passed and separate the Capex to connect an individual customer’s premise. It is important to realize that these Capex drivers are not just a single value but will depend on the household density depends on the type of area the deployment happens. We generally expect dense urban clutters to have a high dwelling density; thus, more households are covered (or passed) per km of fiber deployed. Dense-urban areas, however, may not necessarily hold the highest density of potential residential customers and hold less retail interest in the retail business. Generally, urban areas have higher household densities (including residential households) than sub-urban clutter. Rural areas are expected to have the lowest density and, thus, the most costly (on a household basis) to deploy.
Figure 19, just below, illustrates the basic economics of buried (as opposed to aerial) fiber for FTTH homes passed and FTTH homes connected. Apart from showing the intuitive economic logic, the cost per home passed or connected is driven by the household density (note: it’s one driver and fairly important but does not capture all the factors). This may serve as a base for rough assessments of the cost of fiber deployment in homes passed and homes connected as a function of household density. I have used data in the Fiber-to-the-Home Council Europe report of July 2012 (10 years old), “The Cost of Meeting Europe’s Network Needs”, and have corrected for the European inflationary price increase since 2012 of ca. 14% and raised that to 20% to account for increased demand for FTTH related work by third parties. Then I checked this against some data points known to me (which do not coincide with the cities quoted in the chart). These data points relate to buried fiber, including the homes connected cost chart. Aerial fiber deployment (including home connected) would cost less than depicted here. Of course, some care should be taken in generalizing this to actual projects where proper knowledge of the local circumstances is preferred to the above.
Figure 19 The “chicken and egg” of connecting customers’ premises with fiber and providing them with 100s of Mbps up to Gbps broadband quality is that the fibers need to pass the home first before the home can be connected. The cost of passing a premise (i.e., the home passed) and connecting a premise (home connected) should, for planning purposes, be split up. The cost of rolling out fiber to get homes-passed coverage is not surprisingly particularly sensitive to household density. We will have more households per unit area in urban areas compared to rural areas. Connecting a home is more sensitive to household density in deep rural areas where the distance from the main fiber line connection point to the household may be longer. The above cost curves are for buried fiber lines and are in 2021 prices.
Aerial fiber deployment would generally be less capital-intensive due to faster and easier deployment (less civil work, including permitting) using pre-existing (or newly built) poles. Not every country allows aerial deployment or even has the infrastructure (i.e., poles) available, which may be medium and low-voltage poles (e.g., for last-mile access). Some countries will have a policy allowing only buried fibers in the city or metropolitan areas and supporting pole infrastructure for aerial deployment in sub-urban and rural clutters. I have tried to illustrate this with Figure 18 below, where the pie charts show the aerial potential and share that may have to be assigned to buried fiber deployment.
Figure 20 above illustrates the amount of fiber coverage (i.e., in terms of homes passed) in Western European markets. The number for 2015 and 2021 is based on European Commission’s “Broadband Coverage in Europe 2021” (authored by Omdia et al.). The 2025 & 2031 coverage numbers are my extrapolation of the 5-year trend leading up to 2021, considering the potential for aerial versus buried deployment. Aerial making accelerated deployment gains is more likely than in markets that only have buried fiber as a possibility, either because of regulation or lack of appropriate infrastructure for aerials. The only country that may be below 50% FTTH coverage in 2025 is Germany (i.e., DE), with a projected 39% of homes passed by 2025. Should Germany aim for 50% instead, they would have to do ca. 15 million households passed or, on average, 3 million a year from 2021 to 2025. Maximum Germany achieved in one year was in 2020, with ca. 1.4 million homes passed (i.e., Covid was good for getting “things done”). In 2021 this number dropped to ca. 700 thousand or half of the 2020 number. The maximum any country in Europe has done in one year was France, with 2.9 million homes passed in 2018. However, France does allow for aerial fiber deployment outside major metropolitan areas.
Figure 21 above provides an overview across Western Europe for the last 5 years (2016 – 2021) of average annual household fiber deployment, the maximum done in one year in the previous 5 years, and the average required to achieve household coverage in 2026 shown above in Figure 20. For Germany (DE), the average deployment pace of 3.23 homes passed per year (orange bar) would then result in a coverage estimate of 25%. I don’t see any practical reasons for the UK, France, and Italy not to make the estimated household coverage by 2026, which may exceed my estimates.
From a deployment pace and Capex perspective, it is good to keep in mind that as time goes by, the deployment cost per household is likely to increase as household density reduces when the deployment moves from metropolitan areas toward suburban and rural. Thus, even if the deployment pace may reduce naturally for many countries in Figure 20 towards 2025, absolute Capex may not necessarily reduce accordingly.
In summary, the following topics would likely be on the Capex priority list;
Continued fiber deployment to achieve household coverage. Based on Figure 17, at household (HH) densities above 500 per km2, the unit Capex for buried fiber should be below 900 Euro per HH passed with an average of 600 Euro per HH passed. Below 500 HH per km2, the cost increases rapidly towards 3,000 Euro per HH passed. The aerial deployment will result in substantially lower Capex, maybe with as much as 50% lower unit Capex.
As customers subscribe, the fiber access cost associated with connecting homes (last-mile connectivity) will need to be considered. Figure 17 provides some guidance regarding the quantum-Euro range expected for buried fiber. Aerial-based connections may be somewhat cheaper.
Life-cycle management (business-as-usual) investments, modernization investments, accommodating growth including new service and quality requirements (annual business as usual). Typically it would be upgrading OLT, ONTs, routers, and switches to support higher bandwidth requirements upgrading line cards (or interface cards), and moving from ≤100 Mbps to 1 Gbps and 10 Gbps. Many telcos will be considering upgrading their GPON (Gigabit Passive Optical Networks, 2.5 Gbps↓ / 1.2 Gbps↑) to provide XGPON (10 Gbps↓ / 2.5 Gbps↑) or even XGSPON services (10 Gbps↓ / 10 Gbps↑).
Chinese supplier exposure and risks (i.e., political and regulatory enforcement) may be an issue in some Western European markets and require accelerated phase-out capital needs. In general, I don’t see fixed access infrastructure being a priority in this respect, given the strong focus on increasing household fiber coverage, which already takes up a lot of human and financial resources. However, this topic needs to be considered in case of obsolescence and thus would be a business case and performance-driven with a risk adjustment in dealing with Chinese suppliers at that point in time.
Fixed Access Capex KPIs: Capex share of Total, Capex per km, Number of HH passed and connected, Capex per HH passed, Capex per HH connected, Capex to Incremental Traffic, GPON, XGPON and XGSPON share of Capex and Households connected.
Whether actual and planned Capex is available or an analyst is modeling it, the above KPIs should be followed over an extended period. A single year does not tell much of a story.
Capex modeling comment: In a modeling exercise, I would use estimates for the telco’s household coverage plans as well as the expected household-connected sales projections. Hopefully, historical numbers would be available to the analyst that can be used to estimate the unit-Capex for a household passed and a household connected. You need to have an idea of where the telco is in terms of household density, and thus as time goes by, you may assume that the cost of deployment per household increases somewhat. For example, use Figure 18 to guide the scaling curve you need. The above-fixed access Capex KPIs should allow checking for inconsistencies in your model or, if you are reviewing a Capex plan, whether that Capex plan is self-consistent with the data provided.
If anyone would have doubted it, there is still much to do with fiber optical deployment in Western Europe. We still have around 100+ million homes to pass and a likely capital investment need of 100+ billion euros. Fiber deployment will remain a tremendously important investment area for the foreseeable future.
Figure 22 shows the remaining fiber coverage in homes passed based on 2021 actuals for urban and rural areas. In general, it is expected that once urban areas’ coverage has reached 80% to 90%, the further coverage-based rollout will reduce. Though, for attractive urban areas, overbuilt, that is, deploying fiber where there already are fibers deployed, is likely to continue.
Figure 23 The top illustrates the next 5 years’ weekly rollout to reach an 80% to 90% household coverage range by 2025. The bottom, it shows an estimate of the remaining capital investment required to reach that 80% to 90% coverage range. This assessment is based on 2021 actuals from the European Commission’s “Broadband Coverage in Europe 2021” (authored by Omdia et al.); the weekly activity and Capex levels are thus from 2022 onwards.
In many Western European countries, the pace is expected to be increased considerably compared to the previous 5 years (i.e., 2016 – 2021). Even if the above figure may be over-optimistic, with respect to the goal of 2026, the European ambition for fiberizing European markets will impose a lot of pressure on speedy deployment.
IT investment levels are typically between 15% and 25% of Telecom Capex.
IT may be the most complex area to reach a consensus on concerning Capex. In my experience, it is also the area within a telco with the highest and most emotional discussion overhead within the operations and at a Board level. Just like everyone is far better at driving a car than the average driver, everyone is far better at IT than the IT experts and knows exactly what is wrong with IT and how to make IT much better and much faster, and much cheaper (if there ever was an area in telco-land where there are too many cooks).
Why is that the case? I tend to say that IT is much more “touchy-feely” than networks where most of the Capex can be estimated almost mathematically (and sufficiently complicated for non-technology folks to not bother with it too much … btw I tend to disagree with this from a system or architecture perspective). Of course, that is also not the whole truth.
IT designs, plans, develops (or builds), and operates all the business support systems that enable the business to sell to its customers, support its customers, and in general, keep the relationship with the customer throughout the customer life-cycle across all the products and services offered by the business irrespective of it being fixed or mobile or converged. IT has much more intense interactions with the business than any other technology department, whose purpose is to support the business in enabling its requirements.
Most of the IT Capex is related to people’s work, such as development, maintenance, and operations. Thus capitalized labor of external and internal labor is the main driver for IT Capex. The work relates to maintaining and improving existing services and products and developing new ones on the IT system landscape or IT stacks. In 2021, Western European telco Capex spending was about 20% of their total revenue. Out of that, 4±1 % or in the order of 10±3 billion Euro is spent on IT. With ca. 714 million fixed and mobile subscribers, this corresponds to an IT average spend of 14 Euros per telco customer in 2021. Best investment practices should aim at an IT Capex spend at or below 3% of revenue on average over 5 years (to avoid penalizing IT transformation programs). As a rule of thumb, if you do not have any details of internal cost structure (I bet you usually would not have that information), assume that the IT-related Opex has a similar quantum as Capex (you may compensate for GDP differences between markets). Thus, the total IT spend (Capex and Opex) would be in the order of 2×Capex, so the IT Spend to Revenue double the IT-related Capex to Revenue. While these considerations would give you an idea of the IT investment level and drill down a bit further into cost structure details, it is wise to keep in mind that it’s all a macro average, and the spread can be pretty significant. For example, two telcos with roughly the same number of customers, IT landscape, and complexity and have pretty different revenue levels (e.g., due to differences in ARPU that can be achieved in the particular market) may have comparable absolute IT spending levels but very different relative levels compared to the revenue. I also know of telcos with very low total IT spend to Revenue ITR (shareholder imposed), which had (and have) a horrid IT infrastructure performance with very extended outages (days) on billing and frequent instabilities all over its IT systems. Whatever might have been saved by imposing a dramatic reduction in the IT Capex (e.g., remember 10 million euros Capex reduction equivalent to 200 million euros value enhancement) was more than lost on inferior customer service and experience (including the inability to bill the customers).
You will find industry experts and pundits that expertly insist that your IT development spend is way too high or too low (although the latter is rare!). I recommend respectfully taking such banter seriously. Although try to understand what they are comparing with, what KPIs they are using, and whether it’s apples for apples and not with pineapples. In my experience, I would expect a mobile-only business to have a better IT spend level than a fixed-mobile telco, as a mobile IT landscape tends to be more modern and relatively simple compared to a fixed IT landscape. First, we often find more legacy (and I mean with a capital L) in the fixed IT landscape with much older services and products still being kept operational. The fixed IT landscape is highly customized, making transformation and modernization complex and costly. At least if old and older legacy products must remain operational. Another false friend in comparing one company IT spending with another’s is that the cost structure may be different. For example, it is worth understanding where OSS (Operational Support System) development is accounted for. Is it in the IT spend, or is it in the Network-side of things? Service platforms and Data Centers may be another difference where such spending may be with IT or Networks.
Figure 24 shows the helicopter view of a traditional telco IT architectural stack. Unless the telco is a true greenfield, it is a very normal state of affairs to have multiple co-existing stacks, which may have some degree of integration at various levels (sub-layers). Most fixed-mobile telcos remain with a high degree of IT architecture separation between their mobile and fixed business on a retail and B2B level. When approaching IT, investments never consider just one year. Understand their IT investment strategy in the immediate past (2-3 years prior) as well as how that fits with known and immediate future investments (2 – 3 years out).
Above, Figure 24 illustrates the typical layers and sub-layers in an IT stack. Every sub-layer may contain different applications, functionalities, and systems, all with an over-arching property of the sub-layer description. It is not uncommon for a telco to have multiple IT stacks serving different brands (e.g., value, premium, …) and products (e.g., mobile, fixed, converged) and business lines (e.g., consumer/retail, business-to-business, wholesale, …). Some layers may be consolidated across stacks, and others may be more fragmented. The most common division is between fixed and mobile product categories, as historically, the IT business support systems (BSS) as well as the operational support systems (OSS) were segregated and might even have been managed by two different IT departments (that kind of silliness is more historical albeit recent).
Figure 25 shows a typical fixed-mobile incumbent (i.e., anything not greenfield) multi-stack IT architecture and their most likely aspiration of aggressive integrated stack supporting a fixed-mobile conversion business. Out of experience, I am not a big fan of retail & B2B IT stack integration. It creates a lot of operational complexity and muddies the investment transparency and economics of particular B2B at the expense of the retail business.
A typical IT landscape supporting fixed and mobile services may have quite a few IT stacks and a wide range of solutions for various products and services. It is not uncommon that a Fixed-Mobile telco would have several mobile brands (e.g., premium, value, …) and a separate (from an IT architecture perspective, at least) fixed brand. Then in addition, there may be differences between the retail (business-to-consumer, B2C) and the business-to-business (B2B) side of the telco, also being supported by separate stacks or different partitions of a stack. This is illustrated in Figure 24 above. In order for the telco business to become more efficient with respect to its IT landscape, including development, maintenance, and operational aspects of managing a complex IT infrastructure landscape, it should strive to consolidate stacks where it makes sense and not un-importantly along the business wish of convergence at least between fixed and mobile.
Figure 24 above illustrates an example of an IT stack harmonization activity long retail brands as well as Fixed and Mobile products as well as a separation of stacks into a retail and a business-to-business stack. It is, of course, possible to leverage some of the business logic and product synergies between B2C and B2B by harmonizing IT stacks across both business domains. However, in my experience, nothing great comes out of that, and more likely than not, you will penalize B2C by spending above and beyond value & investment attention on B2B. The B2B requirements tend to be significantly more complex to implement, their specifications change frequently (in line with their business customers’ demand), and the unit cost of development returns less unit revenue than the consumer part. Economically and from a value-consideration perspective, the telco needs to find an IT stack solution that is more in line with what B2B contributes to the valuation and fits its requirements. That may be a big challenge, particularly for minor players, as its business rarely justifies a standalone IT stack or developments. At least not a stack that is developed and maintained at the same high-quality level as a consumer stack. There is simply a mismatch in the B2B requirements, often having much higher quality and functionality requirements than the consumer part, and what it contributes to the business compared to, for example, B2C.
When I judge IT Capex, I care less about the absolute level of spend (within reason, of course) than what is practical to support within the given IT landscape the organization has been dealt with and, of course, the organization itself, including 3rd party support. Most systems will have development constraints and a natural order of how development can be executed. It will not matter how much money you are given or how many resources you throw at some problems; there will be an optimum amount of resources and time required to complete a task. This naturally leads to prioritization which may lead to disappointment of some stakeholders and projects that may not be prioritized to the degree they might feel entitled to.
When looking at IT capital spending and comparing one telco with another, it is worthwhile to take a 3- to 5-year time horizon, as telcos may be in different business and transformation cycles. A one-year comparison or benchmark may not be appropriate for understanding a given IT-spend journey and its operational and strategic rationale. Search for incidents (frequency and severity) that may indicate inappropriate spend prioritization or overall too little available IT budget.
The IT Capex budget would typically be split into (a) Consumer or retail part (i.e., B2C), (b) Business to Business and wholesale part, (c) IT technical part (optimization, modernization, cloudification, and transformations in general), and a (d) General and Administrative (G&A) part (e.g., Finance, HR, ..). Many IT-related projects, particularly of transformative nature, will run over multiple years (although if much more than 24 months, the risk of failure and monetary waste increases rapidly) and should be planned accordingly. For the business-driven demand (from the consumer, business, and wholesale), it makes sense to assign Capex proportional to the segment’s revenue and the customers those segments support and leverage any synergies in the development work required by the business units. For IT, capital spending should be assigned, ensuring that technical debt is manageable across the IT infrastructure and landscape and that efficiency gains arising from transformative projects (including landscape modernization) are delivered timely. In general, such IT projects promise efficiency in terms of more agile development possibilities (faster time to market), lower development and operational costs, and, last but not least, improved quality in terms of stability and reduced incidents. The G&A prioritizes finance projects and then HR and other corporate projects.
In summary, the following topics would likely be on the Capex priority list;
Provide IT development support for business demand in the next business plan cycle (3 – 5 years with a strong emphasis on the year ahead). The allocation key should be close to the Revenue (or Ebitda) and customer contribution expected within the budget planning period. The development focus is on maintenance, (incremental) improvements to existing products/services, and new products/services required to make the business plans. In my experience, the initial demand tends to be 2 to 3 times higher than what a reasonable financial envelope would dictate (i.e., even considering what is possible to do within the natural limitations of the given IT landscape and organization) and what is ultimately agreed upon.
Cloudification transformation journey moving away from the traditional monolithic IT platform and into a public, hybrid, or private cloud environment. In my opinion, the safest approach is a “lift-and-shift” approach where existing functionality is developed in the cloud environment. After a successful migration from the traditional monolithic platform into the cloud environment, the next phase of the cloudification journey will be to move to a cloud-native framework should be embarked. This provides a very solid automation framework delivering additional efficiencies and improved stability and quality (e.g., reduction in incidents). Analysts should be aware that migrating to a (public) cloud environment may reduce the capitalization possibilities with the consequence that Capex may reduce in the forward budget planning, but this would be at the expense of increased Opex for the IT organization.
Stack consolidation. Reducing the number of IT stacks generally lowers the IT Capex demand and improves development efficiency, stability, and quality. The trend is to focus on the harmonization efforts on the frontend (Portals and Outlets layer in Figure 14), the CRM layer (retiring legacy or older CRM solutions), and moving down the layers of the IT stack (see Figure 14) often touching the complex backend systems when they become obsolete providing an opportunity to migrate to a modern cloud-based solution (e.g., cloud billing).
Modernization activities are not covered by cloudification investments or business requirements.
Development support for Finance (e.g., ERP/SAP requirements), HR requirements, and other miscellaneous activities not captured above.
Chinese suppliers are rarely an issue in Western European telecom’s IT landscape. However, if present in a telco’s IT environment, I would expect Capex has been allocated for phasing out that supplier urgently over the next 24 months (pending the complexity of such a transformation/migration program) due to strong political and regulatory pressures. Such an initiative may have a value-destructing impact as business-driven IT development (related to the specific system) might not be prioritized too highly during such a program and thus result in less ability to compete for the telco during a phase-out program.
IT Capex KPIs: IT share of Total Capex (if available, broken down into a Fixed and Mobile part),IT Capex to Revenue, ITR (IT total spend to Revenue), IT Capex per Customer, IT Capex per Employee, IT FTEs to Total FTEs.
Moreover, if available or being modeled, I would like to have an idea about how much of the IT Capex goes to investment categories such as (i) Maintain, (ii) Growth, and (iii) Transform. I will get worried if the majority of IT Capex over an extended period goes to the Growth category and little to Maintain and Transform. This indicates a telco that has deprioritized quality and ignores efficiency, resulting in the risk of value destruction over time (if such a trend were sustained). A telco with little Transform spend (again over an extended period) is a business that does not modernize (another word for sweating assets).
Capex modeling comment: when I am modeling IT and have little information available, I would first assume an IT Capex to Revenue ratio around 4% (mobile-only) to 6% (fixed-mobile operation) and check as I develop the other telco Capex components whether the IT Capex stays within 15% to 25%. Of course, keep an eye out for all the above IT Capex KPIs, as they provide a more holistic picture of how much confidence you can have in the Capex model.
Figure 26 illustrates the anticipated IT Capex to Revenue ranges for 2024: using New Street Research (total) Capex data for Western Europe, the author’s own Capex projection modeling, and using the heuristics that IT spend typically would be 15% to 25% of the total Capex, we can estimate the most likely ranges of IT Capex to Revenue for the telecommunications business covered by NSR for 2024. For individual operations, we may also want to look at the time series of IT spending to revenue and compare that to any available intelligence (e.g., transformation intensive, M&A integration, business-as-usual, etc..)
Using the heuristic of the IT Capex being between 15% (1st quantile) and 25% (3rd quantile) of the total Capex, we can get an impression of how much individual Telcos invest in IT annually. The above chart shows such an estimate for 2024. I have the historical IT spending levels for several Western European Telcos, which agree well with the above and would typically be a bit below the median unless a Telco is in the progress of a major IT transformation (e.g., after a merger, structural separation, Huawei forced replacement, etc..). One would also expect and should check that the total IT spend, Capex and Opex, are decreasing over time when the transformational IT spend has been removed. If this is observed, it would indicate that Telco does become increasingly more efficient in its IT operation. Usually, the biggest effect should be in IT Opex reduction over time.
Figure 27 illustrates the anticipated IT Capex to Customer ranges for 2024: having estimated the likely IT spend ranges (in Figure 26) for various Western European telcos, allows us to estimate the expected 2024 IT spend per customer (using New Street Research data, author’s own Capex projection model and the IT heuristics describe in the section). In general and in the absence of structural IT transformation programs, I would expect the IT per customer spend to be below the median. Some notes to the above results: TDC (Nuuday & TDC Net) has major IT transformation programs ongoing after the structural separation, KPN is in progress with replacing their Huawei BSS, and I would expect them to be at the upper part of IT spending, Telenor Norway seems higher than I would expect but is an incumbent that traditionally spends substantially more than its competitors so might be okay but caution should be taken here, Switzerland in general and Swisscom, in particular, is higher than I would have expected. This said, it is a sophisticated Telco services market that would be likely to spend above the European average, irrespective I would take some caution with the above representation for Switzerland & Swisscom.
Similar to the IT Capex to Revenue, we can get an impression of what Telcos spend on IT Capex as it relates to their total mobile and fixed customer base. Again for Telcos in Western Europe (as well as outside), these ranges shown above do seem reasonable as the estimated range of where one would expect the IT spend. The analyst is always encouraged to look at this over a 3- to 5-year period to better appreciate the trend and should keep in mind that not all Telcos are in synch with their IT investments (as hopefully is obvious as transformation strategies and business cycles may be very different even within the same market).
Other, or miscellaneous, investments tend to be between 3% and 8% of the Telecom Capex.
When modeling a telco’s Capex, I find it very helpful to keep an “Other” or “Miscellaneous” Capex category for anything non-technology related. Modeling-wise, having a placeholder for items you don’t know about or may have forgotten is convenient. I typically start my models with 15% of all Capex. As my model matures, I should be able to reduce this to below 10% and preferably down to 5% (but I will accept 8% as a kind of good enough limit). I have had Capx review assignments where the Capex for future years had close to 20% in the “Miscellaneous.” If this “unspecified” Capex would not be included, the Capex to Revenue in the later years would drop substantially to a level that might not be deemed credible. In my experience, every planned Capex category will have a bit of “Other”-ness included as many smaller things require Capex but are difficult to mathematically derive a measure for. I tend to leave it if it is below 5% of a given Capex category. However, if it is substantial (>5%), it may reveal “sandbagging” or simply less maturity in the Capex planning and budget process.
Apart from a placeholder for stuff we don’t know, you will typically find Capex for shop refurbishment or modernization here, including office improvements and IT investments.
DE-AVERAGING THE TELECOM CAPEX TO FIXED AND MOBILE CONTRIBUTIONS.
There are similar heuristics to go deeper down into where the Capex should be spent, but that is a detail for another time.
Our first step is decomposing the total Capex into a fixed and a mobile component. We find that a multi-linear model including Total Capex, Mobile Customers, Mobile Service Revenue, Fixed Customers, and Fixed Service Revenues can account for 93% of the Capex trend. The multi-linear regression formula looks like the following;
with C = Capex, N = total customer count, R = service revenue, and α and β are the regression coefficient estimates from the multi-linear regression. The Capex model has been trained on 80% of the data (1,008 data points) chosen randomly and validated on the remainder (252 data points). All regression coefficients (4 in total) are statistically significant, with p-values well below a 95% confidence level.
Figure 28 above shows the Predicted Capex versus the Actual Capex. It illustrates that the predicted model agreed reasonably well with the actual Capex, which would also be expected based on the statistical KPIs resulting from the fit.
The Total is (obviously) available to us and therefore allows us to estimate both fixed and mobile Capex levels, by
The result of the fixed-mobile Capex decomposition is shown in Figure 26 below. Apart from being (reasonably) statistically sound, it is comforting that the trend in Capex for fixed and mobile seem to agree with what our intuition should be. The increase in mobile Capex (for Western Europe) over the last 5 years appears reasonable, given that 5G deployment commenced in early 2019. During the Covid lockdown from early 2020, fixed revenue was boosted by a massive shift in fixed broadband traffic (and voice) from the office to the individuals’ homes. Likewise, mobile service revenues have been in slow decline for years. Thus, the Capex increase due to 5G and reduced mobile service revenues ultimately leads to a relatively more significant increase in the mobile Capex to Revenue ratio.
Figure 29 illustrates the statistical modeling (by multi-linear regression), or decomposition, of the Total Capex as a function of Mobile Customers, Mobile Service Revenues, Fixed Customers, and Fixed Service Revenues, allowing to break up of the Capex into Fixed and Mobile components by decomposing the total Capex. The absolute Capex level is higher for fixed than what is found for mobile, with about a factor of 2 until 2021, when mobile Capex increases due to 5G investments in the mobile industry. It is found that the Mobile Capex has increased the most over the last 5 years (e.g., 5G deployment) while the service revenues have declined somewhat over the same period. This increased the Mobile Capex to Service Revenue ratio (note: based on Total Revenue, the ratio would be somewhat smaller, by ca. 17%). Source: Total Capex, Fixed, and Mobile Service revenues from New Street Research data for Western Europe. Note: The decomposition of the total Capex into Fixed and Mobile Capex is based on the author’s own statistical analysis and modeling. It is not a delivery of the New Street Research report.
CAN MOBILE-TRAFFIC GROWTH CONTINUE TO BE ACCOMMODATED CAPEX-WISE?
In my opinion, there has been much panic in our industry in the past about exhausting the cellular capacity of mobile networks and the imminent doom of our industry. A fear fueled by the exponential growth of user demand perceived inadequate spectrum amount and low spectral efficiency of the deployed cellular technologies, e.g., 3G-HSPA, classical passive single-in single-out antennas. Going back to the “hey-days” of 3G-HSPA, there was a fear that if cellular demand kept its growth rate, it would result in supply requirements going towards infinity and the required Capex likewise. So clearly an unsustainable business model for the mobile industry. Today, there is (in my opinion) no basis for such fears short or medium-term. With the increased fiberization of our society, where most homes will be connected to fiber within the next 5 – 10 years, cellular doomsday, in the sense of running out of capacity or needing infinite levels of Capex to sustain cellular demand, maybe a day never to come.
In Western Europe, the total mobile subscriber penetration was ca. 130% of the total population in 2021, with an excess of approximately 2.1+ mobile devices per subscriber. Mobile internet penetration was 76% of the total population in 2021 and is expected to reach 83% by 2025. In 2021, Europe’s average smartphone penetration rate was 77.6%, and it is projected to be around 84% by 2025. Also, by 2024±1, 50% of all connections in Western Europe are projected to be 5G connections. There are some expectations that around 2030, 6G might start being introduced in Western European markets. 2G and 3G will be increasingly phased out of the Western European mobile networks, and the spectrum will be repurposed for 4G and eventually 5G.
The above Figure 30 shows forecasted mobile users by their main mobile access technology. Source: based on the author’s forecast model relying on past technology diffusion trends for Western Europe and benchmarked against some WEU markets and other telco projections. See also 5G Standalone – European Demand & Expectations by Kim Larsen.
We may not see a complete phase-out of either older Gs, as observed in Figure 19. Due to a relatively large base of non-VOLTE (Voice-over-LTE) devices, mobile networks will have to support voice circuit-switched fallback to 2G or 3G. Furthermore, for the foreseeable future, it would be unlikely that all visiting roaming customers would have VOLTE-based devices. Furthermore, there might be legacy machine-2-machine businesses that would be prohibitively costly and complex to migrate from existing 2G or 3G networks to either LTE or 5G. All in all, ensure that 2G and 3G may remain with us for reasonably long.
Figure 31 above shows that mobile and fixed data traffic consumption is growing in totality and per-user level. On average mobile traffic grew faster than fixed from 2015 to 2021. A trend that is expected to continue with the introduction of 5G. Although the total traffic growth rate is slowing down somewhat over the period, on a per-user basis (mobile as well as fixed), the consumptive growth rate has remained stable.
Since the early days of 3G-HSPA (High-Speed Packet Access) radio access, investors and telco businesses have been worried that there would be an end to how much demand could be supported in our cellular networks. The “fear” is often triggered by seeing the exponential growth trend of total traffic or of the usage per customer (to be honest, that fear has not been made smaller by technology folks “panicking” as well).
Let us look at the numbers for 2021 as they are reported in the Cisco VNI report. The total mobile data traffic was in the order of 4 Exabytes (4 Billion gigabytes, GB), more than 5.5× the level of 2016. It is more than 600 million times the average mobile data consumption of 6.5 GB per month per customer (in 2021). Compare this with the Western European population of ca. 200 million. While big numbers, the 6.5 GB per month per customer is insignificant. Assuming that most of this volume comes from video streaming at an optimum speed of 3 – 5 Mbps (good enough for HD video stream), the 6.5 GB translates into approx. 3 – 5 hours of video streaming over a month.
The above Figure 32 Illustrates a 24-hour workday total data demand on the mobile network infrastructure. A weekend profile would be more flattish. We spend at least 12 hours in our home, ca. 7 hours at work (including school), and a maximum of 5 hours (~20%) commuting, shopping, and otherwise being away from our home or workplace. Previous studies of mobile traffic load have shown that 80% of a consumer’s mobile demand falls in 3 main radio node sites around the home and workplace. The remaining 20% tends to be much more mobile-like in the sense of being spread out over many different radio-node sites.
Daily we have an average of ca. 215 Megabytes per day (if spread equally over the month), corresponding to 6 – 10 minutes of video streaming. The average length of a YouTube was ca. 4.4 minutes. In Western Europe, consumers spend an average of 2.4 hours per day on the internet with their smartphones (having younger children, I am surprised it is not more than that). However, these 2.4 hours are not necessarily network-active in the sense of continuously demanding network resources. In fact, most consumers will be active somewhere between 8:00 to around 22:00, after which network demand reduces sharply. Thus, we have 14 hours of user busy time, and within this time, a Western European consumer would spend 2.4 hours cumulated over the day (or ca. 17% of the active time).
Figure 33 above illustrates (based on actual observed trends) how 5 million mobile users distribute across a mobile network of 5,000 sites (or radio nodes) and 15,000 sectors (typically 3 sectors = 1 site). Typically, user and traffic distributions tend to be log-norm-like with long tails. In the example above, we have in the busy hour a median value of ca. 80 users attached to a sector, with 15 being active (i.e., loading the network) in the busy hour, demanding a maximum of ca. 5 GB (per sector) or an average of ca. 330 MB per active user in the radio sector over that sector’s relevant busy hour.
Typically, 2 limits, with a high degree of inter-dependency, would allegedly hit the cellular businesses rendering profitable growth difficult at some point in the future. The first limit is a practical technology limit on how much capacity a radio access system can supply. As we will see a bit later, this will depend on the operator’s frequency spectrum position (deployed, not what might be on the shelf), the number of sites (site density), the installed antenna technology, and its effective spectral efficiency. The second (inter-dependent) limit is an economic limit. The incremental Capex that telcos would need to commit to sustaining the demand at a given quality level would become highly unprofitable, rendering further cellular business uneconomical.
From a Capex perspective, the cellular access part drives a considerable amount of the mobile investment demand. Together with the supporting transport, such as fronthaul, backhaul, aggregation, and core transport, the capital investment share is typically 50% or higher. This is without including the spectrum frequencies required to offer the cellular service. Such are usually acquired by local frequency spectrum auctions and amount to substantial investment levels.
In the following, the focus will be on cellular access.
The Cellular Demand.
Before discussing the cellular supply side of things, let us first explore the demand side from the view of a helicopter. Demand is created by users (N) of the cellular services offered by telcos. Users can be human or non-human such as things in general or more specific machines. Each user has a particular demand that, in an aggregated way, can be represented by the average demand in Bytes per User (d). Thus, we can then identify two growth drivers. One from adding new users (ΔN) to our cellular network and another from the incremental change in demand per user (ΔN) as time goes by.
It should be noted that the incremental change in demand or users might not per se be a net increase. Still, it could also be a net decrease, either because the cellular networks have reached the maximum possible level of capacity (or quality) that results in users either reducing their demand or “ churning” from those networks or that an alternative to today’s commercial cellular network triggers abandonment as high-demand users migrate to that alternative — leading both to a reduction in cellular users and the average demand per user. For example, a near-100% Fiber-to-the-Home coverage with supporting WiFi could be a reason for users to abandon cellular networks, at least in an indoor environment, which would reduce between 60 to 80% of present-day cellular data demand. This last (hypothetical) is not an issue for today’s cellular networks and telco businesses.
Of course, this can easily be broken down into many more drivers and details, e.g., technology diffusion or adaptation, the rate of users moving from one access technology to another (e.g., 3G→4G, 4G→5G, 5G→FTTH+WiFi), improved network & user device capabilities (better coverage, higher speeds, lower latency, bigger display size, device chip generation), new cellular service adaptation (e.g., TV streaming, VR, AR, …), etc.…
However, what is often forgotten is that the data volume of consumptive demand (in Byte) is not the main direct driver for network demand and, thus, not for the required investment level. A gross volumetric demand can be caused by various gross throughput demands (bits per second). The throughput demanded in the busiest hour ( or ) is the direct driver of network load, and thus, network investments, the volumetric demand, is a manifestation of that throughput demand.
With being the number of active users in a given radio cell at the time-instant of unit t taken within a day. is the Bytes consumed in a time instant (e.g., typically a second); thus, 8 gives us the bits per time unit (or bits/sec), which is throughput consumed. Sum over all the cells’ instant throughput ( bits/sec) in the same instant and take the maximum across. For example, a day provides the busiest hour throughput for the whole network. Each radio cell drives its capacity provision and supply (in bits/sec) and the investments required to provide that demanded capacity in the air interface and front- and back-haul.
For example, if n = 6 active (concurrent) users, each consuming on average = 0.625 Mega Bytes per second (5 Megabits per second, Mbps), the typical requirement for a YouTube stream with an HD 1080p resolution, our radio access network in that cell would experience a demanded load of 30 Mbps (i.e., 6×5 Mbps). Of course, provided that the given cell has sufficient capacity to deliver what is demanded. A 4G cellular system, without any special antenna technology, e.g., Single-in-Single-out (SiSo) classical antenna and not the more modern Multiple-in-Multiple-out (MiMo) antenna, can be expected to deliver ca. 1.5 Mbps/MHz per cell. Thus, we would need at least 20 MHz spectrum to provide for 6 concurrent users, each demanding 5 Mbps. With a simple 2T2R MiMo antenna system, we could support about 8 simultaneous users under the same conditions. A 33% increase in what our system can handle without such an antenna. As mobile operators implement increasingly sophisticated antenna systems (i.e., higher-order MiMo systems) and move to 5G, a leapfrog in the handling capacity and quality will occur.
Figure 34 Is the sky the limit to demand? Ultimately, the limit will come from the practical and economic limits to how much can be supplied at the cellular level (e.g., spectral bandwidth, antenna technology, and software features …). Quality will reduce as the supply limit is reached, resulting in demand adaptation, hopefully settling at a demand-supply (metastable) equilibrium.
Cellular planners have many heuristics to work with that together trigger when a given radio cell would be required to be expanded to provide more capacity, which can be provided by software (licenses), hardware (expansion/replacement), civil works (sectorization/cell splits) and geographical (cell split) means. Going northbound, up from the edge of the radio network up through the transmission chain, such as fronthaul, back, aggregation, and core transport network, may require additional investments in expanding the supplied demand at a given load level.
As discussed, mobile access and transport together can easily make up more than half of a mobile capital budget’s planned and budgeted Capex.
So, to know whether the demand triggers new expansions and thus capital demand as well as the resulting operational expenses (Opex), we really need to look at the supply side. That is what our current mobile network can offer. When it cannot provide a targeted level of quality, how much capacity do we have to add to the network to be on a given level of service quality?
The Cellular Supply.
Cellular capacity in units of throughput () given in bits per second, the basic building block of quality, is relatively easy to estimate. The cellular throughput (per unit cell) is provided by the amount of committed frequency spectrum to the air interface, what your radio access network and antenna support are, multiplied by the so-called spectral efficiency in bits per Hz per cell. The spectral efficiency depends on the antenna technology and the underlying software implementation of signal processing schemes enabling the details of receiving and sending signals over the air interface.
can be written as follows;
With Mbps being megabits (a million bits) per second and MHz being Mega Herz.
For example, if we have a site that covers 3 cells (or sectors) with a deployed 100 MHz @ 3.6GHz (B) on a 32T32R advanced antenna system (AAS) with an effective downlink (i.e., from the antenna to user), spectral efficiency of ca. 20 Mbps/MHz/cell (i.e., ), we should expect to have a cell throughput on average at 1,000 Mbps (1 Gbps).
The capacity supply formula can be applied to the cell-level consideration providing sizing and thus investment guidance as we move northbound up the mobile network and traffic aggregates and concentrates towards the core and connections points to the external internet.
From the demand planning (e.g., number of customers, types of services sold, etc..), that would typically come from the Marketing and Sales department within the telco company, the technical team can translate those plans into a network demand and then calculate what they would need to do to cope with the customer demand within an agreed level of quality.
In Figure 35 above, operators provide cellular capacity by deploying their spectral assets on an appropriate antenna type and system-level radio access network hardware and software. Competition can arise from a superior spectrum position (balanced across low, medium, and high-frequency bands), better or more aggressive antenna technology, and utilizing their radio access supplier(s)’ features (e.g., signal processing schemes). Usually, the least economical option will be densifying the operator’s site grid where needed (on a macro or micro level).
Figure 36 above shows the various options available to the operator to create more capacity and quality. In terms of competitive edge, more spectrum than competitors provided it is being used and is balanced across low, medium, and high bands, provides the surest path to becoming the best network in a given market and is difficult to economically copy by operators with substantially less spectrum. Their options would be compensating for the spectrum deficit by building more sites and deploying more aggressive antenna technologies. The last one is relatively easy to follow by anyone and may only provide some respite temporarily.
An average mobile network in Western Europe has ca. 270 MHz spectrum (60 MHz low-band below 1800 and 210 MHz medium-band below 5 GHz) distributed over an average of 7 cellular frequency bands. It is rare to see all bands deployed in actual deployments and not uniformly across a complete network. The amount of spectrum deployed should match demand density; thus, more spectrum is typically deployed in urban areas than in rural ones. In demand-first-driven strategies, the frequency bands will be deployed based on actual demand that would typically not require all bands to be deployed. This is opposed to MNOs that focus on high quality, where demand is less important, and where typically, most bands would be deployed extensively across their networks. The demand-first-driven strategy tends to be the most economically efficient strategy as long as the resulting cellular quality is market-competitive and customers are sufficiently satisfied.
In terms of downlink spectral capacity, we have an average of 155 MHz or 63 MHz, excluding the C-band contribution. Overall, this allows for a downlink supply of a minimum of 40 GB per hour (assuming low effective spectral efficiency, little advanced antenna technology deployed, and not all medium-band being utilized, e.g., C-Band and 2.5 GHz). Out of the 210 MHz mid-band spectrum, 92 MHz falls in the 3.X GHz (C-band) range and is thus still very much in the process of being deployed for 5G (as of June 2022). The C-band has, on average, increased the spectral capacity of Western European telcos by 50+% and, with its very high suitability for deployment together with massive MiMo and advanced antenna systems, effectively more than doubled the total cellular capacity and quality compared to pre-C-band deployment (using a 64T64R massive MiMo as a reference with today’s effective spectral efficiency … it will be even better as time goes by).
Figure 37 (above) shows the latest Ookla and OpenSignal DL speed benchmarks for Western Europe MNOs (light blue circles), and comparing this with their spectrum holdings below 3.x GHz indicates that there may be a lot of unexploited cellular capacity and quality to be unleashed in the future. Although, it would not be for free and likely require substantial additional Capex if deemed necessary. The ‘Expected DL Mbps’ (orange solid line, *) assumes the simplest antenna setup (e.g., classical SiSo antennas) and that all bands are fully used. On average, MNOs above the benchmark line have more advanced antenna setups (higher-order antennas) and fully (or close to) spectrum deployment. MNOs below the benchmark line likely have spectrum assets that have not been fully deployed yet and (or) “under-prioritized” their antenna technology infrastructure. The DL spectrum holding excludes C- and mmWave spectrum. Note: There was a mistake in the original chart published on LinkedIn as the data was depicted against the total spectrum holding (DL+UL) and not only DL. Data: 54 Western European telcos.
Figure 37 illustrates the Western European cellular performance across MNOs, as measured by DL speed in Mbps, and compares this with the theoretical estimate of the performance they could have if all DL spectrum (not considering C-band, 3.x GHz) in their portfolio had been deployed at a fairly simple antenna setup (mainly SiSo and some 2T2R MiMo) with an effective spectral efficiency of 0.85 Mbps per MHz. It is good to point out that this is expected of 3G HSPA without MiMo. We observe that 21 telcos are above the solid (orange) line, and 33 have an actual average measured performance that is substantially below the line in many cases. Being above the line indicates that most spectrum has been deployed consistently across the network, and more advanced antennas, e.g., higher-order MiMo, are in use. Being below the line does (of course) not mean that networks are badly planned or not appropriately optimized. Not at all. Choices are always made in designing a cellular network. Often dictated by the economic reality of a given operator, geographical demand distribution, clutter particularities, or the modernization cycle an operator may be in. The most obvious reasons for why some networks are operating well under the solid line are; (1) Not all spectrum is being used everywhere (less in rural and more in urban clutter), (2) Rural configurations are simpler and thus provide less performance than urban sites. We have (in general) more traffic demand in urban areas than in rural. Unless a rural area turns seasonally touristic, e.g., lake Balaton in Hungary in the summer … It is simply a good technology planning methodology to prioritize demand in Capex planning, and it makes very good economic sense (3) Many incumbent mobile networks have a fundamental grid based on (GSM) 900MHz and later in-filled for (UMTS) 2100MHz…which typically would have less site density than networks based on (DCS) 1800MHz. However, site density differences between competing networks have been increasingly leveled out and are no longer a big issue in Western Europe (at least).
Overall, I see this as excellent news. For most mobile operators, the spectrum portfolio and the available spectrum bandwidth are not limiting factors in coping with demanded capacity and quality. Operators have many network & technology levers to work with to increase both quality and capacity for their customers. Of course, subject to a willingness to prioritize their Capex accordingly.
A mobile operator has few options to supply cellular capacity and quality demanded by its customer base.
Acquire more spectrum bandwidth by buying in an auction, buying from 3rd party (including M&A), asymmetric sharing, leasing, or trading (if regulatory permissible).
Deploy a better (spectral efficient) radio access technology, e.g., (2G, 3G) → (4G, 5G) or/and 4G → 5G, etc. Benefits will only be seen once a critical mass of customer terminal equipment supporting that new technology has been reached on the network (e.g., ≥20%).
Upgrade antenna technology infrastructure from lower-order passive antennas to higher-order active antenna systems. In the same category would be to ensure that smart, efficient signal processing schemes are being used on the air interface.
Building a denser cellular network where capacity demand dictates or coverage does not support the optimum use of higher frequency bands (e.g., 3.x GHz or higher).
Small cell deployment in areas where macro-cellular built-out is no longer possible or prohibitively costly. Though small cells scale poorly with respect to economics and maybe really the last resort.
Sectorization with higher-frequency massive-MiMo may be an alternative to small-cell and macro-cellular additions. However, sectorization requires that it is possible civil-engineering wise (e.g., construction) re: structural stability, permissible by the landlord/towerco and finally economic compared to a new site built. Adding more than the usual 3-sectors to a site would further boost site spectral efficiency as more antennas are added.
Acquiring more spectrum requires that such spectrum is available either by a regulatory offering (public auction, public beauty contest) or via alternative means such as 3rd party trading, leasing, asymmetric sharing, or by acquiring an MNO (in the market) with spectrum. In Western Europe, the average cost of spectrum is in the ballpark of 100 million Euro per 10 million population per 20 MHz low-band or 100 MHz medium bands. Within the European Union, recent auctions provide a 20-year usage-rights period before the spectrum would have to be re-auctioned. This policy is very different from, for example, in the USA, where spectrum rights are bought and ownership secured in perpetuity (sometimes conditioned on certain conditions being met). For Western Europe, apart from the mmWave spectrum, in the foreseeable future, there will not be many new spectrum acquisition opportunities in the public domain.
This leaves mobile operators with other options listed above. Re-farming spectrum away from legacy technology (e.g., 2G or 3G) in support of another more spectral efficient access technology (e.g., 4G and 5G) is possibly the most straightforward choice. In general, it is the least costly choice provided that more modern options can support the very few customers left. For either retiring 2G or 3G, operators need to be aware that as long as not all terminal equipment support Voice-over-LTE (VoLTE), they need to keep either 2G or 3G (but not both) for 4G circuit-switched fallback (to 2G or 3G) for legacy voice services. The technologist should be prepared for substantial pushback from the retail and wholesale business, as closing down a legacy technology may lead to significant churn in that legacy customer base. Although, in absolute terms, the churn exposure should be much smaller than the overall customer base. Otherwise, it will not make sense to retire the legacy technology in the first place. Suppose the spectral re-farming is towards a new technology (e.g., 5G). In that case, immediate benefits may not occur before a critical mass of capable devices is making use of the re-farmed spectrum. The Capex impact of spectral re-farming tends to be minor, with possibly some licensing costs associated with net savings from retiring the legacy. Most radio departments within mobile operators, supplier experts, and managed service providers have gained much experience in this area over the last 5 – 7 years.
Another venue that should be taken is upgrading or modernizing the radio access network with more capable antenna infrastructure, such as higher-order massive MiMo antenna systems. As has been pointed out by Prof. Emil Björnson also, the available signal processing schemes (e.g., for channel estimation, pre-coding, and combining) will be essential for the ultimate gain that can be achieved. This will result in a leapfrog increase in spectral efficiency. Thus, directly boosting air-interface capacity and the quality that the mobile customer can enjoy. If we take a 20-year period, this activity is likely to result in a capital demand in the order of 100 million euros for every 1,000 sites being modernized and assumes a modernization (or obsolescence) cycle of 7 years. In other words, within the next 20 years, a mobile operator will have undergone at least 3 antenna-system modernization cycles. It is important to emphasize that this does not (entirely) cover the likely introduction of 6G during the 20 years. Operators face two main risks in their investment strategy. One risk is that they take a short-term look at their capital investments and customer demand projections. As a result, they may invest in insufficient infrastructure solutions to meet future demands, forcing accelerated write-offs and re-investments. The second significant risk is that the operator invests too aggressively upfront in what appears to be the best solution today to find substantially better and more efficient solutions in the near future that more cautious competitive operators could deploy and achieve a substantially higher quality and investment efficiency. Given the lack of technology maturity and the very high pace of innovation in advanced antenna systems, the right timing is crucial but not straightforward.
Last and maybe least, the operator can choose to densify its cellular grid by adding one or more macro-cellular sites or adding small cells across existing macro-cellular coverage. Before it is possible to build a new site or site, the operator or the serving towerco would need to identify suitable locations and subsequently obtain a permit to establish the new site or site. In urban areas, which typically have the highest macro-site densities, getting a new permit may be very time-consuming and with a relatively high likelihood of not being granted by the municipality. Small cells may be easier to deploy in urban environments than in macro sites. For operators making use of towerco to provide the passive site infrastructure, the cost of permitting and building the site and materials (e.g., steel and concrete) is a recurring operational expense rather than a Capex charge. Of course, active equipment remains a Capex item for the relevant mobile operator.
The conclusion I make above is largely consistent with the conclusions made by New Street Research in their piece “European 5G deep-dive” (July 2021). There is plenty of unexploited spectrum with the European operators and even more opportunity to migrate to more capable antenna systems, such as massive-MiMo and active advanced antenna systems. There are also above 3GHz, other spectrum opportunities without having to think about millimeter Wave spectrum and 5G deployment in the high-frequency spectrum range.
ACKNOWLEDGEMENT.
I greatly acknowledge my wife Eva Varadi, for her support, patience, and understanding during the creative process of writing this Blog. There should be no doubt that without the support of Russell Waller (New Street Research), this blog would not have been possible. Thank you so much for providing much of the data that lays the ground for much of the Capex analysis in this article. Of course, a lot of thanks go out to my former Technology and Network Economics colleagues, who have been a source of inspiration and knowledge. I cannot get away with acknowledging Maurice Ketel (who for many years let my Technology Economics Unit in Deutsche Telekom, I respect him above and beyond), Paul Borker, David Haszeldine, Remek Prokopiak, Michael Dueser, Gudrun Bobzin, as well as many, many other industry colleagues who have contributed with valuable insights, discussions & comments throughout the years. Many thanks to Paul Zwaan for a lot of inspiration, insights, and discussions around IT Architecture.
Without executive leadership’s belief in the importance of high-quality techno-financial models, I have no doubt that I would not have been able to build up the experience I have in this field. I am forever thankful, for the trust and for making my professional life super interesting and not just a little fun, to Mads Rasmussen, Bruno Jacobfeuerborn, Hamid Akhavan, Jim Burke, Joachim Horn, and last but certainly not least, Thorsten Langheim.
FURTHER READING.
Kim Kyllesbech Larsen, “The Nature of Telecom Capex.” (July, 2022). My first article laying the ground for Capex in the Telecom industry. The data presented in this article is largely outdated and remains for comparative reasons.
Tom Copeland, Tim Koller, and Jack Murrin, “Valuation”, John Wiley & Sons, (2000). I regard this as my “bible” when it comes to understanding enterprise valuation. There are obviously many finance books on valuation (I have 10 on my bookshelf). Copeland’s book is the best imo.
Stefan Rommer, Peter Hedman, Magnus Olsson, Lars Frid, Shabnam Sultana, and Catherine Mulligan, “5G Core Networks”, Academic Press, (2020, 1st edition). Good account for what a 5G Core Network entails.
Jia Shen, Zhongda Du, Zhi Zhang, Ning Yang and Hai Tang, “5G NR and enhancements”, Elsevier (2022, 1st edition). Very good and solid account of what 5G New Radio (NR) is about and the considerations around it.
Wim Rouwet, “Open Radio Access Network (O-RAN) Systems Architecture and Design”, Academic Press, (2022). One of the best books on Open Radio Access Network architecture and design (honestly, there are not that many books on this topic yet). I like that the author, at least as an introduction makes the material reasonably accessible to even non-experts (which tbh is also badly needed).
Strand Consult, “OpenRAN and Security: A Literature Review”, (June, 2022). Excellent insights into the O-RAN maturity challenges. This report focuses on the many issues around open source software-based development that is a major part of O-RAN and some deep concerns around what that may mean for security if what should be regarded as critical infrastructure. I warmly recommend their “Debunking 25 Myths of OpenRAN”.
Hwaiyu Geng P.E., “Data Center Handbook”, Wiley (2021, 2nd edition). I have several older books on the topic that I have used for my models. This one brings the topic of data center design up to date. Also includes the topic of Cloud and Edge computing. Good part on Data Center financial analysis.
James Farmer, Brian Lane, Kevin Bourgm Weyl Wang, “FTTx Networks, Technology Implementation, and Operations”, Elsevier, (2017, 1st edition). It has some books covering FTTx deployment, GPON, and other alternative fiber technologies. I like this one in particular as it covers hands-on topics as well as basic technology foundations.
New Street Research, “European 5G deep-dive”, (July, 2021).
Prof. Emil Björnson, https://ebjornson.com/research/ and references therein. Please take a look at many of Prof. Björnson video presentations (e.g., many brilliant YouTube presentations that are fairly assessable).
Back in 2014, working at Deutsche Telekom AG and responsible for Technology Economics, we looked at alternatives to fiber deployment in Germany (and other markets). It was clear that deploying fiber in Germany would be massively costly and take a very long time… As an incumbent solely relying on xDSL, there was unease in general and in particular with observing that HFC (hybrid-fiber-coaxial) providers were gaining a lot of traction in key markets around Germany. There was an understanding that fiber would be necessary to secure the longer-term survivability of the business. Even as far back as 2011, this was clear to some visionaries within Deutsche Telekom. My interest at the time was whether fixed wireless access (FWA) solutions could be deployed faster (yes, it could and can, at least in Germany) and bridge the time until fiber was sufficiently deployed and with an economically attractive uptake that allowed an operator to retire the FWA solution or re-purpose it for normal mobile access. It economically did not make sense to deploy FWA everywhere … by far not. Though we found that in certain suburban and rural areas, it could make sense to deploy FWA solutions. … So why did it not happen? At the time, the responsible executives for fixed broadband deployment (no, no converged organization at the time) were nervous that “their” fiber Capex would be re-prioritized to FWA and thus taken away from their fiber deployment. Resulting in even further delays in fiber coverage in Germany. Also … they argued the write-off of fiber investments (e.g., 15 – 20+ years) is so much much longer compared to FWA (e.g., 5 – 7 years), and when factoring in the useful lifetime of fiber versus FWA, it made no sense to deploy it (of course ignoring that we could deploy FWA within 6 months while the fiber in that area might not be present in the next 10+ years;-).
I learned three main lessons (a lot more, actually … but that’s for my memoirs if I remember;-)
FWA can be made economically favorable but not universally so everywhere.
FWA can be a great instrument to bridge the time until fiber deployment has arrived and a given demand (uptake) in an area exists (you just need to make sure your FWA design accounts for the temporary nature of the purpose of your solutions).
FWA at high frequencies (e.g., >20 GHz) is not “just” an overlay of an MNOs existing mobile network. The design should be considered a standalone network, with maximum re-use of any existing infrastructure, with line-of-sight (LoS) to customers and LoS redundancy build-in (i.e., multiple redundant paths to a customer).
We are now 10+ years further (and Germany is still Europe’s laggard in terms of fiber deployment and will remain so for many years to come), and the technology landscape that supports both fiber and fixed wireless access is much further as well…
In the following, it is always good to keep in mind that
“Even if your something appears less economically attractive than something else, if that something else is not available or present, your solution may be an interesting opportunity to capture growth to your business. At least within a given window of opportunity.”
and, so it begins …
FIXED WIRELESS ACCESS (FWA).
In this blog, I will define Fixed Wireless Access (FWA) as a service that provides a fixed-like wireless-based internet broadband connection to a household. FWA bypasses the need for a last-mile fixed wired connection from a nearby access point (e.g., street cabinet) to a customer’s household. Thus substituting the need for a fixed copper, coax, or fiber last-mile connection. I will, in general, position FWA in a modern context of 5G, which may enable existing MNOs to bridge the time until they will have fiber coverage, for example, rural and sub-urban areas. Or, as the thinking goes (for some), completely avoid the need for costly and (allegedly) less profitable deployment of fiber in less household-dense areas where more kilometer of fiber needs to be deployed in order to reach the same amount of households compared to an urban or dense urban area. Of course, companies may also be tempted to build FWA-dedicated ISP networks operating in the mmWave range (i.e., >20 GHz) or in the so-called mid-bands range (e.g., ≥ 2.5 GH, C-band, …) to provide higher quality internet services to sub-urban and rural customers where the economics for fiber coverage and connectivity may be comparably challenged in terms of economics and time to fiber availability.
Figure 1 below provides an overview and comparison of the various ways we connect our customers’ homes, with the exception of LEO satellite and stratospheric drone-based connectivity solutions (it’s another very interesting story). So, illustrating terrestrial network-based connectivity to the household with either a fixed-line (buried or aerial) or wireless.
Figure 1 illustrates 3 different ways to connect to a household. The first (Household A) is the “normal” fixed connection, where the last mile from the street cabinet is a physical connection entering the customer’s household either via a buried connection or via a street pole (aerial connection). In the second situation (Household B), the service provider has no fixed assets readily available in a given area but has mobile radio access network infrastructure in the proximity of the household. The provider may choose to offer Fixed Mobile Substitution (FMS) using their existing mobile infrastructure and spectrum capacity to offer households fixed-like service via an in-door modem capable of receiving the radio frequencies upon which the FMS service is offered. Alternatively, and better for the mobile capacity in general (as well as providing a better customer experience), would be to offer the service with an outdoor customer premise antenna (CPA) connecting to an in-door CPE. If the FMS service is provided via a CPA, it may be called or identified as a fixed wireless access (FWA) service. In this connection scenario, cellular spectrum resources are being shared between the household FMS customers and the mobile customer base. The third connectivity scenario (Household C), is where a dedicated high-speed wireless link is established between a service provider’s remote advanced antenna system (and its associated radio access network equipment) and the household’s (typically outdoor) customer premise antenna. Both infrastructure and spectral resources will be dedicated to providing competitive (to broadband fixed alternatives) fixed-like services to customers. This is fixed-wireless access or FWA. In a modern setting service providers would offer fiber-like speeds (e.g., >100 Mbps) with dedicated mmWave 5G (SA) infrastructure. However, it is also possible to provide better-than-average mobile broadband services over a CPA and an operator’s mobile network (as it is often done with 4G or/and cellular 5G NSA).
For the wireless connection between the service provider’s access network and the household, we have several options;
(1) The Fixed Wireless Access (FWA) network provides a dedicated wireless link between the service provider’s network and the customer’s home. In order to maximize the customer experience, typically, an outdoor customer premise antenna (CPA) would have to be installed on the exterior of a household, offering line-of-sight with the provider’s own advanced antenna residing on its access network infrastructure. The provider will likely dedicate a sufficient amount of wireless spectrum bandwidth (in MHz) to provide a competitive (to fixed) broadband service. In a 5G SA (standalone) setting, this could be a cellular spectrum in the mid-band range (≥ 2.5 – 10 GHz) or (or and) mmWave spectrum above 20 GHz. An access network providing fixed-wireless services in the mid-band spectrum typically would overlay an existing mobile network (if the provider is also an MNO) with possibly site additions allowing for higher-availability services to households as well as increase the scale and potential of connecting households due to increased LoS likelihood. In case the services rely on mmWave frequency bands, I would in general, expect a dedicated network infrastructure would have to be built to provide sufficient household scale, reliability, and availability to households in the covered broadband service area. This may (also) rely on existing mobile network infrastructure if the provider is an established MNO, or it may be completely standalone. My rule of thumb is that for every household that is subscribing to the FWA service, I need at least 2, preferably 3, individual line-of-sight solutions to the household CPA. Most conventional cellular network designs (99+% of all there are out in the wild) cannot offer that kind of coverage solution.
The customer premise antenna (CPA) connects to the household’s customer premise equipment (CPE). The CPE provides WiFi coverage within the household either as a single unit or as part of a meshed WiFi household network.
(2) A service that is based on Fixed Mobile Substitution (FMS) utilizes existing cellular resources, such as infrastructure and spectrum bandwidth, to provide a service to a cellular-based (e.g., 4G/5G) customer premise equipment (CPE) residing inside a customer’s household. The CPE connects to the mobile network (via 4G and/or 5G ) and enjoys the quality of the provider’s mobile network. Inside the household, the CPE offers WiFi coverage that is utilized by the household’s occupants. As existing mobile resources are shared with regular mobile customers that may also be in the same household as the FMS solution itself, the service provider needs to carefully balance capacity and quality between the two customer segments, with the household one typically being the greedy one (with respect to network resources and service plans) and impacting network resources substantially more than the regular mobile user (e.g., usually 20+ to 1).
Figure 2 summarizes various connection possibilities there are to connect a household to the internet as well as media content such as linear and streaming TV.
FWA has been around the telco and ISP toolbox for many years in one form or another. The older (or let’s put it nicer, the experienced) reader will remember that a decade ago, many of us believed that WiMax (Worldwide Interoperability for Microwave Access) was the big thing to solve all the ailing (& failings) of 3G, maybe even becoming our industry’s de facto 4G standard. WiMax promised up to 1 Gbps for a fixed (wireless) access base station and up to around 100 Mbps at low mobility (i.e., <50 km per hour). As we know today, it should not be.
FAST FORWARD TO TODAY & TOMORROW WITH 5G AND FIBER SERVICES.
GSMA (GSM Association, the mobile interest group) has been fairly bullish on the advantages and opportunities of 5G-based Fixed Wireless Access (5G-FWA). Alleging a significant momentum behind FWA with (1) 74+ broadband service providers launching FWA services globally, (2) Expecting 40 million 5G FWA subscribers by 2025. Note globally, as of October 2022, there were 5.5 billion unique mobile subscribers. So 5G FWA amounts to <1% of unique subscribers, and last but not least (3) They expect up to 80% cost saving versus fiber to the home (FTTH) @ 100 Mbps downlink. GSMA lists more advantages according with GSMA but the 3 here are maybe the most important.
According to GSMA, in Western Europe, they expect roughly around 275+ million people will subscribe to 5G by 2025. This number represents ca. 140 million unique 5G households. Applying household scaling between western Europe and Global on the global total of 40 million 5G FWA HH, one should expect to capture between 4 to 5 million 5G FWA households or ca. 2.5% FWA HH penetration in Western Europe by 2025 (see below for details of this estimate). This FWA number also corresponds to a ca. 4% of all unique 5G households, or ca. 2% of all unique 5G subscribers, or ca. 1% of all unique mobile subscribers (in 2025). While 40 million (5 million) globally (in Western Europe) sounds like a large number, it is, to all effects rather minuscule and underwhelming compared to the total mobile and fixed broadband market.
The GSMA report, “The 5G FWA opportunity: series highlights” (from July 2022) also provides a 2025 projection for 5G FWA connections as a percentage of households across various countries. In Figure 3 below, find the GSMA projections with, as a comparison, the estimated fiber-to-the-home connections (FTTH) in 2025 and, for reference, the actual FTTH connections in 2021. It seems compelling to assume that 5G FWA would be an alternative to fiber at home or an HFC D3.1 (D = Docsis) connection. Of course, it is only possible to get a service if the technology of choice covers the household. A fiber connection to your household requires that there is a fiber passing in the proximity of your household. Thus the degree of fiber coverage is important in order to assess the fiber subscription uptake possible. Likewise, a 5G FWA connection requires that the household is within a very good and high-quality 5G coverage of the FWA provider (or the underlying network operator). Figure 4 below provides an overview of 2021 actual and 2026 (projected) fiber-based household coverage (i.e., homes passed) percentages in Western Europe.
Figure 3 above shows GSMA 2025 projections of 5G FWA household (HH) connections vs. actual FTTH connections in 2021 and the author’s forecast of FTTH connections by 2025. In countries where the is no 5G-FWA data means, according to GSMA that the expectations are below 1% of HH connected. The total Western Europe 5G FWA connection figure is in excess of 10+ million HH versus 4 – 5 million that was assessed based on the global number of 5G FWA and unique mobile households. In most Western European markets, 5G FWA as defined in the GSMA study, will be a niche service. Note: the FTTH connected percentages are based on total households in the country instead of homes passed figures. Markets that have reached 80% of HHs are capped at that level. In all cases, it would be possible to go beyond. Sources: GSMA for 5G FWA and OECD statistics database.Figure 4 fiber coverage measured as a percentage of households passed across Western Europe. 2016 and 2021 are actual data based on European Commission’s “Broadband Coverage in Europe 2021” (authored by Omdia et al.). The 2026 & 2031 figures are the author’s own forecast based on the last 5 years maximum FTTP/B deployment speed. I have imposed a 95% Household coverage ceiling in my deployment model. The pie charts illustrate the degree the fiber deployment can make use of aerial infrastructure vis-a-vis buried requirements.
If we take a look at 5G coverage, which may be an enabler for FWA services that can compete with fiber quality, it would be fairly okay to assume that most mobile operators in Western Europe would have close to a full 5G population (and households) coverage. However, accessing the 5G quality of that coverage would be problematic. 5G coverage may be based on 700 MHz piggybacking on LTE (i.e., non-standalone, NSA 5G), providing nearly 100% household coverage, it may involve considerable mid-band (i.e., > 2.1 GHz frequency bands) 5G coverage in urban and suburban areas with varying degree of rural coverage, it may also involve the deployment of mmWave (i.e., >20 GHz frequency bands) as an overlay to the normal macro cellular network or as dedicated standalone fixed-wireless access network or a combination of both.
Actually, one might also think that in geographical areas where fiber coverage, or D3.1-based HFC, is relatively limited or completely lacking, 5G FWA opportunities would be more compelling due to the lack of competing broadband alternatives. If the premise is that the 5G FWA service should be fiber-like, it would require good quality 5G coverage with speeds exceeding 100 Mbps at high availability and consistency. However, if the fixed broadband service that FWA would compete with is legacy xDSL, then some of the requirements for fiber-like quality may be relaxed (e.g., 100+ Mbps, very high availability, …).
What are the opportunities, and where? Focusing on fiber deployment in Western Europe, Figure 5 illustrates homes covered by fiber and those with no fiber coverage in urban and rural areas as of 2021 (actual). The figure below also provides a forecast of home coverage and homes missing by 2026.
Figure 5 illustrates the percentage of homes fiber covered (i.e., passed) as well as the homes where fiber coverage remains. The 2021 numbers are actual and based on data in the latest European Commission’s “Broadband Coverage in Europe 2021” (authored by Omdia et al.). The 2026 data is the author’s forecast model based on the last 5 years’ fastest fiber rollout speed. 2021 Households numbers (in a million households) are added to the 2021 charts. In general, it is expected that the number of rural households will continue to decline over the period.
As Figure 5 above shows, the urban fiber deployment in Europe is happening at a fast pace in most markets, and the opportunities for alternatives (at scale) may at the same time be seen as diminishing apart from a few laggard markets (e.g., Austria, Belgium, Germany, UK, ..). Rural opportunities for broadband alternatives (to fiber) may be viewed more optimistically with many more households only having access to aging copper lines or relative poor HFC.
A 5G FWA provider may need to think about the window of opportunity to return on the required investment. To address this question, Figure 6 below provides a projection for when at least 80% of households will be connected in urban and rural areas. Showing that in some markets, rural areas may remain more attractive for longer than the corresponding urban areas. Further, if one views the 5G FWA as a bridge to fiber availability, there may be many more opportunities for FWA than what Figures 5 and 6 allude to.
Figure 6 shows projected years until 80% of households have been covered using the maximum deployment pace of the last 5 years. The left side (a) illustrates the urban deployment and (b) the rural fiber deployment. The 80% limit is somewhat arbitrary and, particularly in urban areas, is likely to be exceeded once reached (assuming further deployment is economical). Most commercial (unsubsidized) deployment focus has been in urban areas, while rural areas are often deployed if subsidies are made available by European Union or local government.
Looking at the opportunity for fiber alternatives going forward, Figure 7 below provides the quantum of households that remain to be covered by fiber. This lack of fiber also creates opportunities for broadband alternatives, such as 5G FWA, and maybe non-terrestrial broadband solutions (e.g., Starlink, oneWeb,…). Cellular operators, with a good depth of site coverage, should be able to provide competitive alternatives to existing legacy fixed copper services, as long as LoS is not required, at least. Particularly in some rural areas, depending on the site density and spectrum commitment, around rural villages and towns. Cellular networks may not have much capacity and quality to spare in urban areas for fixed mobile substitution (FMS), at least if designed economically. This said, and depending on the cellular, and fixed broadband competitive environment, FMS-based services (4G and 5G) may be able to bridge the short time until fiber becomes available in an area. This can be used by an incumbent telco that is in the process of migrating its aging copper infrastructure to fiber or as a measure by competing cellular operators to tease copper customers away from that incumbent. Hopefully, those cellular Telcos have also thought about FMS migration off their cellular networks to a permanent fixed broadband solution, such as fiber (or a dedicated mmWave-based FWA service).
Figure 7 estimates the remaining households in (a) urban and (b) rural areas in 2023 and 2026. It may be regarded as a measure of the remaining potential for alternative (to fiber) broadband services. Note: Please note that the scale of Urban and Rural households remaining is different.
As pointed out previously, GSMA projects by 2025 ca. 5 million 5G FWA households in Western Europe. This is less than 3 out of every 100 regular households. Compared with fiber coverage of households estimated to be around 60 out of 100 by 2025. Given that some countries in Western Europe are lagging behind fiber deployment (e.g., Germany, UK, Italy, … see charts above), leaving a large part of their population without modern fixed broadband, one could expect the number might have been bigger than just a few percent. However, 5G FWA at 3.x GHz, and at mmWave frequencies require line-of-sight connections to a customer’s household to provide fiber-like quality and stability. Cellular networks were (obviously) never designed to have LoS to its customers as the cellular frequencies (≤ 3 GHz) were sufficiently low not to be “bothered” (too much) by penetration losses. At and above 3 GHz LoS is increasingly required if a fiber-like service is required.
Another aspect that is often under-appreciated or flat-out ignored (particularly by cellular-minded marketing & sales professionals), is the need for an exterior household customer premise antenna (CPA) that will allow a household to pick up the FWA signal at a higher quality (compared to a gateway antenna indoor due to penetration loss) and with minimum network interference, which may reduce overall quality and capacity in the cellular network (that coincidentally will hurt the normal cellular user as well as other FWA customers). The reason for this neglect is, in my opinion, that it is (allegedly) more difficult to sell such as product to cellular-minded customers and to cellular-minded salespeople as well. It also may increase the cost of technical support due to more complex installation procedures (compared to having a normal mobile phone or indoor gateway) than just turning on a cellular-WiFi modem box inside the home, and it may also result in higher ongoing customer service cost due to more components compared to either a cellular phone or a cellular modem.
THE ECONOMICS.
GSMA Intelligence group compared the total cost of ownership (TCO) of a dedicated 5G FWA mmWave-based connection with that of fiber-to-the-home (FTTH) for an MNO with an existing 5G network in Europe. It appears that the GSMA’s TCO model(s) are rich in detail regarding the underlying traffic models and cost drivers. Moreover, it would also appear that their TCO analysis is (at least at some level) based on an assumed kilometer-based TCO benchmark. It is unclear to me whether Opex has been considered. Though given the analysis is TCO, I assume that it is the case it was considered.
GSMA (for Europe) found that compared to fiber-based household connectivity, 5G FWA is 80% cheaper in rural areas, 60% cheaper in suburban, and 35% cheaper in urban areas compared to an FTTH deployment.
My initial thoughts, without doing any math on the GSMA results, was that I could (easily) imagine that 5G FWA would require less absolute Capex compared to deploying fiber to the home. At least for buried fiber deployment. I would be less confident wrt this result when it comes to aerial fiber deployment, but maybe it is also still a valid result. However, when considering Opex, what 5G FWA incrementally contributes, I would be much less sure that 5G FWA would be outperforming FTTH. At the least in rural and suburban areas where the household customer density per 5G FWA site would be very low (even before considering the opportunity based on LoS likelihood). Thus, the 5G FWA Opex scaled with the number of household subscribers may be a lot less favorable than FTTH, considering the access energy consumption and technical support costs alone. This is even before considering whether a normal rural and a suburban cellular network is at all suitable (designed for) for providing high availability and high-quality+ fixed-like broadband services delivered by 3.x GHz or mmWave frequencies (which in rural and suburban areas may be even more problematic on existing cellular networks).
I would generally not expect that the existing rural/suburban cellular network would be remotely adequate to permanently replace the need for fiber-connected homes. We would most likely need to densify (add new sites) to ensure high quality and high availability connectivity to customers’ premises. This typically would translate into line-of-site (LoS) requirements between the 5G FWA antenna and the customers’ households. Also, to ensure high availability, similar to a fiber connection, we should expect the need for redundant LoS connectivity to the customers’ households (note: experience has shown that having only one LoS connection compromises availability and consistency/reliability substantially). Such redundant connectivity solutions would be even more difficult to find in existing cellular networks. These considerations would, if considered, both add substantial Capex and additional Opex to the 5G FWA TCO reducing the economical (and maybe commercial) attractiveness compared to FTTH.
HOW TO MAKE APPLES AND ORANGES MORE LIKE BANANAS.
As mentioned above, GSMA appears to base (some of) its economic conclusions on a per kilometer (km) unit driver. That is Euro-per-km. While I don’t have anything particular against this driver, apart from being rather 1-dimensional, I believe it provides fewer insights than maybe others’ more direct drivers of income, capital, and operational cost as well as, in the end, a given solution’s commercial success.
I prefer to use the number of households (HH) per square kilometer, thus HH per km2. For fiber deployment and household coverage, I would use fiber per HH passed (HHP). Fiber connecting the household, providing the actual connection (“the last mile”) to customers’ home, I use fiber HH connected (HHC). The intention behind fiber coverage, what is called household passed, is to be able to connect households by extending the fiber to the “last mile” (or the last-1.61-kilometer) and start generating revenues that return on the capital investment done in the first place. Fiber coverage can be thought of as a real option to connect a home. Fiber coverage is obviously a necesity for connecting a home. Similarly, building dedicated fixed-wireless access infrastructure, incrementally on existing cellular infra or from scratch, is to provide a fixed-like high-quality wireless connection to a household.
Figure 8 The above is an illustration of fiber deployment (i.e., coverage and connection) in comparison with fixed wireless access (FWA) coverage and fixed-like wireless services rendered to households (as opposed to individual mobile devices). It also provides a bit of rationale why a km-metric may capture less of the “action” than what happens within a km2 and with the households within. The most important metric in my analysis is the number of connected homes within a km2 as they tend to pay for the party.
Thus household density is a very important driver for the commercial potential, as well as how much of the deployment capital and operational cost can be assigned to a given household in a given geographical area. Urban areas, in general, have more households than suburban and rural areas. The deployment of Capex and Opex in urban areas will be lower per household than in suburban and more rural urbanized areas.
Every household that is fiber covered, implying that the dwelling is within a short reach of the main fiber passing through and ultimately connected, requires an investment with an operational cost associated and revenue for the service is supported by the connection. Fiber total cost of ownership (TCO) will depend on the amount of households covered and the number of households directly connected to a paying customer. For the fiber deployment economics, I am using data from my “Nature of Telecom Capex” (see Figure 16, and please note that the data is for buried fiber) that provides the capital cost of fiber coverage (households passed) and for homes fiber connected, both as a function of household density. For fiber homes passed (HHP) economics, I am renormalizing to fiber homes connected (HHC). Thus if 90% of homes are covered (i.e., passed) in an area and 60% of the homes passed are connected, those connected homes pay for the remaining unconnected homes (30%) under the fiber coverage. This somewhat inflates the cost of connecting a home but is similar to the economic logic of cellular coverage, where the cost is paid by customers having access to the cellular site, even if the cellular site usually covers a lot more people than customers.
In general, fiber deployment becomes increasingly costly as the deployment moves from denser urbanized areas out to suburban and finally rural areas as the household density decreases and more area (and kilometers) need to be covered to capture the same amount of households as in urban areas. Also, it is worth keeping in mind that in countries with the possibility of substantial aerial fiber deployment (e.g., Spain, France, Portugal, Poland, etc..), this leads to a significant unit cost reduction in comparison to buried fiber deployment as we know it from Germany, Netherlands and Denmark. Figure 4 above provides an overview of Western European countries with aerial fiber deployment possibilities and those where buried fiber is required.
For an incremental FWA solution, an existing cellular site will be used. The site location will offer a coverage area where normal broadband cellular services can be provided. Households can of course be connected either via a normal mobile device or a dedicate inhourse gateway connecting to the cellular network (possibly via an exterior CPA) and offering indoor WiFi coverage. For scalable fiber-like wireless quality (e.g., stability and speed) of effective speeds exceeding 100+ Mbps per household connection to be offered from a normal cellular site we typically need line-of-site (LoS) to a customer home as well as a substantial amount of dedicated spectrum bandwidth (100+ MHz) provisioned on an advanced antenna system (AAS e.g., massive MiMo 64×64). The 5G FWA solution, I am assuming, is one that requires the receiving customer to have an outdoor antenna installed on the customer’s home with LoS to the cellular site hosting the FWA solution. The solution is assumed to cover 1 km2 (range of ca. 560 meters) with an effective speed of 300 Mbps per connection. That throughput should hold up to a given connection load limit, after which the speed is expected to decrease as additional household connections are added to the cellular site.
One of, in my opinion, the biggest assumptions (or neglects) of the fiber-like 5G FWA service to households at scale (honestly, a couple of % of HH is not worth discussing;-) is the ability to achieve a line-of-sight between the provider’s cellular site antenna and that of a household with its own customer premise antenna (CPA). For 3.x GHz services, one may assume that everything will still work nicely without LoS and with an inhouse gateway without supporting exterior CPA. I agree … with that premise … if what is required is to beat a xDSL or poor HFC service. There are certainly still many places in Western Europe where that may even make good business sense to attempt to do (that is, competing inferior fixed legacy “broadband” services). The way that cellular networks have been designed (which obviously also have to do with the relative low cellular frequency ranges of the past) is not supporting LoS at scale in urbanized environments. Some great work by professor Dr Akram Al-Hourani, summarised in Figure 9 below, clearly illustrates the difficulty in achieving LoS in urban areas. While I am of the opinion that the basic logic of urban LoS is straightforward, it seems that cellular folks tend to be so used to having (good) cellular coverage pretty much anywhere that it is forgotten when considering higher frequencies that work much better at (or only with) line-of-sight.
The lack of LoS in areas targeted for 5G FWA services needs to be considered in the economic analysis. At least if you are up against fiber-like quality and your intention is to compete at scale (some household opportunity as is the case for fiber). For your FWA cellular-based network, this would often require some degree of densification compared to the as-is cellular network that may be in place. In my work below, I have assumed that my default 5G FWA configuration and targeted service requires 6 sectors covering a 1 km2 of a given urbanized household density. The consequence of that may be that a new (greenfield) site will be required in order to provide 5G FWA at scale (>10+% of HH).
Figure 9 above illustrates the probability in an urban environment for achieving line-of-sight (LoS) between two points, separated by a horizon distance d12 and at height h1 and h2. It is worth keeping in mind that typical urban (and rural) antenna height will be in the range of 30 meter. To give context to the above LoS probability curves, a typical one and two storey will have a height less than 10 meters and 30 meters would represent probably represent 80+% of urbanized areas. The above illustration is inspired by the wonderful work of Dr Akram Al-Hourani Associate Professor and the Telecommunication Program Manager at the School of Engineering, Royal Melbourne Institute of Technology (RMIT) (see his paper “On the Probability of Line-of-Sight in Urban Environments”). There is some relatively simple Monte Carlo simulation work that can be done to verify the above LoS probability trends that I recommend doing.
The economics of this solution is straightforward. I have an upfront investment in enabling the FWA solution with a targeted quality level (e.g., ). In a first approximation and up to a predefined (and pre-agreed as sellable with Marketing), this investment is independent of the number of household customers I get. Of course, at some given load & quality conditions, the FWA capacity may have to be expanded by, for example, adding more capable antennas, more FWA (relevant) spectrum, additional sectors, or building a new site. It should be noted that I have not considered the capacity expansion part in the presented analysis in this article. Thus, as the amount of connected FWA households increases, the quality, in general, and speed, in particular, would decrease (typically by a non-linear process).
Most cellular networks have a substantial part of their infrastructure that does not generate any substantial amount of traffic. In other words, its resources are substantially under-utilized in most cellular networks. Part of building a cellular network is to ensure coverage is guaranteed to almost all of the population (98%+) and geography (>90%), irrespective of the expected demand. Some Telcos’ obsession with public speed & performance tests & benchmarks (e.g., Umlaut, Ookla, etc…) has resulted in many networks having an “insane” (un-demanded and highly un-economical) amount of capacity and quality in coverage areas without any particular customer demand. This typically leads to industry consultants proposing to use all that excess quality for what they may call FWA. I would call it FMS (but what’s in a name). Though, even if there may be a lot of excess cellular capacity and quality in rural and subs-urban areas, it’s hardly fiber-like. And it is also highly unlikely to offer the same scale opportunity in terms of households as a fiber deployment would do (hint: LoS likelihood). The opportunity that is exploitable is to compete with xDSL and poor-quality HFC (if available at all). If an area doesn’t have fiber and no good quality coax, that excess cellular capacity can be used as an alternative to xDSL.
To provide competitive fiber-like FWA services with wireless on top of an existing cellular network, we need to design it “right”. Our aim should be a speed well above 100 Mbps (e.g., 300 Mbps) with stability and availability that requires a different design principle than current legacy cellular networks. To provide a 300 Mbps wireless household connection we could start out with a bandwidth of 100 MHz at 3.5 GHz (i.e., 5G mid-band as an example). Later it is possible to upgrade to or add a mmWave solution with even more bandwidth (e.g., 20 to 300 GHz frequency range with bandwidths of multiples of GHz). In order to get both stability and availability, I will assume that I need a minimum of two but preferably three different LoS solutions for an individual household. If no fiber or other high-quality fixed broadband competitors are around, this requirement may be relaxed (although I think a minimum of two LoS connections are required to provide a real fixed broadband alternative at frequencies above 3 GHz).
SOME COMPARATIVE RESULTS.
In my economic analysis of fiber deployment and 5G-based fixed wireless access, the total cost of ownership (TCO) is presented relative to the number of households connected. This way of presenting the economics has the advantage of relating costs directly to the customer that will pay for the service.
The Capex for fiber deployment can be broken up into two parts. The first part is the fiber coverage, also called fiber household passed (HHP). The second part is household connected (HHC), connecting customer households to the main fiber pass, which is also what we like to call Fiber to the Home (FTTH).
The capital expense of fiber coverage is mainly driven by the civil work (ca. 70%, with the remainder being ca. 20% to passive and ca. 10% for the active part) and relates to the distance fiber is being laid out over (yes, there is a km driver there;-). The cost can be directly related to household density. We have an economic relationship between deployment cost and the actual household density reflecting the difference in unit deployment cost between urban (i.e., high household density, least unit Capex), suburban, and rural (i.e., low household density and highest unit Capex ) urbanized areas. You need fewer kilometers to cover a given amount of households in dense urban areas than is required in a rural village with spread-out dwellings and substantially lower household density. In my economic analysis, I re-scale the fiber coverage cost to the number of households connected (i.e., the customers). Similar to household coverage cost, the household connection cost can likewise be related to the household density, which is already a measure of the connection cost. The details have been described in details in my earlier article, “The Nature of Telecom Capex.”.
The capital expenses related to fixed wireless access will, by its very nature, have a fairly large variation in its various components making up the total investment to provide fixed-like services to customer households. It will depend critically on the design criteria of the service we would like to offer (e.g., max & min speed, availability, … ) as well as the cellular network’s starting point (e.g., greenfield vs brownfield, site density, the likelihood of customer household LoS, etc..). Furthermore, supplier choice, including existing supplier lock-in and corporate purchasing power can influence the unit Capex substantially as well. Civil works and passive infrastructure is reasonably stable across western Europe, with a minor dependency on a given country’s income levels for the civil work-related cost. In my experience, the largest capital expense variation will be on the active telecom equipment depending heavily on procurement scale and supplier leverage. As I have worked in the past for a Telco which is imo&e is one of the strongest (in the industry) in terms of purchasing power and supplier leverage, there is a danger that my unitary Capex assessment may be biased towards the lower end of a reasonable estimate for an industry average for the active equipment required. Another Capex expense factor associated with substantial variation is the spectrum expense I am using in my estimate. My 5G FWA design example requires me to deploy 100 MHz at 3.x GHz (e.g., 3.4 – 3.7 GHz). I have chosen the spectrum cost to be the median of 3.x GHz European spectrum auctions from 2017 to 2023 (a total of 22 in my dataset). The auction median cost is found to be ca. 0.08 € per MHz-pop, and the interquartile range (as a measure for variation) is 0.08 € per MHz-pop. Using an average number of people per Western European household of 2.2, assuming a telco market share of 30%, and a 100 MHz bandwidth, the spectrum cost per connected household would be ca. 60 Euro (per HHC).
In general, the cost of connecting households to fiber scales directly (strongly) with the household density. The cost of connecting a household with fixed wireless access only scales very weakly with the household density (e.g., via CPA, CPE, technical support). Although, if the criteria are that FWA will have to continue to deliver a very high target speed and availability, as the household density increases, there will be substantial step function increases in the required Capex and subsequent resulting Opex. FWA TCO per connected house becomes prohibitively costly as the household density decreases, as is the case for normal cellular services as well.
The total cost of ownership (TCO) includes both the capital as well as the operational expenses relating to the technical implementation of the fixed (FTTH) and fiber-like broadband (5G FWA) service. The various components included in the TCO analysis are summarised in Figure 10.
Figure 10 illustrates the critical parameters used in this analysis and their drivers. As explained, all drivers are re-scaled to be consistent with the household connection. Rather than, for example, the number of households passed for fiber deployment or population coverage for cellular infrastructure deployment. Note 1: for a new 5G FWA site, “Active Equipment” should include a fiber connection & the associated backhaul and possible fronthaul transport equipment. This transport solution is assumed present for an existing site and not included in its economics.
In my analysis, I have compared the cost of implementing different FWA designs with that of connecting a household with fiber. I define a competitive 5G FWA service as a service that can provide a similar quality in terms of speed and stability as that of a GPON-based fiber connection would be able to. The fiber-to-the-home service is designed to bring up to 1 Gbps line speed to a household and could, with the right design, be extended to 10 Gbps with XGPON at a relatively low upgrade capital cost. The FWA service targets an effective speed of 300 Mbps. As household connections are added to the 5G FWA site, at some point, it would become unlikely that the targeted service level can be maintained unless substantial expansions are made to the 5G site, e.g., adding a mmWave solution with a jump in additional frequency spectrum (>100MHz). This would likely lead to additional unit Capex and increases in operational expenses (e.g., energy cost, possible technical support costs, etc..).
Figure 11 compares the TCO, Capex, and Opex of buried fiber to the home (FTTH) to that of fixed wireless access (FWA). For FTTH it is assumed that homes connected amount to 60% of homes passed, which is 90% of the actual household density. The designed FTTH network supports up to 1 Gbps. The FWA is based on LoS to connected homes assuming that I need a total of 6 sectors, one from an existing mobile site and a new 5G site only configured with 5G FWA. The LoS is closed by beamforming from a 64×64 massive MiMo antenna configuration (per sector), with provisioned 100 MHz bandwidth at 3.x GHz, to the customer premise antenna (CPA) installed optimally on the customer household. It is assumed that 30% of covered households will subscribe to the service, and the network cover 98% of all households (with 3-LoS sectors per connected home). The FWA service targets an effective speed of up to 300 Mbps per household. As the number of connected homes increases, there will be a point where the actual serviced speed to the home will be less than 300 Mbps due to the load. The € 30(±8) per month is the Western Europe average cost of a minimum 250 Mbps fixed broadband package. The cities indicate the equivalent household densities. Note: the FWA Opex and, consequently its TCO is different from what has been presented in one of my LinkedIn posts recently. The reason for this is that I spend more time improving my FWA energy consumption model and added some more energy management and steering to my economical model. This is one of the most important cost drivers (also for 5G in general) and I suspect that much more will have to be done in this area to get the overall power consumption substantially down compared to the existing solutions we have today.
Assuming 6 cellular sectors for my chosen 5G FWA solution with 3 of those sectors being greenfield (e.g., abbreviated 3Si + 3Sn), Figure 11 shows that for 5G FWA at scale and targeting competitive services (in terms of quality and stability), is rarely a more economical solution (based on TCO) compared to fiber. Only at high household densities does 5G FWA become economically as attractive as fiber-to-the-home. Although the problem with 5G FWA at large household densities is, that the connection load may be too high to maintain the service design specifications, e.g., speed and availability, without substantial additional upgrades (e.g., mmWave, additional spectrum & sector densification). Even if 5G FWA on a per connected home is (much) more Capex efficient, the economics of Fiber deployment and household fiber connections are more scalable to the connected home than a fixed-like wireless service will be at low and medium household densely urbanized areas.
Relaxing the 5G FWA configuration will not help much as Figure 12 below illustrates. Only in cases where a single existing site (with 3 sectors) can offer a reasonable LoS scale to customer’s households may the TCO be brought down to a comparable range as that of fiber to the home (for a given household density, that is). Using Professor Al-Hourani results one can show that if no receiving household point (e.g., height of building + antenna) is heigher than 15 meter (max. three story buildings) the maximum amount of households with LoS should be no more than 20%. Given that in more rural and suburban environment buildings may be more likely to be a lot lower in exterior height than 15 meter (e.g., 5 – 10 meters) the number of households with LoS (from a single point) could be substantially lower than 20%. In addition, to having a LoS to a household, it, of course, also needs to be your customers premise. Say you have a market share of 30%, one should not expect within a given coverage area to have a potential of more than maybe a maximum of 6% (and likely a lot lower than that). This of course makes any dedicated 5G FWA investment prohibitedly costly due to the lack of scale.
Figure 12 above illustrates a coverage area of 500 connected households and, thus, a relatively dense urban coverage area. FTTH has an uptake of 60% of homes passed, and 5G FWA has a market share of 30% within the covered area. The fiber is relatively straightforward and can be either based on buried or aerial fiber. The depicted figure is based on buried fiber homes connected (FTTH). For FWA we have several options to cover households; (3Si) is based on having 3 sectors with LOS to all household customers. All three sectors are upgraded to support 5G FWA. Based on existing mobile networks and FWA at scale, this would unlikely be the situation. (1Si) is based on one sector covering all connected households (in principle with LoS). One existing sector is upgraded to support 5G FWA. Unless the operator only picks HH with good coverage (e.g., LoS to a given sector) then this scenario appears even more unlikely than the (3Si) scenario at this scale of connected homes, (3Si+3Sn) is based on having an existing site with 3 sectors as well requiring a new 3-sectors site to provide LoS household coverage within the service area. This is also the basis for the FWA cost curves in Figure 10, (3Si+6Sn) based on having an existing site with 3 sectors and requiring two new 3-sectors sites (i.e., additional 6 sectors) to provide LoS household coverage within the service area. Finally, the TCO is compared with (M) a normal mobile 3-sectored 4G & 5G site TCO. The mobile TCO has been normalized to mobile customers assuming a market share of 30%. Note (*): The TCO for the FTTH and all FWA comparisons are based on TCO relative to households connected (HHC).
All in all, using dedicated 5G FWA (or 4G FWA, for that matter) is unlikely to be as economical as a household fiber connection. In rural and suburban areas, where the load may be less of an issue, the existing cellular network’s intercellular distances tend to be too large to be directly usable for fiber-like services. Thus, requiring site densification. In denser urban areas, the connection load may require additional investment to support the demand and maintain quality (e.g., mmWave solutions). However, these places may also be the areas most likely already to be covered by fiber or high quality HFC.
Irrespective of FWA’s maybe poorer economics, in comparison with fiber deployment, there are many countries in Western Europe (and a lot of other places) that lack comprehensive fiber coverage in both urban, suburban and rural areas. Areas that may only be covered by mediocor xDSL services and whatever broadband mobile coverage support. Geograophical areas where fiber may only be deployed years from now if ever at all (unless encourage by EU or other non-commercial subsidies). Such under-served fiber areas may still be commercially interesting for cellular infrastructure telcos, levering existing infra, or dedicated FWA ISPs that may have gotten their hands on lower cost mmWave spectrum.
I should also point out that there is plenty of opportunity for operational expense improvements by deploying for example more intelligent power management systems and/or simply switching off-and-on antenna elements (in the deployed AAS/massive-MiMo antennas) in off-peak traffic hours. The service level that is offered to FWA customers may also be optimized by modern care solutions, e.g., AI chatbots, Apps, IVR, WiFi optimizer solutions, … reducing the need for human-human technical support interactions. However, assuming an FWA customer require a customer premise antenna, requires connectivity to indoor gateway and high quality WiFi coverage in the household, is likely to result in Opex increase in customer care.
IN THE NOW THOUGHTS
I don’t see, FWA, 5G or not, as a credible alternative for fiber to the home. It is doubtful on a household-connection basis that it economically is a better choice. The argument that there is an incredible amount of underutilized resources in our cellular networks, so why not use all that for providing fixed-like, and maybe even fiber-like, services to rural and suburban households, is trying to avoid being held responsible for having possible wasted shareholders money and value but focusing more on being the best irrespective of whether value-generating demand was present or not.
FWA and FMS are technology options that may bridge a time where fiber becomes available in a given geographical footprint. It may act as a precursor for broadband demand that can trigger an accelerate uptake of fiber broadband services once the households have been fiber covered. But its nature as a fiber-like service is likely temporary albeit it may be around for several technology refreshment cycles.
Though, the cellular industry will have to address the relative high operational costs associated with a cellular solution targeting fixed- and fiber-like broadband (and to be honest mobile broadband as well) in comparison with fiber-to-the-home Opex. The projected energy cost of 5G (and 6G for that matter) ecosystem is simply not sustainable nor should it be acceptable to the industry. While suppliers are quick to address the massive improvement in energy consumption per bit-rate per new technology generation, what really is relevant for the network economics is the absolute consumption.
Finally, In time and day, where sustainability and reduction of wasteful demand on critical resources is of incredible importance to our industry, not only for our children’s children but also for achieving favorable financing, shareholders & investors money, consumer trust (and their money month upon month), and possibly the executives self-image, its is difficult to understand why any telco would not prioritize their fiber deployment or fiber service uptake over an incredible resource demanding 5G FWA to either compete or substitute much greener or substantially more sustainable fiber-based services.
ACKNOWLEDGEMENT.
I greatly acknowledge my wife Eva Varadi, for her support, patience, and understanding during the creative process of writing this Blog. Of course, a lot of thanks go out to my former Technology and Network Economics colleagues, who have been a source of inspiration and knowledge. Special thank you to Maurice Ketel (who for many years let my Technology Economics Unit in Deutsche Telekom, I respect him above and beyond), Paul Borker, Remek Prokopik, Michael Dueser, Gudrun Bobzin, as well as many many other industry colleagues who have contributed with valuable discussions and important insights. Of course, I can also not get away with (not that I ever would) not thanking Petr Ledl (leading DTAG’s Research & Trials) and Jaroslav Holis (R&T DTAG) for their willingness and a great deal of patience with my many questions into the nature of advanced antenna systems, massive MiMo, what the performance is today and what to expect in terms of performance in the near future. Any mistakes or misrepresentations of these technologies in this article is solely due to me.
Tom Copeland & Vladimir Antikarov, “Real Options – A practitioner’s Guide”, Texere (2001). My book version is first edition. It is an excellent book, and maybe one of the best written on Real Options. However, the 1st edition is full of mistakes & errors corrected in later editions. Make sure, if you acquire this book, to choose a later than 1st edition.
Full disclosure … when I was first introduced to the concept of Network Slicing, from one of the 5G fathers that I respect immensely (Rachid, it must have been back at the end of 2014), I thought that it was one of the most useless concepts that I had heard of. I did simply not see (or get) the point of introducing this level of complexity. It did not feel right. My thoughts were that taking the slicing concept to the limit might actually not make any difference to not having it, except for a tremendous amount of orchestration and management overhead (and, of course, besides the technological fun of developing it and getting it to work).
It felt a bit (a lot, actually) as a “let’s do it because we can” thinking. With the “We can” rationale based on the maturity of cloudification and softwarization frameworks, such as cloud-native, public-cloud scale, cloud computing (e.g., edge), software-defined networks (SDN), network-function virtualization (NFV), and the-one-that-is-always-named Artificial Intelligence (AI). I believed there could be other ways to offer the same variety of service experiences without this additional (what I perceived as an unnecessary) complexity. At the time, I had reservations about its impact on network planning, operations, and network efficiency. Not at all sure, it would be a development in the right economic direction.
Since then, I have softened to the concept of Network Slicing. Not (of course) that I have much choice, as slicing is an integral part of 5G standalone (5G) implementation that will be implemented and launched over the next couple of years across our industry. Who knows, I may very likely be proven very wrong, and then I learn something.
What is a network slice? We can see a network slice as an on-user-demand logical separated network partitioning, software-defined on-top of our common physical network infrastructure (wam … what a mouthful … test me out on this one next time you see me), slicing through our network technology stack and its layers. Thinking of a virtual private network (VPN) tunnel through a transport network is a reasonably good analogy. The network slice’s logical partitioning is isolated from other traffic streams (and slices) flowing through the 5G network. Apart from the slice logical isolation, it can have many different customizations, e.g., throughput, latency, scale, Quality of Service, availability, redundancy, security, etc… The user equipment initiates the slice request from a list of pre-defined slice categories. Assuming the network is capable of supporting its requirements, the chosen slice category is then created, orchestrated, and managed through the underlying physical infrastructure that makes up the network stack. The pre-defined slice categories are designed to match what our industry believe is the most essential use-cases, e.g., (a) enhanced mobile broadband use cases (eMBB), (b) ultra-reliable low-latency communications (uRLLC) use cases, (c) massive machine-type communication (MMTC) use cases, (d) Vehicular-to-anything (V2X) use-cases, etc… While the initial (early day) applications of network slicing are expected to be fairly static and configurationally relatively simple, infrastructure suppliers (e.g., Ericsson, Huawei, Nokia, …)expect network slices to become increasingly dynamic and rich in their configuration possibilities. While slicing is typically evoked for B2B and B2B2X, there is not really a reason why consumers could not benefit from network slicing as well (e.g., gaming/VR/AR, consumer smart homes, consumer vehicular applications, etc..).
Show me the money!
Ericsson and Arthur D. Little (ADL) have recently investigated the network slicing opportunities for communications service providers (CSP). Ericsson and ADL have analyzed more than 70 external market reports on the global digitalization of industries and critically reviewed more than 400 5G / digital use cases (see references in Further Readings below). They conclude that the demand from digitalization cannot be served by CSPs without Network Slicing, e.g., “Current network resources cannot match the increasing diversity of demands over time” and “Use cases will not function” (in a conventional mobile network). Thus, according to Ericsson and ADL, the industry can not “live” without Network Slicing (I guess it is good that it comes with 5G SA then). In fact, from their study, they conclude that 30% of the 5G use cases explored would require network slicing (oh joy and good luck that it will be in our networks soon).
Ericsson and ADL find globally a network slicing business potential of 200 Billion US dollars by 2030 for CSPs. With a robust CAGR (i.e., the potential will keep growing) between 23% to 36% by 2030 (i.e., CAGR estimate for period 2025 to 2030). They find that 6 Industries segments take 90+% of the slicing potential; (1) Healthcare (23%), (2) Government (17%), (3) Transportation (15%), (4) Energy & Utilities (14%), (5) Manufacturing (12%) and (6) Media & Entertainment (11%). For the keen observer, we see that the verticals are making up for most of the slicing opportunities, with only a relatively small part being related to the consumers. It should, of course, be noted that not all CSPs are necessarily also mobile network operators (MNOs), and there are also outside the strict domain of MNOs revenue potential for non-MNO CSPs (I assume).
Let us compare this slicing opportunity to global mobile industry revenue projections from 2020 to 2030. GSMA has issued a forecast for mobile revenues until 2025, expecting a total turnover of 1,140 Billion US$ in 2025 at a CAGR (2020 – 2025) of 1.26%. Assuming this compounded annual growth rate would continue to apply, we would expect a global mobile industry revenue of 1,213 Bn US$ by 2030. Our 5G deployments will contribute in the order of 621 Bn US$ (or 51% of the total). The incremental total mobile revenue between 2020 and 2030 would be ca. 140 Bn US$ (i.e., 13% over period). If we say that roughly 20% is attributed to mobile B2B business globally, we have that by 2030 we would expect a B2B turnover of 240+ Bn US$ (an increase of ca. 30 Bn US$ over 2020). So, Ericsson & ADL’s 200 Bn US$ network slicing potential is then ca. 16% of the total 2030 global mobile industry turnover or 30+% of the 5G 2030 turnover. Of course, this assumes that somehow the slicing business potential is simply embedded in the existing mobile turnover or attributed to non-MNO CSPs (monetizing the capabilities of the MNO 5G SA slicing enablers).
Of course, the Ericsson-ADL potential could also be an actual new revenue stream untapped by today’s network infrastructures due to the lack of slicing capabilities that 5G SA will bring in the following years. If so, we can look forward to a boost of the total turnover of 16% over the GSMA-based 2030 projection. Given ca. 90% of the slicing potential is related to B2B business, it may imply that B2B mobile business would almost double due to network slicing opportunities (hmmm).
Another recent study assessed that the global 5G network slicing market will reach approximately 18 Bn US$ by 2030 with a CAGR of ca. 41% over 2020-2030.
Irrespective of the slicing turnover quantum, it is unlikely that the new capabilities of 5G SA (including network slicing and much richer granular quality of service framework) will lead to new business opportunities and enable unexplored use cases. That, in turn, may indeed lead to enhanced monetization opportunities and new revenue streams between now (2022) and 2030 for our industry.
Most Western European markets will see 5G SA being launched over the next 2 to 3 years; as 5G penetration rapidly approaches 50% penetration, I expect network slicing use cases being to be tried out with CSP/MNOs, industry partners, and governmental institutions soon after 5G SA has been launched. It should be pointed out that already for some years, slicing concepts have been trialed out in various settings. Both in 4G as well as 5G NSA networks.
Prologue to Network Slicing.
5G comes with a lot of fundamental capabilities as shown in the picture below,
5G allows for (1) enhanced mobile broadband, (2) very low latency, (3) massive increase in device density handling, i.e., massive device scale-up, (4) ultra-higher network reliability and service availability, and (5) enhanced security (not shown in the above diagram) compared to previous Gs.
The service (and thus network) requirement combinations are very high. The illustration below shows two examples of mapped-out sub-set of service (and therefore also eventually slice) requirements mapped onto the major 5G capabilities. In addition, it is quite likely that businesses would have additional requirements related to slicing performance monitoring, for example, in real-time across the network stack.
and with all the various industrial or vertical use cases (see below) one could imagine (noting that there may be many many more outside our imagination), the “fathers” of 5G became (very) concerned with how such business-critical services could be orchestrated and managed within a traditional mobile network architecture as well as across various public land mobile networks (PLMN). Much of this also comes out of the wish that 5G should “conquer” (take a slice of) next-generation industries (i.e., Industry 4.0), providing additional value above and beyond “the dumb bit pipe.” Moreover, I do believe that in parallel with the wish of becoming much more relevant to Industry 4.0 (and the next generation of verticals requirements), what also played a role in the conception of network slicing is the deeply rooted engineering concept of “control being better than trust” and that “centralized control is better than decentralized” (I lost count on this debate of centralized control vs. distributed management a long time ago).
So, yes … The 5G world is about to get a lot more complex in terms of Industrial use cases that 5G should support. And yes, our consumers will expect much higher download speeds, real-time (whatever that will mean) gaming capabilities, and “autonomous” driving …
“… it’s clear that the one shared public network cannot meet the needs of emerging and advanced mobile connectivity use cases, which have a diverse array of technical operations and security requirements.” (quote from Ericsson and Arthur D. Little study, 2021).
“The diversity of requirements will only grow more disparate between use cases — the one-size-fits-all approach to wireless connectivity will no longer suffice.” (quote from Ericsson and Arthur D. Little study, 2021).
Being a naturalist (yes, I like “naked” networks), it does seem somewhat odd (to me) to say that next generation (e.g., 5G) networks cannot support all the industrious use cases that we may throw at it in its native form. Particular after having invested billions in such networks. By partitioning a network up in limiting (logically isolated), slice instances can all be supported (allegedly). I am still in the thinking phase on that one (but I don’t think the math adds up).
Now, whether one agrees (entirely) with the economic sentiment expressed by Ericsson and ADL or not. We need a richer granular way of orchestrating and managing all those diverse use-cases we expect our 5G network to support.
Network Slicing.
So, we have (or will get) network slicing with our 5G SA Core deployment. As a reminder, when we talk about a network slice, we mean;
“An on-user-demandlogicalseparated network partitioning, software-defined, on-top of a common physical network infrastructure.”
So, the customer requested the network slice, typically via a predefined menu of slicing categories that may also have been pre-validated by the relevant network. Requested slices can also be Customized,by the requester, within the underlying 5G infrastructure capabilities and functionalities. If the network can provide the requested slicing requirements, the slice is (in theory) granted. The core network then orchestrates a logically separated network partitioning throughout the relevant infrastructure resources to comply with the requested requirements (e.g., speed, latency, device scale, coverage, security, etc…). The requested partitioning (i.e., the slice) is isolated from other slices to enable (at least on a logical level) independence of other live slices. Slice Isolation is an essential concept to network slicing. Slice Elasticity ensures that resources can be scaled up and down to ensure individual slice efficiency and an overall efficient operation of all operating slices. It is possible to have a single individual network slice or partition a slice into sub-slices with their individual requirements (that does not breach the overarching slice requirements). GSMA has issued roaming and inter-PLMN guidelines to ensure 5G network slicing inter-operability when a customer’s application finds itself outside its home -PLMN.
Today, and thanks to GSMA and ITU, there are some standard network slice services pre-defined, such as (a) eMBB – Enhanced Mobile Broadband, (b) mMTC – Massive machine-type communications, (c) URLLC – Ultra-reliable low-latency communications, (d) V2X – Vehicular-to-anything communications. These identified standard network slices are called Slice Service Types (SST). SSTs are not only limited to above mentioned 4 pre-defined slice service types. The SSTs are matched to what is called a Generic Slice Template (GST) that currently, we have 37 slicing attributes, allowing for quite a big span of combinations of requirements to be specified and validated against network capabilities and functionalities (maybe there is room for some AI/ML guidance here).
The user-requested network slice that has been set up end-2-end across the network stack, between the 5G Core and the user equipment, is called the network slice instance. The whole slice setup procedure is very well described in Chapter 12 of “5G NR and enhancements, from R15 to R16. The below illustration provides a high-level illustration of various network slices,
The 5G control function Access and Mobility management Function (AMF) is the focal point for the network slicing instances. This particular architectural choice does allow for other slicing control possibilities with a higher or lower degree of core network functionality sharing between slice instances. Again the technical details are explained well in some of the reading resources provided below. The takeaway from the above illustration is that the slice instance specifications are defined for each layer and respective physical infrastructure (e.g., routers, switches, gateways, transport device in general, etc…) of the network stack (e.g., Telco Core Cloud, Backbone, Edge Cloud, Fronthaul, New Radio, and its respective air-interface). Each telco stack layer that is part of a given network slice instance is supposed to adhere strictly to the slice requirements, enabling an End-2-End, from Core to New Radio through to the user equipment, slice of a given quality (e.g., speed, latency, jitter, security, availability, etc..).
And it may be good to keep in mind that although complex industrial use cases get a lot of attention, voice and mobile broadband could easily be set up with their own slice instances and respective quality-of-services.
Network slicing examples.
All the technical network slicing “stuff” is pretty much-taken care of by standardization and provided by the 5G infrastructure solution providers (e.g., Mavenir, Huawei, Ericsson, Nokia, etc..). Figuring the technical details of how these works require an engineering or technical background and a lot of reading.
As I see it, the challenge will be in figuring out, given a use-case, the slicing requirements and whether a single slice instance suffice or multiple are required to provide the appropriate operations and fulfillment. This, I expect, will be a challenge for both the mobile network operator as well as the business partner with the use case. This assumes that the economics will come out right for more complex (e.g., dynamic) and granular slice-instance use cases. For the operator as well as for businesses and public institutions.
The illustration below provides examples of a few (out of the 37) slicing attributes for different use cases, (a) Factories with time-critical, non-time-critical, and connected goods sub-use cases (e.g., sub-slice instances, QoS differentiated), (b) Automotive with autonomous, assisted and shared view sub-use cases, (c) Health use cases, and (d) Energy use cases.
One case that I have been studying is Networked Robotics use cases for the industrial segment. Think here about ad-hoc robotic swarms (for agricultural or security use cases) or industrial production or logistics sorting lines; below are some reflections around that.
End thoughts.
With the emergence of the 5G Core, we will also get the possibility to apply Network slicing to many diverse use cases. That there are interesting business opportunities with network slicing, I think, is clear. Whether it will add 16% to the global mobile topline by 2030, I don’t know and maybe also somewhat skeptical about (but hey, if it does … fantastic).
Today, the type of business opportunities that network slicing brings in the vertical segments is not a very big part of a mobile operator’s core competence. Mobile operators with 5G network slicing capabilities ultimately will need to build up such competence or (and!) team up with companies that have it.
That is, if the future use cases of network slicing, as envisioned by many suppliers, ultimately will get off the ground economically as well as operationally. I remain concerned that network slicing will not make operators’ operations less complex and thus will add cost (and possible failures) to their balance sheets. The “funny” thing (IMO) is that when our 5G networks are relatively unloaded, we would not have a problem delivering the use cases (obviously). Once our 5G networks are loaded, network slicing may not be the right remedy to manage traffic pressure situations or would make the quality we are providing to consumers progressively worse (and I am not sure that business and value-wise, this is a great thing to do). Of course, 6G may solve all those concerns 😉
Acknowledgement.
I greatly acknowledge my wife, Eva Varadi, for her support, patience, and understanding during the creative process of writing this Blog. Also, many of my Deutsche Telekom AG and Industry colleagues, in general, have in countless ways contributed to my thinking and ideas leading to this little Blog. Thank you!
Jia Shen, Zhongda Du, & Zhi Zhang, “5G NR and enhancements, from R15 to R16”, Elsevier Science, (2021). Provides a really good overview of what to expect from 5G standalone. Chapter 12 provides a good explanation of (and in detail account for) how 5G Network Slicing works in detail. Definitely one of my favorite books on 5G, it is not “just” an ANRA.
Claudia Campolo, Antonella Molinaro, Antonio Lera, and Francesco Menichella, “5G Network Slicing for Vehicle-to-Everything Services”, IEEE Wireless Communications 24, (December 2017). Great account of how network slicing should work for V2X services.
GSMA, “Securing the 5G Era” (2021). A good overview of security principles in 5G and how previous vulnerabilities in previous cellular generations are being addressed in 5G. This includes some explanation on why slicing further enhances security.
By the end of 2020, according with Ericsson, it was estimated that there where ca. 7.6 million 5G subscriptions in Western Europe (~ 1%). Compare this to North America’s ca. 14 million (~4%) and 190 million (~11%) North East Asia (e.g, China, South Korea, Japan, …).
Maybe Western Europe is not doing that great, when it comes to 5G penetration, in comparison with other big regional markets around the world. To some extend the reason may be that 4G network’s across most of Western Europe are performing very well and to an extend more than servicing consumers demand. For example, in The Netherlands, consumers on T-Mobile’s 4G gets, on average, a download speed of 100+ Mbps. About 5× the speed you on average would get in USA with 4G.
From the October 2021 statistics of the Global mobile Suppliers Association (GSA), 180 operators worldwide (across 72 countries) have already launched 5G. With 37% of those operators actively marketing 5G-based Fixed Wireless Access (FWA) to consumers and businesses. There are two main 5G deployment flavors; (a) non-standalone (NSA) deployment piggybacking on top of 4G. This is currently the most common deployment model, and (b) as standalone (SA) deployment, independently from legacy 4G. The 5G SA deployment model is to be expected to become the most common over the next couple of years. As of October 2021, 15 operators have launched 5G SA. It should be noted that, operators with 5G SA launched are also likely to support 5G in NSA mode as well, to provide 5G to all customers with a 5G capable handset (e.g., at the moment only 58% of commercial 5G devices supports 5G SA). Only reason for not supporting both NSA and SA would be for a greenfield operator or that the operator don’t have any 4G network (none of that type comes to my mind tbh). Another 25 operators globally are expected to be near launching standalone 5G.
It should be evident, also from the illustration below, that mobile customers globally got or will get a lot of additional download speed with the introduction of 5G. As operators introduce 5G, in their mobile networks, they will leapfrog their available capacity, speed and quality for their customers. For Europe in 2021 you would, with 5G, get an average downlink (DL) speed of 154 ± 90 Mbps compared to 2019 4G DL speed of 26 ± 8 Mbps. Thus, with 5G, in Europe, we have gained a whooping 6× in DL speed transitioning from 4G to 5G. In Asia Pacific, the quality gain is even more impressive with a 10× in DL speed and somewhat less in North America with 4× in DL speed. In general, for 5G speeds exceeding 200 Mbps on average may imply that operators have deployed 5G in the C-band band (e.g., with the C-band covering 3.3 to 5.0 GHz).
The above DL speed benchmark (by Opensignal) gives a good teaser for what to come and to expect from 5G download speed, once a 5G network is near you. There is of course much more to 5G than downlink (and uplink) speed. Some caution should be taken in the above comparison between 4G (2019) and 5G (2021) speed measurements. There are still a fair amount of networks around the world without 5G or only started upgrading their networks to 5G. I would expect the 5G average speed to reduce a bit and the speed variance to narrow as well (i.e., performance becoming more consistent).
In a previous blog I describe what to realistically expect from 5G and criticized some of the visionary aspects of the the original 5G white paper paper published back in February 2015. Of course, the tech-world doesn’t stand still and since the original 5G visionary paper by El Hattachi and Erfanian. 5G has become a lot more tangible as operators deploy it or is near deployment. More and more operators have launched 5G on-top of their 4G networks and in the configuration we define as non-standalone (i.e., 5G NSA). Within the next couple of years, coinciding with the access to higher frequencies (>2.1 GHz) with substantial (unused or underutilized) spectrum bandwidths of 50+ MHz, 5G standalone (SA) will be launched. Already today many high-end handsets support 5G SA ensuring a leapfrog in customer experience above and beyond shear mobile broadband speeds.
The below chart illustrates what to expect from 5G SA, what we already have in the “pocket” with 5G NSA, and how that may compare to existing 4G network capabilities.
There cannot be much doubt that with the introduction of the 5G Core (5GC) enabling 5G SA, we will enrich our capability and service-enabler landscape. Whether all of this cool new-ish “stuff” we get with 5G SA will make much top-line sense for operators and convenience for consumers at large is a different story for a near-future blog (so stay tuned). Also, there should not be too much doubt that 5G NSA already provide most of what the majority of our consumers are looking for (more speed).
Overall, 5G SA brings benefits, above and beyond NSA, on (a) round-trip delay (latency) which will be substantially lower in SA, as 5G does not piggyback on the slower 4G, enabling the low latency in ultra-reliable low latency communications (uRLLC), (b) a factor of 250× improvement device density (1 Million devices per km2) that can be handled supporting massive machine type communication scenarios (mMTC), (c) supports communications services at higher vehicular speeds, (d) in theory should result in low device power consumption than 5G NSA, and (e) enables new and possible less costly ways to achieve higher network (and connection) availability (e.g., with uRLLC).
Compared to 4G, 5G SA brings with it a more flexible, scalable and richer set of quality of service enablers. A 5G user equipment (UE) can have up to 1,024 so called QoS flows versus a 4G UE that can support up to 8 QoS classes (tied into the evolved packet core bearer). The advantage of moving to 5G SA is a significant reduction of QoS driven signaling load and management processing overhead, in comparison to what is the case in a 4G network. In 4G, it has been clear that the QoS enablers did not really match the requirements of many present day applications (i.e., brutal truth maybe is that the 4G QoS was outdated before it went live). This changes with the introduction of 5G SA.
So, when is it a good idea to implement 5G Standalone for mobile operators?
There are maybe three main events that should trigger operators to prepare for and launch 5G SA;
Economical demand for what 5G SA offers.
Critical mass of 5G consumers.
Want to claim being the first to offer 5G SA.
with the 3rd point being the least serious but certainly not an unlikely factor in deploying 5G SA. Apart from potentially enriching consumers experience, there are several operational advantages of transitioning to a 5GC, such as more mature IT-like cloudification of our telecommunications networks (i.e., going telco-cloud native) leading to (if designed properly) a higher degree of automation and autonomous network operations. Further, it may also allow the braver parts of telco-land to move a larger part of its network infrastructure capabilities into the public-cloud domain operated by hyperscalers or network-cloud consortia’s (if such entities will appear). Another element of the 5G SA cloud nativification (a new word?) that is frequently not well considered, is that it will allow operators to start out (very) small and scale up as business and consumer demand increases. I would expect that particular with hyperscalers and of course the-not-so-unusual-telco-supplier-suspects (e.g., Ericsson, Nokia, Huawei, Samsung, etc…), operators could launch fairly economical minimum viable products based on a minimum set of 5G SA capabilities sufficient to provide new and cost-efficient services. This will allow early entry for business-to-business new types of QoS and (or) slice-based services based on our new 5G SA capabilities.
Western Europe mobile market expectations – 5G technology share.
By end of 2021, it is expected that Western Europe would have in the order of 36 Million 5G connections, around a 5% 5G penetration. Increasing to 80 Million (11%) by end of 2022. By 2024 to 2025, it is expected that 50% of all mobile connections would be 5G based. As of October 2021 ca. 58% of commercial available mobile devices supports already 5G SA. This SA share is anticipated to grow rapidly over the next couple of years making 5G NSA increasingly unimportant.
Approaching 50% of all connections being 5G appears a very good time to aim having 5G standalone implemented and launched for operators. Also as this may coincide with substantial efforts to re-farming existing frequency spectrum from 4G to 5G as 5G data traffic exceeds that of 4G.
For Western Europe 2021, ca. 18% of the total mobile connections are business related. This number is expected to steadily increase to about 22% by 2030. With the introduction of new 5G SA capabilities, as briefly summarized above, it is to be expected that the 5G business connection share quickly will increase to the current level and that business would be able to directly monetize uRLLC, mMTC and the underlying QoS and network slicing enablers. For consumers 5G SA will bring some additional benefits but maybe less obvious new monetization possibilities, beyond the proportion of consumers caring about latency (e.g., gamers). Though, it appears likely that the new capabilities could bring operators efficiency opportunities leading to improved margin earned on consumers (for another article).
Recommendation:
Learn as much as possible from recent IT cloudification journeys (e.g., from monolithic to cloud, understand pros and cons with lift-and-shift strategies and the intricacies of operating cloud-native environments in public cloud domains).
Aim to have 5GC available for 5G SA launch latest by 2024.
Run 5GC minimum viable product poc’s with friendly (business) users prior to bigger launch.
As 5G is launched on C-band / 3.x GHz it may likewise be a good point in time to have 5G SA available. At least for B2B customers that may benefit from uRLLC, lower latency in general, mMTC, a much richer set of QoS, network slicing, etc…
Having a solid 4G to 5G spectrum re-farming strategy ready between now and 2024 (too late imo). This should map out 4G+NSA and SA supply dynamics as increasingly customers get 5G SA capabilities in their devices.
Western Europe mobile market expectations – traffic growth.
With the growth of 5G connections and the expectation that 5G would further boost the mobile data consumption, it is expected that by 2023 – 2024, 50% of all mobile data traffic in Western Europe would be attributed to 5G. This is particular driven by increased rollout of 3.x GHz across the Western European footprint and associated massive MiMo (mMiMo) antenna deployments with 32×32 seems to be the telco-lands choice. In blended mobile data consumption a CAGR of around 34% is expected between 2020 and 2030, with 2030 having about 26× more mobile data traffic than that of 2020. Though, I suspect that in Western Europe, aggressive fiberization of telecommunications consumer and business markets, over the same period, may ultimately slow the growth (and demand) on mobile networks.
A typical Western European operator would have between 80 – 100+ MHz of bandwidth available for 4G its downlink services. The bandwidth variation being determined by how much is required of residual 3G and 2G services and whether the operator have acquired 1500MHz SDL (supplementary downlink) spectrum. With an average 4G antenna configuration of 4×4 MiMo and effective spectral efficiency of 2.25 Mbps/MHz/sector one would expect an average 4G downlink speed of 300+ Mbps per sector (@ 90 MHz committed to 4G). For 5G SA scenario with 100 MHz of 3.x GHz and 2×10 MHz @ 700 MHz, we should expect an average downlink speed of 500+ Mbps per sector for a 32×32 massive MiMo deployment at same effective spectral efficiency as 4G. In this example, although naïve, quality of coverage is ignored. With 5G, we more than double the available throughput and capacity available to the operator. So the question is whether we remain naïve and don’t care too much about the coverage aspects of 3.x GHz, as beam-forming will save the day and all will remain cheesy for our customers (if something sounds too good to be true, it rarely is true).
In an urban environment it is anticipated that with beam-forming available in our mMiMo antenna solutions downlink coverage will be reasonably fine (i.e., on average) with 3.x GHz antennas over-layed on operators existing macro-cellular footprint with minor densification required (initially). In the situation that 3.x GHz uplink cannot reach the on-macro-site antenna, the uplink can be closed by 5G @ 700 MHz, or other lower cellular frequencies available to the operator and assigned to 5G (if in standalone mode). Some concerns have been expressed in literature that present advanced higher order antenna’s (e.g., 16×16 and above ) will on average provide a poorer average coverage quality over a macro cellular area than what consumers would be used to with lower order antennas (e.g., 4×4 or lower) and that the only practical (at least with today’s state of antennas) solution would be sectorization to make up for beam forming shortfalls. In rural and sub-urban areas advanced antennas would be more suitable although the demand would be a lot less than in a busy urban environment. Of course closing the 3.x GHz with existing rural macro-cellular footprint may be a bigger challenge than in an urban clutter. Thus, massive MiMo deployments in rural areas may be much less economical and business case friendly to deploy. As more and more operators deploy 3.x GHz higher-order mMiMo more field experience will become available. So stay tuned to this topic. Although I would reserve a lot more CapEx in my near-future budget plans for substantial more sectorization in urban clutter than what I am sure is currently in most operators plans. Maybe in rural and suburban areas the need for sectorizations would be much smaller but then densification may be needed in order to provide a decent 3.x GHz coverage in general.
Western Europe mobile market expectations – 5G RAN Capex.
That brings us to another important aspect of 5G deployment, the Radio Access Network (RAN) capital expenditures (CapEx). Using my own high-level (EU-based) forecast model based on technology deployment scenario per Western European country that in general considers 1 – 3% growth in new sites per anno until 2024, then from 2025 onwards, I assuming 2 – 5% growth due to densifications needs of 5G, driven by traffic growth and before mentioned coverage limitations of 3.x GHz. Exact timing and growth percentages depends on initial 5G commercial launch, timing of 3.x GHz deployment, traffic density (per site), and site density considering a country’s surface area.
According with Statista, Western Europe had in 2018 a cellular site base of 421 thousands. Further, Statista expected this base will grow with 2% per anno in the years after 2018. This gives an estimated number of cellular sites of 438k in 2020 that has been assumed as a starting point for 2020. The model estimates that by 2030, over the next 10 years, an additional 185k (+42%) sites will have been built in Western Europe to support 5G demand. 65% (120+k) of the site growth, over the next 10 years, will be in Germany, France, Italy, Spain and UK. All countries with relative larger geographical areas that are underserved with mobile broadband services today. Countries with incumbent mobile networks, originally based on 900 MHz GSM grids (of course densified since the good old GSM days), and thus having coarser cellular grids with higher degree of mismatching the higher 5G cellular frequencies (i.e., ≥ 2.5 GHz). In the model, I have not accounted for an increased demand of sectorizations to keep coverage quality upon higher order mMiMO deployments. This, may introduce some uncertainty in the Capex assessment. However, I anticipate that sectorization uncertainty may be covered in the accelerated site demand the last 5 years of the period.
In the illustration above, the RAN capital investment assumes all sites will eventually be fiberized by 2025. That may however be an optimistic assumption and for some countries, even in Western Europe, unrealistic and possibly highly uneconomical. New sites, in my model, are always fiberized (again possibly too optimistic). Miscellaneous (Misc.) accounts for any investments needed to support the RAN and Fiber investments (e.g., Core, Transport, Cap. Labor, etc..).
In the economical estimation price erosion has been taken into account. This erosion is a blended figure accounting for annual price reduction on equipment and increases in labor cost. I am assuming a 5-year replacement cycle with an associated 10% average price increase every 5 years (on the previous year’s eroded unit price). This accounts for higher capability equipment being deployed to support the increased traffic and service demand. The economical justification for the increase unit price being that otherwise even more new sites would be required than assumed in this model. In my RAN CapEx projection model, I am assuming rational deployment, that is demand driven deployment. Thus, operators investments are primarily demand driven, e.g., only deploying infrastructure required within a given financial recovery period (e.g., depreciation period). Thus, if an operator’s demand model indicate that it will need a given antenna configuration within the financial recovery period, it deploys that. Not a smaller configuration. Not a bigger configuration. Only the one required by demand within the financial recovery period. Of course, there may be operators with other deployment incentives than pure demand driven. Though on average I suspect this would have a neglectable effect on the scale of Western Europe (i.e., on average Western Europe Telco-land is assumed to be reasonable economically rational).
All in all, demand over the next 8 years leads to an 80+ Billion Euro RAN capital expenditure, required between 2022 and 2030. This, equivalent to a annual RAN investment level of a bit under 10 Billion Euro. The average RAN CapEx to Mobile Revenue over this period would be ca. 6.3%, which is not a shockingly high level (tbh), over a period that will see an intense rollout of 5G at increasingly higher frequencies and increasingly capable antenna configurations as demand picks up. Biggest threat to capital expenditures is poor demand models (or no demand models) and planning processes investing too much too early, ultimately resulting in buyers regret and cycled in-efficient investment levels over the next 10 years. And for the reader still awake and sharp, please do note that I have not mentioned the huge elephant in the room … The associated incremental operational expense (OpEx) that such investments will incur.
As mobile revenues are not expected to increase over the period 2022 to 2030, this leaves 5G investments main purpose to maintaining current business level dominated by consumer demand. I hope this scenario will not materialize. Given how much extra quality and service potential 5G will deliver over the next 10 years, it seems rather pessimistic to assume that our customers would not be willing to pay more for that service enhancement that 5G will brings with it. Alas, time will show.
Acknowledgement.
I greatly acknowledge my wife Eva Varadi for her support, patience and understanding during the creative process of writing this Blog. Petr Ledl, head of DTAG’s Research & Trials, and his team’s work has been a continuous inspiration to me (thank you so much for always picking up on that phone call Petr!). Also many of my Deutsche Telekom AG, T-Mobile NL & Industry colleagues in general have in countless of ways contributed to my thinking and ideas leading to this little Blog. Thank you!
Rachid El Hattachi & Javan Erfanian , “5G White Paper”, NGMN Alliance, (February 2015). See also “5G White Paper 2” by Nick Sampson (Orange), Javan Erfanian (Bell Canada) and Nan Hu (China Mobile).
Global Mobile Frequencies Database. (last update, 25 May 2021). I recommend very much to subscribe to this database (€595,. single user license). Provides a wealth of information on spectrum portfolios across the world.
Jia Shen, Zhongda Du, & Zhi Zhang, “5G NR and enhancements, from R15 to R16”, Elsevier Science, (2021). Provides a really good overview of what to expect from 5G standalone. Particular, very good comparison with what is provided with 4G and the differences with 5G (SA and NSA).
Ali Zaidi, Fredrik Athley, Jonas Medbo, Ulf Gustavsson, Giuseppe Durisi, & Xiaoming Chen, “5G Physical Layer Principles, Models and Technology Components”, Elsevier Science, (2018). The physical layer will always pose a performance limitation on a wireless network. Fundamentally, the amount of information that can be transferred between two locations will be limited by the availability of spectrum, the laws of electromagnetic propagation, and the principles of information theory. This book provides a good description of the 5G NR physical layer including its benefits and limitations. It provides a good foundation for modelling and simulation of 5G NR.
Thomas L. Marzetta, Erik G. Larsson, Hong Yang, Hien Quoc Ngo, “Fundamentals of Massive MIMO”, Cambridge University Press, (2016). Excellent account of the workings of advanced antenna systems such as massive MiMo.
Western Europe: Western Europe has a bit of a fluid definition (I have found), here Western Europe includes the following countries comprising a population of ca. 425 Million people (in 2021); Austria, Belgium, Denmark, Finland, France, Germany, Greece, Ireland, Italy, Netherlands, Norway, Portugal, Spain, Sweden, Switzerland United Kingdom, Andorra, Cyprus, Faeroe Islands, Greenland, Guernsey, Jersey, Malta, Luxembourg, Monaco, Liechtenstein, San Marino, Gibraltar.
As I am preparing for my keynote speech for the Annual Dinner event of the Telecom Society Netherlands (TSOC) end of January 2020, I thought the best way was to write down some of my thoughts on the key question “Is the ‘Uber’ moment for the telecom sector coming?”. In the end it turned out to be a lot more than some of my thoughts … apologies for that. Though it might still be worth reading, as many of those considerations in this piece will be hitting a telcos near you soon (if it hasn’t already).
Knowing Uber Technologies Inc’s (Uber) business model well (and knowing at least the Danish taxi industry fairly well as my family has a 70+ years old Taxi company, Radio-Taxi Nykoebing Sjaelland Denmark, started by my granddad in 1949), it instinctively appear to be an odd question … and begs the question “why would the telecom sector want an Uber moment?” … Obviously, we would prefer not to be massively loss making (as is the Uber moment at this and past moments, e.g., several billions of US$ loss over the last couple of years) and also not the regulatory & political headaches (although we have our own). Not to mention some of the negative reputation issues around “their” customer experience (quiet different from telco topics and thank you for that). Also not forgetting that Uber has access to only a fraction of the value chain in the markets the operate … Althans of course Uber is also ‘infinitely’ lighter in terms of assets than a classical Telco … Its also a bit easier to replicate an Uber (or platform businesses in general) than an asset-heavy Telco (as it requires a “bit” less cash to get started;-). But but … of course the question is more related to the type of business model Uber represent rather than the taxi / ride hailing business model itself. Thinking of Uber makes such a question more practical and tangible …
And not to forget … The super cool technology aspects of being a platform business such as Uber … maybe Telco-land can and should learn from platform businesses? … Lets roll!
uber Uber
Uber main business (ca. 81%) is facilitating peer-2-peer ride sharing and ride hailing services via their mobile application and its websites. Uber tabs into the sharing economy. Making use of under-utilized private cars and their owners (producers) willingness to give up hours of their time to drive others (consumers) around in their private vehicle. Uber had 95 million active users (consumers) in 2018 and is expected to reach 110 million in 2019 (22% CAGR between 2016 & 2019). Uber has around 3+ million drivers (producers) spread out over 85+ countries and 900+ cities around the world (although 1/3 is in the USA). In the third quarter of 2019, Uber did 1.77 billion trips. That is roughly 200 trips per Uber driver per month of which the median income is 155 US$ per month (1.27 US$ per trip) before gasoline and insurances. In December 2017, the median monthly salary for Americans was $3,714.
In addition Uber also provides food delivery services (i.e., Uber Eats, ca. 11%), Uber Freight services (ca. 7%) and what they call Other Bets (ca. 1%). The first 9 month of 2019, Uber spend more than 40% of the turnover on R&D. Uber has an average revenue per trip (ARPT) of ca. 2 US$ (out of 9.5 US$ per trip based on gross bookings). Not a lot of ARPT growth the last 9 quarters. Although active users (+30% YoY), trips (+31% YoY), Gross Bookings (+32%) and Adjusted Net Revenue (+35%) all shows double digit growth.
Uber allegedly takes a 25% fee of each fare (note: if you compare gross bookings, the total revenue generated by their services, to net revenue which Uber receives the average is around 20%).
Uber’s market cap, roughly 10 years after being founded, after its IPO was 76 Bn US$ (@ May 10th, 2019) only exceeded by Facebook (104.2 Bn @ IPO) and Alibaba Group (167.6 Bn US$ @ IPO). 7 month after Uber’s market cap is ca. 51 Bn US$ (-33% down on IPO). The leading European telco Deutsche Telekom AG (25 years old, 1995) in comparison has a market capitalization around 70 Bn US$ and is very far from loss making. Deutsche Telekom is one of the world’s leading integrated telecommunications companies, with some 170+ million mobile customers, 28 million fixed-network lines, and 20 million broadband lines.
Peal the Onion
“Telcos are pipe businesses, Ubers are platform businesses”
In other words, Telco’s are adhering to a classical business model with fairly linear causal value chain (see Michael Porter’s classic from 1985). It’s the type of input/output businesses that has been around since the dawn of the industrial revolution. Such a business model can (and should) have a very high degree of end-2-end customer experience control.
Ubers (e.g., Uber, Airbnb, Booking.com, ebay, Tinder, Minecraft, …) are non-linear business models that benefit from direct and indirect network effects allowing for exponential growth dynamics. Such businesses are often piggybacking on under-utilized or un-used assets owned by individuals (e.g., homes & rooms, cars, people time, etc…). Moreover, these businesses facilitate networked connectivity between consumers and producers via a digital platform. As such, platform businesses rarely have complete end-2-end customer experience control but would focus on the quality and experience of networked connectivity. While platform business have little control over their customers (i.e., consumers and producers) experiences or overall customer journey they may have indirectly via near real-time customer satisfaction feedback (although this is after the fact).
Clearly the internet has enabled many new ways of doing business. In particular it allows for digital businesses (infrastructure lite) to create value by facilitating networked-scaled business models where demand (i.e., customers demand XYZ) and supply (i.e., businesses supplying XYZ).
Think ofAirbnb‘s internet-based platform that connects (or networks) consumers (guests), who are looking for temporary accommodation (e.g., hotel room), with producers (hosts, private or corporate) of temporary accommodations to each other. Airbnb thus allow for value creation by tying into the sharing economy of private citizens. Under-utilized private property is being monetized, benefiting hosts (producers), guests (consumers) and the platform business (by charging a transactional fee). Airbnb charges hosts a 3% fee that mainly covers the payment processing cost. Moreover, Airbnb’s typical guest fee is under 13% of the booking cost. “Airbnb is a platform business built upon software and other peoples under-utilized homes & rooms”. While Airbnb facilitated private (temporary) accommodations to consumers, today there are other online platform businesses (e.g., Booking.com, Experia.com, agoda.com, … ) that facilitates connections between hotels and consumers.
Think of Uber‘sonline ride hailing platformconnects travelers (consumer) with drivers (producers, private or corporate) as an alternative to normal cab / taxi services. Uber benefits from the under-utilization of most private cars, the private owners willingness to spend spare time and desire to monetize this under-utilization by becoming a private cab driver. Again the platform business exploring the sharing economy. Uber charges their drivers 25% of the faring fee. “Uber is a platform business built upon software and other peoples under-utilized cars and spare time”.The word platform was used 747 times in Uber’s IPO document. After Uber launched its digital online ride hailing platform, many national and regional taxi applications have likewise been launched. Facilitating an easier and more convenient way of hauling a taxi, piggybacking on the penetration of smartphones in any given market. In those models official taxi businesses and licensed taxi drivers collaborate around an classical industry digital platform facilitating and managing dispatches on consumer demand.
“A platform business relies on the sharing economy, monetizing networking (i.e., connecting) consumers and producers by taking a transaction fee on the value of involved transaction flow.”
E.g., consumer pays producer, or consumer get service for free and producer pays the platform business. It is a highly scaleble business model with exponential potential for growth assuming consumers and producers alike adapt your platform. The platform business model tends to be (physical) infrastructure and asset lite and software heavy. It typically (in start-up phase at least) relies on commercially available cloud offering (e.g., Lyft relies on AWS, Uber on AWS & Google) or if the platform business is massively scaled (e.g., Facebook), the choice may be to own data center infrastructure to have better platform control over operations. Typically you will see that successful Platform businesses at scale implements hybrid cloud model levering commercially available cloud solutions and own data centers. Platform businesses tend to be heavily automated (which is relative easy in a modern cloud environment) and rely very significantly on monetizing their data with underlying state-of-the-art real-time big data systems and of course intelligent algorithmic (i.e., machine learning based) business support systems.
Consider this
A platform-business’s technology stack, residing in a cloud, will typically run on a virtual machine or within a so-called container engine. The stack really resides on the upper protocol layers and is transparent to lower level protocols (e..g, physical, link, network, transport, …). In general the platform stack can be understood to function on the 3 platform layers presented in the chart to the left; (top-platform-layer) Networked Marketplace that connects producers and consumers with each other. This layer describes how a platform business customers connect (e.g., mobile app on smartphone), (middle-platform-layer) Enabling Layer in which microservices, software tools, business logic, rules and so forth will reside, (bottom-platform-layer) the Big Data Layer or Data Layer with data-driven decision making are occurring often supported by advanced real-time machine learning applications. The remaining technology stuff (e.g., physical infrastructure, servers, storage, LAN/WAN, switching, fixed and mobile telco networking, etc..) is typically taken care of by cloud or data center providers and telco providers. Which is explains why platform businesses tends to be infrastructure or asset lite (and software heavy) compared to telco and data-center providers.
“Many classical linear businesses are increasingly copying the platform businesses digital strategies (achieving an improved operational excellence) without given up on their fundamental value-chain control. Thus allowing to continue to provide consumers a known and often improved customer experience compared to a pure platform business.”
So what about the Telco model?
Well, the Telco business model is adhering to a linear value chain and business logic. And unless you are thinking of a service telco provider or virtual telco operator, Telcos are incredible infrastructure and asset heavy with massive capital investments required to provide competitive services to their customers. Apart from the required capital intensive underlying telco technology infrastructure, the telco business model requires; (1) public licenses to operate (often auctioned, or purchased and rarely “free”), (2) requires (public) telephony numbers, (3) spectrum frequencies (i.e.,for mobile operation) and so forth …
Furthermore, overall customer experience and end-2-end customer journey is very important to Telcos (as it is to most linear businesses and most would and should subscribe to being very passionate about it). In comparison to Platform Businesses, it would not be an understatement (at this moment in time at least) to say that most Telco businesses are lagging on cloudification/softwarisation, intelligent automation (whether domain-based or End-2-End) and advanced algorithmic (i.e., machine learning enabled) decision making as it relates to overarching business decisions as well as customer-related micro-decisions. However, from an economical perspective we are not talking about more than 10% – 20% of a Telco’s asset base (or capital expenses).
Mobile telco operators tend to be fairly advanced in their approaches to customer experience management, although mainly reactive rather than pro-active (due to lower intelligent algorithmic maturity again in comparison to most platform businesses). In general, fixed telco businesses are relative immature in their approaches to customer experience management (compared to mobile operators) possibly due lack of historical competitive pressure (“why care when consumers have not other choice” mindset). Alas this too is changing as more competition in fixed telco-land emerges.
“Telcos have some technology catching up to do in comparison & where relevant with platform businesses. However, that catching up does not force them to change the fundamentals of their business model (unless it make sense of course).”
Characteristic of a Platform Business
Often relies on the sharing economy (i.e., monetizing under-utilized resources).
It’s (exponential) growth relies on successful networking of consumers & producers (i.e., piggybacking on network effects).
Software-centric: platform business is software and focus / relies on the digital domain & channels.
Mobile-centric: mobile apps for consumers & producers.
Cloud-centric: platform-solution built on Public or Hybrid cloud models.
Cloud-native maturity level (i.e., the highest cloud maturity level).
Heavily end-2-end automated across cloud-native platform, processes & decision making.
Highly sophisticated data-driven decision making.
Infrastructure / asset lite (at scale may involve own data center assets).
Business driven & optimized by state-of-art big data real-time solutions supported by a very high level of data science & engineering maturity.
Little or no end-2-end customer experience control (i.e., in the sense of complete customer journey).
Very strong focus on connection experience including payment process.
Revenue source may be in form of transactional fee imposed on the value involved in networking producers and consumers (e.g., payment transaction, cost-per-click, impressions, etc..).
In my opinion it is not a given that a platform business always have to disrupt an existing market (or classical business model). However, a successful platform business often will be transformative, resulting in classical business attempting to copy aspects of the platform business model (e..g, digitalization, automation, cloud transformation, etc..). It is too early in most platform businesses life-cycle to conclude whether, where they disrupt, it is a temporary disruption (until the disrupted have transformed) or a permanently destruction of an existing classical market model (i.e., leaving little or no time for transformation).
So with the above in mind (and I am sure for many other defining factors), it is hard to see a classical telco transforming itself into a carbon copy of a platform business and maybe more importantly why this would make a lot of sense to do in the first instance. But but … it is also clear that Telco-land should proudly copy what make sense (e.g., particular around tech and level of digitization).
Teaser thought Though if you think in terms of sharing economical principles, the freedom that an eSIM (or software-based SIM equivalents) provides with 5 or more network profiles may bring to a platform business going beyond traditional MVNOs or Service Providers … well well … you think! (hint: you may still need an agreement with the classical telco though … if you are not in the club already;-). Maybe a platform model could also tab into under-utilized consumer resources that the consumer has already paid for? or what about a transactional model on Facebook (or other social media) where the consumer actual monetizes (and controls) personal information directly with third party advertisers? (actually in this model the social media company could also share part of its existing spoil earned on their consumer product, i.e., the consumer) etc…
However, it does not mean that telcos cannot (and should not) learn from some of the most successful platform business around. There certainly is enough classical beliefs in the industry that may be ripe for a bit of disruption … so untelconizing (or as my T-Mobile US friends like to call it uncarrier) ourselves may not be such a bad idea.
Telco-land
“There is more to telco technologies than its core network and backend platforms.”
Having a great (=successful) e-commerce business platform with cloud-native maturity level including automation that most telcos can only dream of, and mouth watering real-time big data platforms with the smartest data scientist and data engineers in the world … does not make for an easy straightforward transformation to a national (or world for that matter) leading (or non-leading) telco business in the classical sense of owning the value chain end-to-end.
Japan’s Rakuten is one platform business that has the ambition and expressed intention to move from being traditional platform-based business (ala Amazon.com) to become a mobile operator leveraging all the benefits and know-how of their existing platform technologies. Extending those principles, such as softwarization, cloudification and cloud-native automation principles, all the way out to the edge of the mobile antenna.
Many of us in telco-land thought that starting out with a classical telco, with mobile and maybe fixed assets as well, would make for an easy inclusion of platform-like technologies (as describe above), have had to revise our thinking somewhat. Certainly time-lines have been revised a couple of times, as have the assumed pre-conditions or context for such a transformation. Even economical and operational benefits that seems compelling, at least from a Greenfield perspective, turns out to be a lot more muddy when considering the legacy spaghetti we have in telcos with years and years in bag. And for the ones who keep saying that 5G will change all that … no I really doubt that it will any time soon.
While above platform-like telco topology looks so much simpler than the incumbent one … we should not forget it is what lays underneath the surface that matters. And what matters is software. Lots of software. The danger will always be present that we are ending up replacing hardware & legacy spaghetti complexity with software spaghetti complexity. Resulting unintended consequences in terms of longer-term operational stability (e.g,, when you go beyond being a greenfield business).
“Software have made a lot in the physical world redundant but it may also have leapfrogged the underlying operational complexity to an extend that may pose an existential threat down the line.”
While many platform businesses have perfected cloud-native e-commerce stacks reaching all the way out to the end-consumers mobile apps, residing on the smartphone’s OS, they do operate on the higher level of whatever relevant telco protocol stack. Platform businesses today relies on classical telcos to provide a robust connection data pipe to their end-users at high availability and stability.
What’s coming for us in Telco-land?
“Software will eat more and more of telco-land’s hardware as well as the world.”
(side note: for the ones who want to say that artificial intelligence (AI) will be eating the software, do remember that AI is software too and imo we talk then about autosarcophagy … no further comment;-).
Telcos, of the kinds with a past, will increasingly implement software solutions replacing legacy hardware functionality. Such software will be residing in a cloud environment either in form of public and/or private cloud models. We will be replacing legacy hardware-centric telco components or boxes with a software copy, residing on a boring but highly standardized hardware platform (i.e., a common off the shelf server). Yes … I talk about software definable networks (SDN) and network functional virtualization (NFV) features and functionalities (though I suspect SDN/NFV will be renamed to something else as we have talked about this for too many years for it to keep being exciting;-). The ultimate dream (or nightmare pending on taste) is to have all telco functions defined in software and operating on a very low number of standardized servers (let’s call it the pizza-box model). This is very close to the innovative and quiet frankly disruptive ideas of for example Drivenets in Israel (definitely worth a study if you haven’t already peeked at some of their solutions). We are of course seeing quiet some progress in developing software equivalents to telco core (i.e., Telco Cloud in above picture) functionalities, e.g., evolved packet core (EPC) functions, policy and charging rules function (PCRF), …. These solutions are available from the usual supplier suspects (e.g., Cisco, Ericsson, Huawei, and Nokia) as well as from (relative) new bets, such as for example Affirmed Networks and Mavenir (side note: if you are not the usual supplier suspect and have developed cloud-based telco functionalities drop me a note … particular if such work in a public or hybrid cloud model with for example Azure or AWS).
We will have software eating its way out to the edge of our telco networks. That is assuming it proves to make economical and operational sense (and maybe even anyway;-). As computing requirements, driven by softwarization of telco-land, goes “through the roof” across all network layers, edge computing centers will be deployed (or classical 2G BSC or 3G RNC sites will be re-purposed for the “lucky” operators with a more dis-aggregated network typologies).
Telcos (should) have very strong desires for platform-like automation as we know it from platform businesses cloud-native implementations. For a telco though, the question is whether they can achieve cloud-native automation principles throughout all their network layers and thus possibly allow for end-2-end (E2E) automation principles as known in a cloud-native world (which scope wise is more limited than the full telco stack). This assumes that an E2E automation goal makes economical and operational sense compared to domain-oriented automation (with domains not per see matching one to one the traditional telco network layers). While it is tempting to get all enthusiastic & winded-up about the role of artificial intelligence (AI) in telco (or any other) automation framework, it always make sense to take an ice cold shower and read up on non-AI based automation schemes as we have them in a cloud-native cloud environment before jumping into the rabbit hole. I also think that we should be very careful architecturally to spread intelligent agents all over our telco architecture and telco stack. AI will have an important mission in pro-active customer experience solutions and anomaly detection. The devil may be in how we close the loop of an intelligent agent’s output and a input to our automation framework.
To summarize what’s coming for the Telco sector;
Increased softwarization (or virtualization) moving from traditional platform layers out towards the edge.
Increased leveraging of cloud models (e.g., private, public, hybrid) following the path of softwarization.
Strive towards cloud-native operations including the obvious benefits from (non-AI based) automation that the cloud-native framework brings.
We will see a lot of focus on developing automation principles across the telco stack to the extend such will be different from cloud-native principles (note: expect there will be some at least for non-Greenfield implementations but also in general as the telco stack is not idem ditto a traditional platform stack). This may be hampered by lack of architectural standardization alignment across our industry. There is a risk that we will push for AI-based automation without exploring fully what non-AI based schemes may bring.
Inevitable the industry will spend much more efforts on developing cognitive-based pro-active customer experience solutions as well as expanding anomaly detection across the full telco stack. This will help in dealing with design complexities although might also be hampered by mis-alignment on standardization. Not to mention that AI should never become an excuse to not simplify designs and architectures.
Plus anything clever that I have not thought about or forgot to mention 🙂
So yes … softwarization, cloudification and aggressive (non-AI based) automation, known from platform-centric businesses, will be coming (in fact has arrived to an extend) for Telcos … over time and earlier for the few new brave Telco Greenfields …
Artificial intelligence based solutions will have a mission in pro-active customer experience (e.g., cellwize, uhana, …), zero-touch predictive maintenance, self-restoration & healing, and for advanced anomaly detection solutions (e.g., see Anodot as a leading example here). All are critical requirements in the new (and obviously in the old as well) telco world is being eaten by software. Self-learning “conscious” (defined in a relative narrow technical sense) anomaly detection solutions across the telco stack is in my opinion a must to deal with today’s and the future’s highly complex software architectures and systems.
I am also speculating whether intelligent agents (e.g., microagents reacting to an events) may make the telco layers less reliant on top-down control and orchestration (… I am also getting goosebumps by that idea … so maybe this is not good … hmmm … or I am cold … but then again orchestration is for non-trusting control “freaks”). Such a reactive microagent (or microservice) could take away the typical challenges with stack orchestration (e.g., blocking, waiting, …), decentralize control across the telco stack.
And no … we will not become Ubers … although there might be Ubers that will try to become us … The future will show …
Acknowledgement.
I also greatly acknowledge my wife Eva Varadi for her support, patience and understanding during the creative process of writing this Blog. Also many of my Deutsche Telekom AG, T-Mobile NL & Industry colleagues in general have in countless of ways contributed to my thinking and ideas leading to this little Blog. Thank you!
Further reading
Mike Isaac, “Super Pumped – The Battle for Uber”, 2019, W.W. Norton & Company. A good read and what starts to look like a rule of a Silicon Valley startup behavior (the very worst and of course some of the best). Irrespective of the impression this book leaves with me, I am also deeply impressed (maybe even more after reading the book;-) what Uber’s engineers have been pulling off over the last couple of years.
Chris Anderson, “Free – The Future of a Radical Price”, (2009), Hyperion eBook. This is one of the coolest books I have read on the topic of freemium, sharing economy and platform-based business models. A real revelations and indeed a confirmation that if you get something for free, you are likely not a customer but a product. A must read to understand the work around us. In this setting it is also worth reading “What is a Free Customer Worth?” by Sunil Gupta & Carl F. Mela (HBR, 2008).
Sangeet Paul Choudary, “Platform Scale”, (2015), Platform Thinking Labs Pte. Ltd. A must read for anyone thinking of developing a platform based business. Contains very good detailed end-2-end platform design recommendations. If you are interested in knowing the most important aspects of Platform business models and don’t have time for more academic deep dive, this is most likely the best book to read.
Laure Claire Reillier & Benout Reillier, “Platform Strategy”, (2017), Routledge Taylor & Francis Group. Very systematic treatment of platform economics and all strategic aspects of a platform business. It contains a fairly comprehensive overview of academic works related to platform business models and economics (that is if you want to go deeper than for example Choudary’s excellent “Platform Scale” above).
Jean-Charles Rochet & Jean Tirole, “Platform Competition in Two-sided Markets” (2003), Journal of the European Economic Association, 1, 990. Rochet & Tirole formalizes the economics of two-sided markets. The math is fairly benign but requires a mathematical background. Beside the math their paper contains some good descriptions of platform economics.
Todd W. Schneider, “Taxi and Ridehailing Usage in New York City”, a cool site that provides historical and up-to-date taxi and ride hailing usage data for New York and Chicago. This gives very interesting insights into the competitive dynamics of Uber / Ride hailing platform businesses vs the classical taxi business. It also shows that while ride hailing businesses have disrupted the taxi business in totality, being a driver for a ride hailing platform is not that great either (and as Uber continues to operate at impressive losses maybe also not for Uber either at least in their current structure).
Uber Engineeringis in general a great resource for platform / stack architecture, system design, machine learning, big data & forecasting solutions for a business model relying on real-time transactions. While I personally find the Uber architecture or system design too complex it is nevertheless an impressive solution that Uber has developed. There are many noteworthy blog posts to be found on the Uber Engineering site. Here is a couple of foundational ones (both from 2016 so please be aware that lots may have changed since then) “The Uber Engineering Tech Stack, Part I: The Foundation” (Lucie Lozinski, 2016) and “The Uber Engineering Tech Stack, Part II: The Edge and Beyond” (Lucie Lozinski, 2016) . I also found “Uber’s Big Data Platform: 100+ Petabytes with Minute Latency” post (by Reza Shiftehfar, 2018) very interesting in describing the historical development and considerations Uber went through in their big data platform as their business grew and scale became a challenge in their designs. This is really a learning resource.
Wireless One, “Rakuten: Japan’s new #4 is going all cloud”, 2019. Having had the privilege to visit Rakuten in Japan and listen to their chief-visionary Tareq Amin (CTO) they clearly start from being a platform-centric business (i.e., Asia’s Amazon.com) with the ambition to become a new breed of telco levering their platform technologies (and platform business model thinking) all the way out to the edge of the mobile base station antenna. While I love that Tareq Amin actually has gone and taken his vision from powerpoint to reality, I also think that Rakuten benefits (particular many of the advertised economical benefits) from being more a Greenfield telco than an established telco with a long history and legacy. In this respect it is humbling that their biggest stumbling block or challenge for launching their services is site rollout (yes touchy-feel infrastructure & real estate is a b*tch!). See also “Rakuten taking limited orders for services on its delayed Japan mobile network” (October, 2019).
Justin Garrison & Chris Nova, “Cloud Native Infrastructure”, 2018, O’Reilly and Kief Morris, “Infrastructure as Code”, 2016, O’Reilly. I am usually using both these books as my reference books when it comes to cloud native topics and refreshing my knowledge (and hopefully a bit of understanding).
Murat Uenlue, “The Complete Guide to the Revolutionary Platform Business Model”, 2017. Good read. Provides a great overview of platform business models and attempts systematically categorize platform businesses (e.g., Communications Platform, Social Platform, Search Platform, Open OS Platforms, Service Platforms, Asset Sharing Platforms, Payment Platforms, etc….).


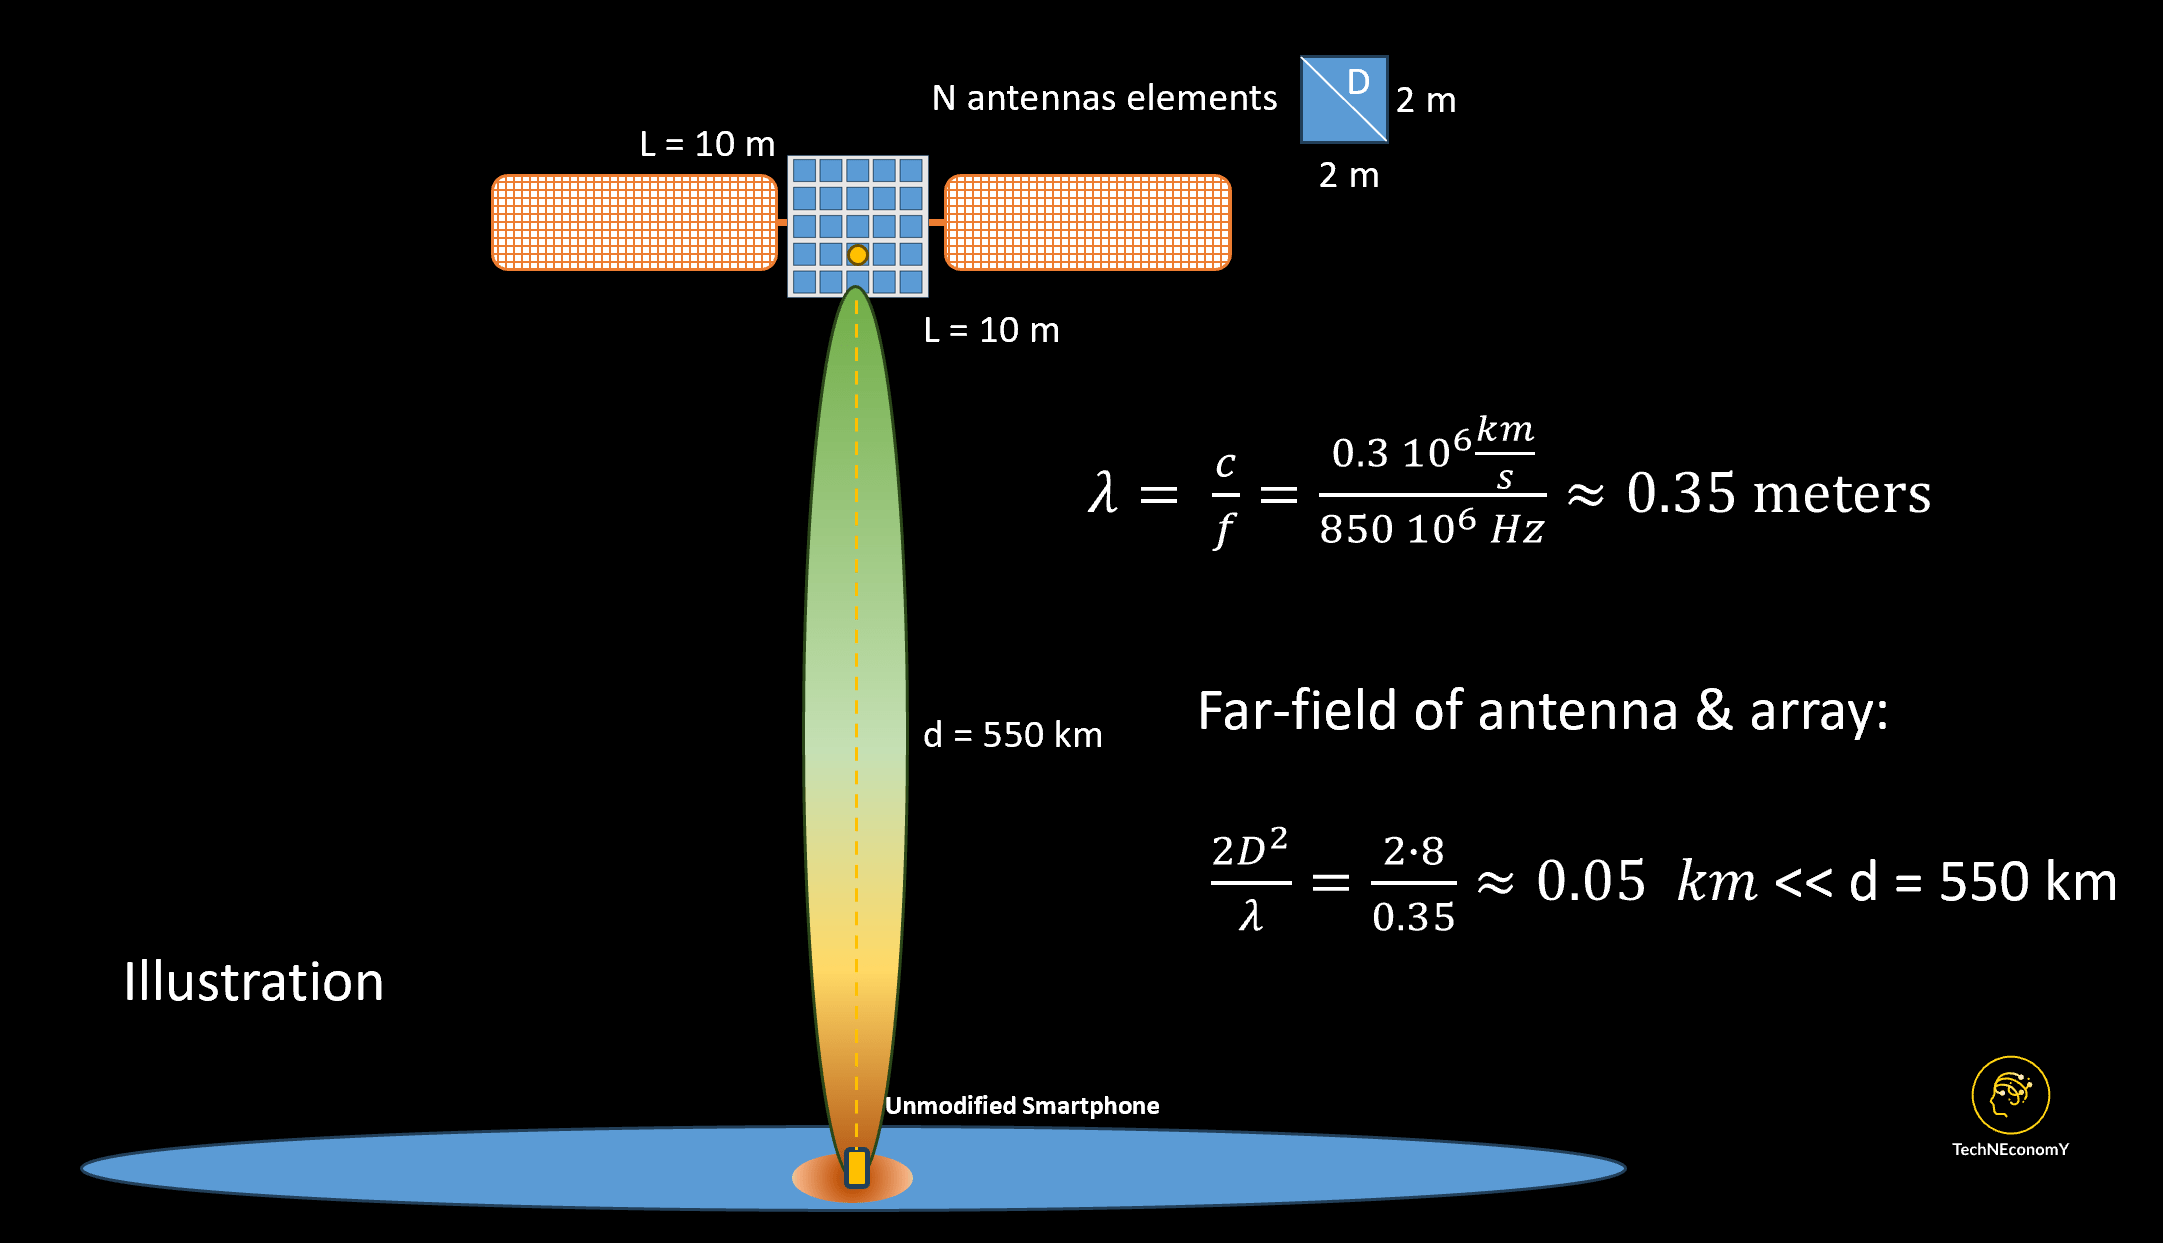


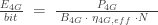 and
and 
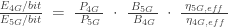


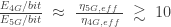


 package allowing the customer to consume up to 3 GB is priced at 20 (irrespective of whether the customer would consume less). For package
  a consumer would pay 100 for a data consumption allowance up to 35 GB. Of course, we assume that the consumer choosing this package would generally consume more than 24 GB, which is the next cheaper package (i.e.,
  ).
). , could increase consumption with 4 GB (+50%) before considering the next level price plan (i.e.,


![CV_X \; - \; CV_Y \; = \; \Delta Capex \; \left[ \frac{1 \; - \; g}{\; WACC \; - \; g \;} \right]](https://s0.wp.com/latex.php?latex=CV_X+%5C%3B+-+%5C%3B+CV_Y+%5C%3B+%3D+%5C%3B+%5CDelta+Capex+%5C%3B+%5Cleft%5B+%5Cfrac%7B1+%5C%3B+-+%5C%3B+g%7D%7B%5C%3B+WACC+%5C%3B+-+%5C%3B+g+%5C%3B%7D+%5Cright%5D&bg=ffffff&fg=333333&s=0&c=20201002)


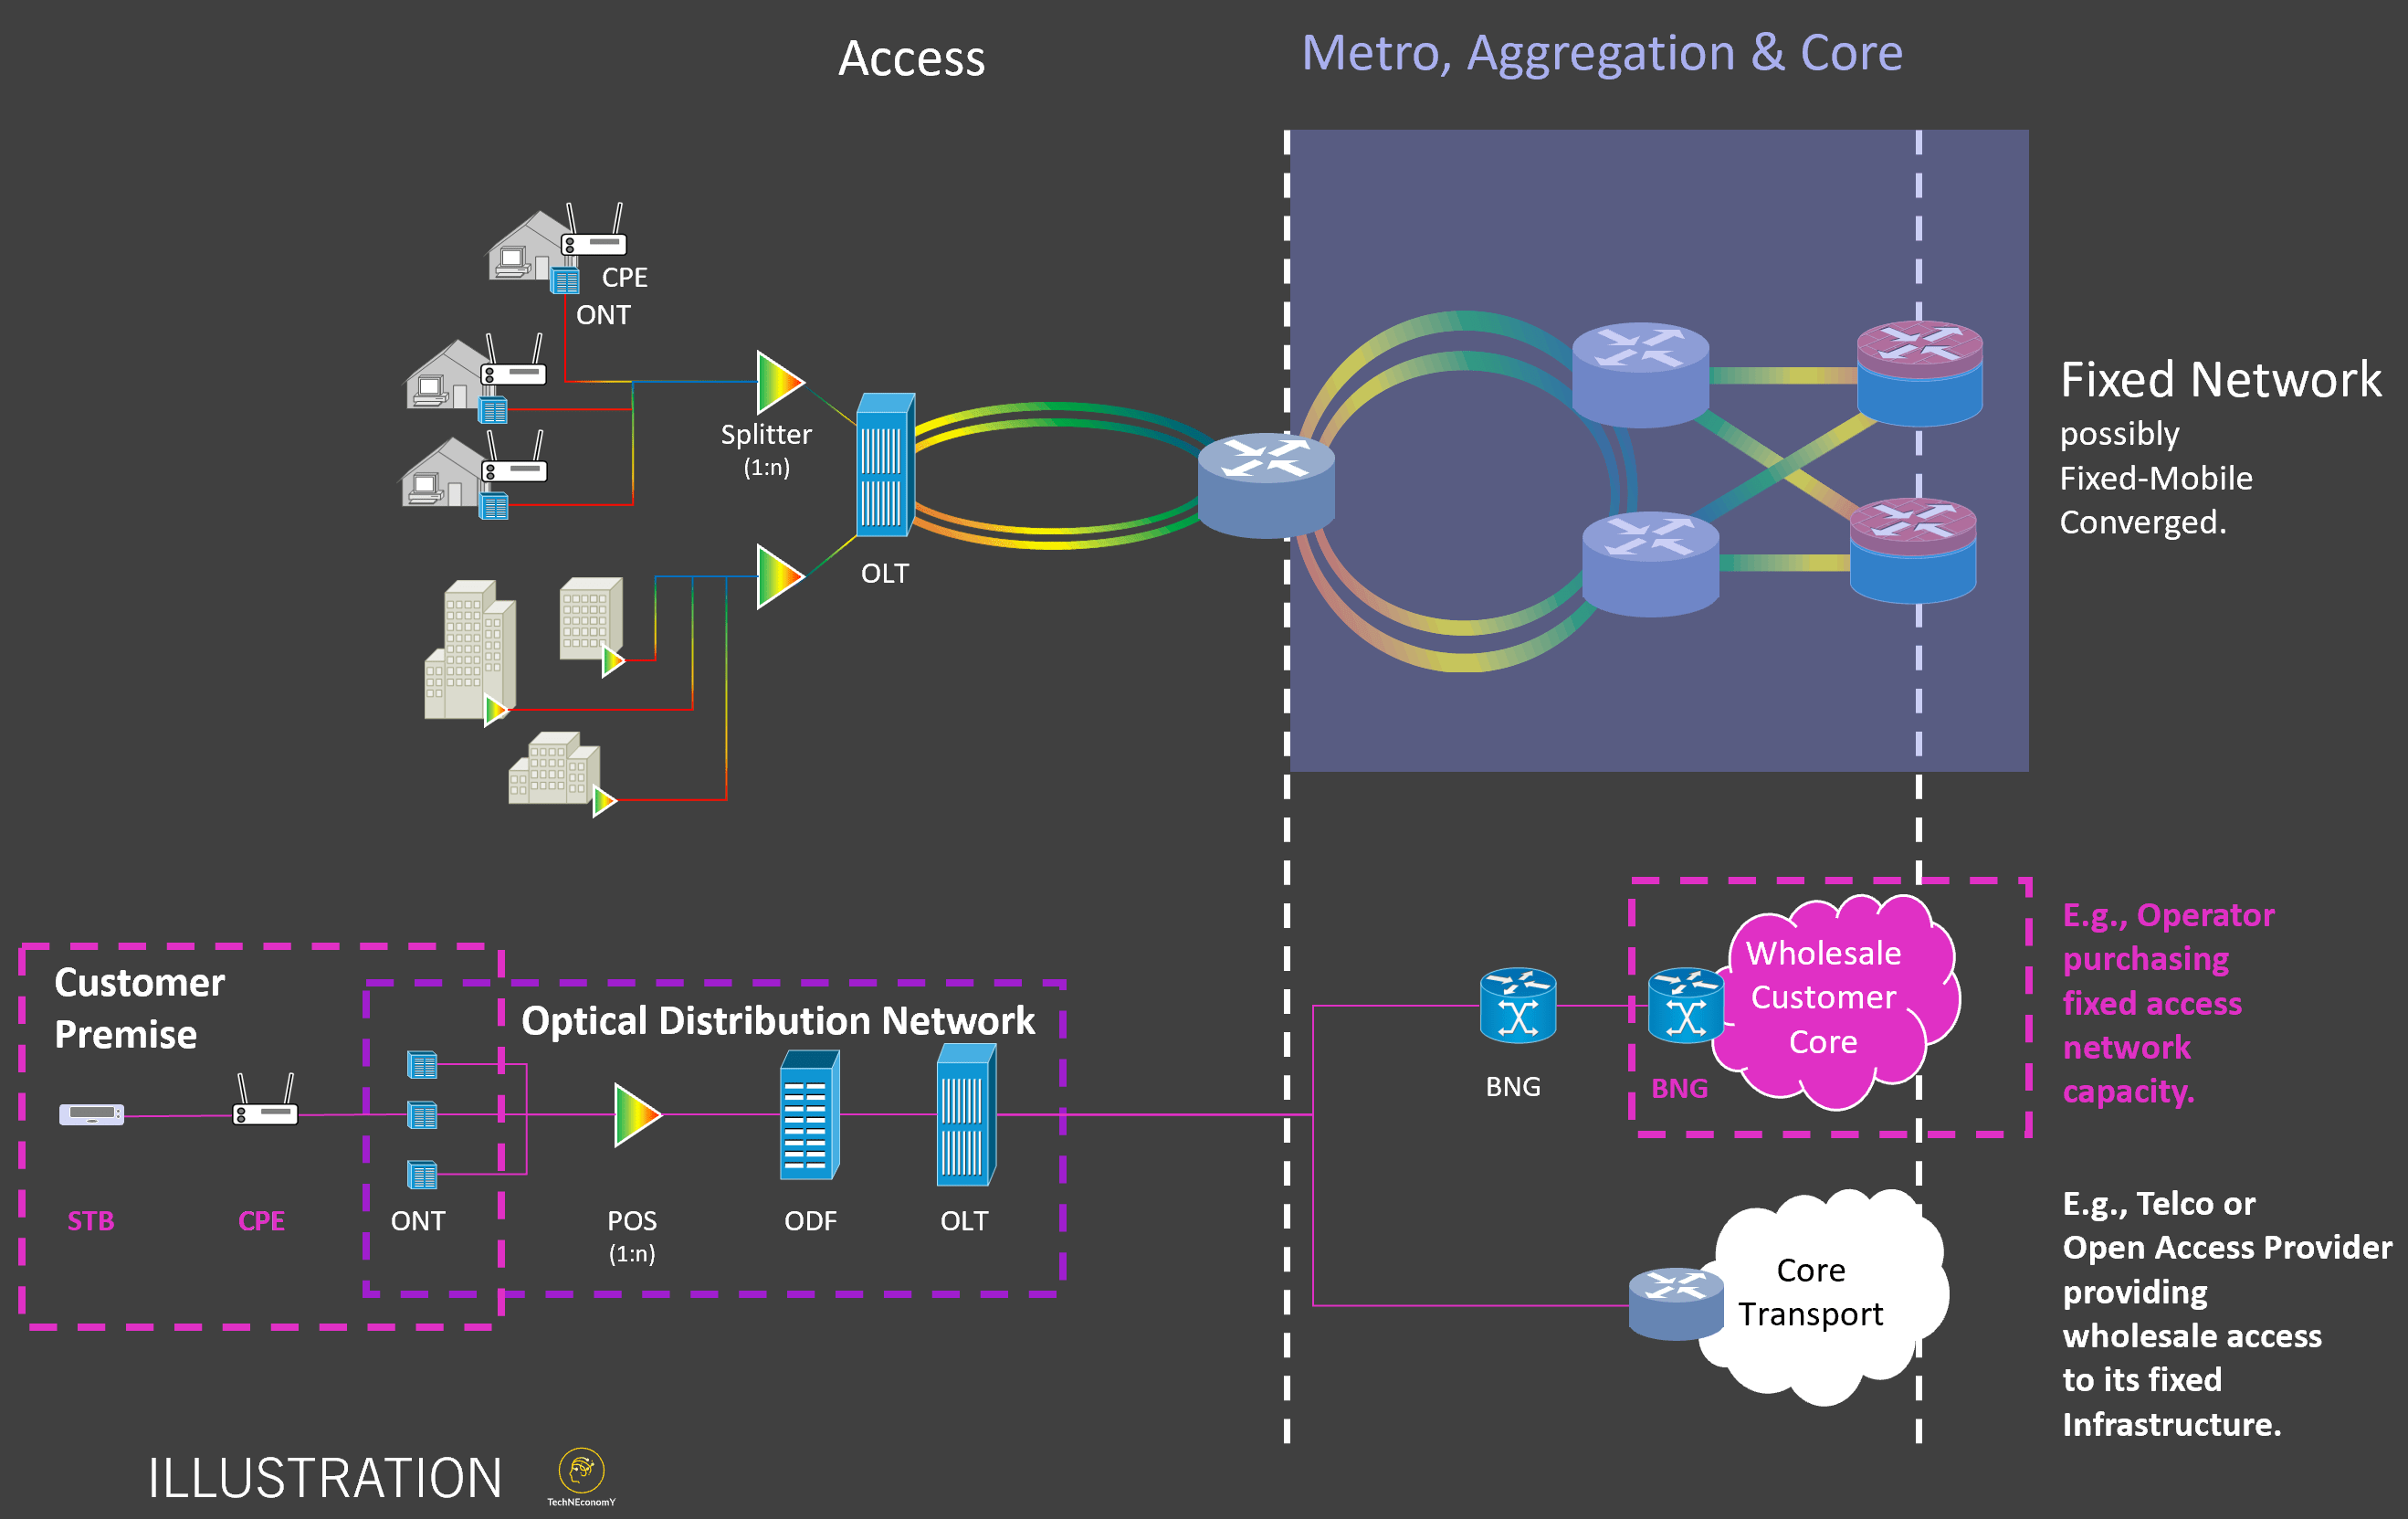


 or
or  ) is the direct driver of network load, and thus, network investments, the volumetric demand, is a manifestation of that throughput demand.
 being the number of active users in a given radio cell at the time-instant of unit t taken within a day.
  is the Bytes consumed in a time instant (e.g., typically a second); thus, 8
  bits/sec) in the same instant and take the maximum across. For example, a day provides the busiest hour throughput for the whole network. Each radio cell drives its capacity provision and supply (in bits/sec) and the investments required to provide that demanded capacity in the air interface and front- and back-haul.
 ) given in bits per second, the basic building block of quality, is relatively easy to estimate. The cellular throughput (per unit cell) is provided by the amount of committed frequency spectrum to the air interface, what your radio access network and antenna support are, multiplied by the so-called spectral efficiency in bits per Hz per cell. The spectral efficiency depends on the antenna technology and the underlying software implementation of signal processing schemes enabling the details of receiving and sending signals over the air interface.
 of ca. 20 Mbps/MHz/cell (i.e.,
  ), we should expect to have a cell throughput on average at 1,000 Mbps (1 Gbps).