Stratospheric Drones & Low Earth Satellites: Revolutionizing Terrestrial Rural Broadband from the Skies?

“From an economic and customer experience standpoint, deploying stratospheric drones may be significantly more cost effective than establishing extra terrestrial infrastructures”.

This article, in a different and somewhat shorter format, has also been published by New Street Research under the title “Stratospheric drones: A game changer for rural networks?”. You will need to register with New Street Research to get access.

As a mobile cellular industry expert and a techno-economist, the first time I was presented with the concept of stratospheric drones, I feel the butterflies in my belly. That tingling feeling that I was seeing something that could be a huge disruptor of how mobile cellular networks are being designed and built. Imagine getting rid of the profitability-challenged rural cellular networks (i.e., the towers, the energy consumption, the capital infrastructure investments), and, at the same time, offering much better quality to customers in rural areas than is possible with the existing cellular network we have deployed there. A technology that could fundamentally change the industry’s mobile cellular cost structure for the better at a quantum leap in quality and, in general, provide economical broadband services to the unconnected at a fraction of the cost of our traditional ways of building terrestrial cellular coverage.

Back in 2015, I got involved with Deutsche Telekom AG Group Technology, under the leadership of Bruno Jacobfeuerborn, in working out the detailed operational plans, deployment strategies, and, of course, the business case as well as general economics of building a stratospheric cellular coverage platform from scratch with the UK-based Stratospheric Platform Ltd [2] in which Deutsche Telekom is an investor. The investment thesis was really in the way we expected the stratospheric high-altitude platform to make a large part of mobile operators’ terrestrial rural cellular networks obsolete and how it might strengthen mobile operator footprints in countries where rural and remote coverage was either very weak or non-existing (e.g., The USA, an important market for Deutsche Telekom AG).

At the time, our thoughts were to have an operational stratospheric coverage platform operationally by 2025, 10 years after kicking off the program, with more than 100 high-altitude platforms covering a major Western European country serving rural areas. As it so often is, reality is unforgiving, as it often is with genuinely disruptive ideas. Getting to a stage of deployment and operation at scale of a high-altitude platform is still some years out due to the lack of maturity of the flight platform, including regulatory approvals for operating a HAP network at scale, increasing the operating window of the flight platform, fueling, technology challenges with the advanced antenna system, being allowed to deployed terrestrial-based cellular spectrum above terra firma, etc. Many of these challenges are progressing well, although slowly.

Globally, various companies are actively working on developing stratospheric drones to enhance cellular coverage. These include aerospace and defense giants like Airbus, advancing its Zephyr drone, and BAE Systems, collaborating with Prismatic for their PHASA-35 UAV. One of the most exciting HAPS companies focusing on developing world-leading high-altitude aircraft that I have come across during my planning work on how to operationalize a Stratospheric cellular coverage platform is the German company Leichtwerk AG, which has their hydrogen-fueled StratoStreamer as well as a solar-powered platform under development with the their StratoStreamer being close to production-ready. Telecom companies like Deutsche Telekom AG and BT Group are experimenting with hydrogen-powered drones in partnership with Stratospheric Platforms Limited. Through its subsidiary HAPSMobile, SoftBank is also a significant player with its Sunglider project. Additionally, entities like China Aerospace Science and Technology Corporation and Cambridge Consultants contribute to this field by co-developing enabling technologies (e.g., advanced phased-array antenna, fuel technologies, material science, …) critical for the success and deployability of high-altitude platforms at scale, aiming to improve connectivity in rural, remote, and underserved areas.

The work on integrating High Altitude Platform (HAP) networks with terrestrial cellular systems involves significant coordination with international regulatory bodies like the International Telecommunication Union Radiocommunication Sector (ITU-R) and the World Radiocommunication Conference (WRC). This process is crucial for securing permission to reuse terrestrial cellular spectrum in the stratosphere. Key focus areas include negotiating the allocation and management of frequency bands for HAP systems, ensuring they don’t interfere with terrestrial networks. These efforts are vital for successfully deploying and operating HAP systems, enabling them to provide enhanced connectivity globally, especially in rural areas where terrestrial cellular frequencies are already in use and remote and underserved regions. At the latest WRC-2023 conference, Softbank successfully gained approval within the Asia-Pacific region to use mobile spectrum bands for stratospheric drone-based mobile broadband cellular services.

Most mobile operators have at least 50% of their cellular network infrastructure assets in rural areas. While necessary for providing the coverage that mobile customers have come to expect everywhere, these sites carry only a fraction of the total mobile traffic. Individually, rural sites have poor financial returns due to their proportional operational and capital expenses.

In general, the Opex of the cellular network takes up between 50% and 60% of the Technology Opex, and at least 50% of that can be attributed to maintaining and operating the rural part of the radio access network. Capex is more cyclical than Opex due to, for example, the modernization of radio access technology. Nevertheless, over a typical modernization cycle (5 to 7 years), the rural network demands a little bit less but a similar share of Capex overall as for Opex. Typically, the Opex share of the rural cellular network may be around 10% of the corporate Opex, and its associated total cost is between 12% and 15% of the total expenses.

The global telecom towers market size in 2023 is estimated at ca. 26+ billion euros, ca. 2.5% of total telecom turnover, with a projected growth of CAGR 3.3% from now to 2030. The top 10 Tower management companies manage close to 1 million towers worldwide for mobile CSPs. Although many mobile operators have chosen to spin off their passive site infrastructure, there are still some remaining that may yet to spin off their cellular infrastructure to one of many Tower management companies, captive or independent, such as American Tower (224,019+ towers), Cellnex Telecom (112,737+ towers), Vantage Towers (46,100+ towers), GD Towers (+41,600 towers), etc…

IMAGINE.

Focusing on the low- or no-profitable rural cellular coverage.

Imagine an alternative coverage technology to the normal cellular one all mobile operators are using that would allow them to do without the costly and low-profitable rural cellular network they have today to satisfy their customers’ expectations of high-quality ubiquitous cellular coverage.

For the alternative technology to be attractive, it would need to deliver at least the same quality and capacity as the existing terrestrial-based cellular coverage for substantially better economics.

If a mobile operator with a 40% EBITDA margin did not need its rural cellular network, it could improve its margin by a sustainable 5% and increase its cash generation in relative terms by 50% (i.e., from 0.2×Revenue to 0.3×Revenue), assuming a capex-to-revenue ratio of 20% before implementing the technology being reduced to 15% after due to avoiding modernization and capacity investments in the rural areas.

Imagine that the alternative technology would provide a better cellular quality to the consumer for a quantum leap reduction of the associated cost structure compared to today’s cellular networks.

Such an alternative coverage technology might also impact the global tower companies’ absolute level of sustainable tower revenues, with a substantial proportion of revenue related to rural site infrastructure being at risk.

Figure 1 An example of an unmanned autonomous stratospheric coverage platform. Source: Cambridge Consultants presentation (see reference [2]) based on their work with Stratospheric Platforms Ltd (SPL) and SPL’s innovative high-altitude coverage platform.

TERRESTRIAL CELLULAR RURAL COVERAGE – A MATTER OF POOR ECONOMICS.

When considering the quality we experience in a terrestrial cellular network, a comprehensive understanding of various environmental and physical factors is crucial to predicting the signal quality accurately. All these factors generally work against cellular signal propagation regarding how far the signal can reach from the transmitting cellular tower and the achievable quality (e.g., signal strength) that a customer can experience from a cellular service.

Firstly, the terrain plays a significant role. Rural landscapes often include varied topographies such as hills, valleys, and flat plains, each affecting signal reach differently. For instance, hilly or mountainous areas may cause signal shadowing and reflection, while flat terrains might offer less obstruction, enabling signals to travel further.

At higher frequencies (i.e., above 1 GHz), vegetation becomes an increasingly critical factor to consider. Trees, forests, and other dense foliage can absorb and scatter radio waves, attenuating signals. The type and density of vegetation, along with seasonal changes like foliage density in summer versus winter, can significantly impact signal strength.

The height and placement of transmitting and receiving antennas are also vital considerations. In rural areas, where there are fewer tall buildings, the height of the antenna can have a pronounced effect on the line of sight and, consequently, on the signal coverage and quality. Elevated antennas mitigate the impact of terrain and vegetation to some extent.

Furthermore, the lower density of buildings in rural areas means fewer reflections and less multipath interference than in urban environments. However, larger structures, such as farm buildings or industrial facilities, must be factored in, as they can obstruct or reflect signals.

Finally, the distance between the transmitter and receiver is fundamental to signal propagation. With typically fewer cell towers spread over larger distances, understanding how signal strength diminishes with distance is critical to ensuring reliable coverage at a high quality, such as high cellular throughput, as the mobile customer expects.

The typical way for a cellular operator to mitigate the environmental and physical factors that inevitably result in loss of signal strength and reduced cellular quality (i.e., sub-standard cellular speed) is to build more sites and thus incur increasing Capex and Opex in areas that in general will have poor economical payback associated with any cellular assets. Thus, such investments make an already poor economic situation even worse as the rural cellular network generally would have very low utilization.

Figure 2 Cellular capacity or quality measured by the unit or total throughput is approximately driven by the amount of spectrum (in MHz) times the effective spectral efficiency (in Mbps/MHz/units) times the number of cells or capacity units deployed. When considering the effective spectral efficiency, one needs to consider the possible “boost” that a higher order MiMo or Advanced Antenna System will bring over and above the Single In Single Out (SISO) antenna would result in.

As our alternative technology also would need to provide at least the same quality and capacity it is worth exploring what can be expected in terms of rural terrestrial capacity. In general, we have that the cellular capacity (and quality) can be written as (also shown in Figure 2 above):

Throughput (in Mbps) =
Spectral Bandwidth in MHz ×
Effective Spectral Efficiency in Mbps/MHz/Cell ×
Number of Cells

We need to keep in mind that an additional important factor when considering quality and capacity is that the higher the operational frequency, the lower the radius (all else being equal). Typically, we can improve the radius at higher frequencies by utilizing advanced antenna beam forming, that is, concentrate the radiated power per unit coverage area, which is why you will often hear that the 3.6 GHz downlink coverage radius is similar to that of 1800 MHz (or PCS). This 3.6 GHz vs. 1.8 GHz coverage radius comparison is made when not all else is equal. Comparing a situation where the 1800 MHz (or PCS) radiated power is spread out over the whole coverage area compared to a coverage situation where the 3.6 GHz (or C-band in general) solution makes use of beamforming, where the transmitted energy density is high, allowing to reach the customer at a range that would not be possible if the 3.6 GHz radiated power would have been spread out over the cell like the example of the 1800 MHz.

As an example, take an average Western European rural 5G site with all cellular bands between 700 and 2100 MHz activated. The site will have a total of 85 MHz DL and 75 MHz UL, with a 10 MHz difference between DL and UL due to band 38 Supplementary Downlink SDL) operational on the site. In our example, we will be optimistic and assume that the effective spectral efficiency is 2 Mbps per MHz per cell (average over all bands and antenna configurations), which would indicate a fair amount of 4×4 and 8×8 MiMo antenna systems deployed. Thus, the unit throughput we would expect to be supplied by the terrestrial rural cell would be 170 Mbps (i.e., 85 MHz × 2.0 Mbps/MHz/Cell). With a rural cell coverage radius between 2 and 3 km, we then have an average throughput per square kilometer of 9 Mbps/km2. Due to the low demand and high-frequency bandwidth per active customer, DL speeds exceeding 100+ Mbps should be relatively easy to sustain with 5G standalone, with uplink speeds being more compromised due to larger coverage areas. Obviously, the rural quality can be improved further by deploying advanced antenna systems and increasing the share of higher-order MiMo antennas in general, as well as increasing the rural site density. However, as already pointed out, this would not be an economically reasonable approach.

THE ADVANTAGE OF SEEING FROM ABOVE.

Figure 3 illustrates the difference between terrestrial cellular coverage from a cell tower and that of a stratospheric drone or high-altitude platform (“Antenna-in-the-Sky”). The benefit of seeing the world from above is that environmental and physical factors have substantially less impact on signal propagation and quality primarily being impacted by distance as it approximates free space propagation. This situation is very different for a terrestrial-based cellular tower with its radiated signal being substantially impacted by the environment as well as physical factors.

It may sound silly to talk about an alternative coverage technology that could replace the need for the cellular tower infrastructure that today is critical for providing mobile broadband coverage to, for example, rural areas. What alternative coverage technologies should we consider?

If, instead of relying on terrestrial-based tower infrastructure, we could move the cellular antenna and possibly the radio node itself to the sky, we would have a situation where most points of the ground would be in the line of sight to the “antenna-in-the-sky.” The antenna in the sky idea is a game changer in terms of coverage itself compared to conventional terrestrial cellular coverage, where environmental and physical factors dramatically reduce signal propagation and signal quality.

The key advantage of an antenna in the sky (AIS) is that the likelihood of a line-of-sight to a point on the ground is very high compared to establishing a line-of-sight for terrestrial cellular coverage that, in general, would be very low. In other words, the cellular signal propagation from an AIS closely approximates that of free space. Thus, all the various environmental signal loss factors we must consider for a standard terrestrial-based mobile network do not apply to our antenna in the sky.

Over the last ten years, we have gotten several technology candidates for our antenna-in-the-sky solution, aiming to provide terrestrial broadband services as a substitute, or enhancement, for terrestrial mobile and fixed broadband services. In the following, I will describe two distinct types of antenna-in-the-sky solutions: (a) Low Earth Orbit (LEO) satellites, operating between 500 to 2000 km above Earth, that provide terrestrial broadband services such as we know from Starlink (SpaceX), OneWeb (Eutelsat Group), and Kuiper (Amazon), and (b) So-called, High Altitude Platforms (HAPS), operating at altitudes between 15 to 30 km (i.e., in the stratosphere). Such platforms are still in the research and trial stages but are very promising technologies to substitute or enhance rural network broadband services. The HAP is supposed to be unmanned, highly autonomous, and ultimately operational in the stratosphere for an extended period (weeks to months), fueled by green hydrogen and possibly solar. The high-altitude platform is thus also an unmanned aerial vehicle (UAV), although I will use the term stratospheric drone and HAP interchangeably in the following.

Low Earth Orbit (LEO) satellites and High Altitude Platforms (HAPs) represent two distinct approaches to providing high-altitude communication and observation services. LEO satellites, operating between 500 km and 2,000 km above the Earth, orbit the planet, offering broad global coverage. The LEO satellite platform is ideal for applications like satellite broadband internet, Earth observation, and global positioning systems. However, deploying and maintaining these satellites involves complex, costly space missions and sophisticated ground control. Although, as SpaceX has demonstrated with the Starlink LEO satellite fixed broadband platform, the unitary economics of their satellites significantly improve by scale when the launch cost is also considered (i.e., number of satellites).

Figure 4 illustrates a non-terrestrial network architecture consisting of a Low Earth Orbit (LEO) satellite constellation providing fixed broadband services to terrestrial users. Each hexagon represents a satellite beam inside the larger satellite coverage area. Note that, in general, there will be some coverage overlap between individual satellites, ensuring a continuous service including interconnected satellites. The user terminal (UT) dynamically aligns itself, aiming at the best quality connection provided by the satellites within the UT field of vision.

Figure 4 Illustrating a Non-Terrestrial Network consisting of a Low Earth Orbit (LEO) satellite constellation providing fixed broadband services to terrestrial users (e.g., Starlink, Kuiper, OneWeb,…). Each hexagon represents a satellite beam inside the larger satellite coverage area. Note that, in general, there will be some coverage overlap between individual satellites, ensuring a continuous service. The operating altitude of a LEO satellite constellation is between 300 and 2,000 km. It is assumed that the satellites are interconnected, e.g., laser links. The User Terminal antenna (UT) is dynamically orienting itself after the best line-of-sight (in terms of signal quality) to a satellite within UT’s field-of-view (FoV). The FoV has not been shown in the picture above so as not to overcomplicate the illustration. It should be noted just like with the drone it is possible to integrate the complete gNB on the LEO satellite. There might even be applications (e.g., defense, natural & unnatural disaster situations, …) where a standalone 5G SA core is integrated.

On the other hand, HAPs, such as unmanned (autonomous) stratospheric drones, operate at altitudes of approximately 15 km to 30 km in the stratosphere. Unlike LEO satellites, the stratospheric drone can hover or move slowly over specific areas, often geostationary relative to the Earth’s surface. This characteristic makes them more suitable for localized coverage tasks like regional broadband, surveillance, and environmental monitoring. The deployment and maintenance of the stratospheric drones are managed from the Earth’s surface and do not require space launch capabilities. Furthermore, enhancing and upgrading the HAPs is straightforward, as they will regularly be on the ground for fueling and maintenance. Upgrades are not possible with an operational LEO satellite solution where any upgrade would have to wait on a subsequent generation and new launch.

Figure 5 illustrates the high-level network architecture of an unmanned autonomous stratospheric drone-based constellation providing terrestrial cellular broadband services to terrestrial mobile users delivered to their normal 5G terminal equipment. Each hexagon represents a beam arising from the phased-array antenna integrated into the drone’s wingspan. To deliver very high-availability services to a rural area, one could assign three HAPs to cover a given area. The drone-based non-terrestrial network is drawn consistent with the architectural radio access network (RAN) elements from Open RAN, e.g., Radio Unit (RU), Distributed Unit (DU), and Central Unit (CU). It should be noted that the whole 5G gNB (the 5G NodeB), including the CU, could be integrated into the stratospheric drone, and in fact, so could the 5G standalone (SA) packet core, enabling full private mobile 5G networks for defense and disaster scenarios or providing coverage in very remote areas with little possibility of ground-based infrastructure (e.g., the arctic region, or desert and mountainous areas).

Figure 5 illustrates a Non-Terrestrial Network consisting of a stratospheric High Altitude Platform (HAP) drone-based constellation providing terrestrial Cellular broadband services to terrestrial mobile users delivered to their normal 5G terminal equipment. Each hexagon represents a beam inside the larger coverage area of the stratospheric drone. To deliver very high-availability services to a rural area, one could assign three HAPs to cover a given area. The operating altitude of a HAP constellation is between 10 to 50 km with an optimum of around 20 km. It is assumed that there is inter-HAP connectivity, e.g., via laser links. Of course, it is also possible to contemplate having the gNB (full 5G radio node) in the stratospheric drone entirely, which would allow easier integration with LEO satellite backhauls, for example. There might even be applications (e.g., defense, natural & unnatural disaster situations, …) where a standalone 5G SA core is integrated.

The unique advantage of the HAP operating in the stratosphere is (1) The altitude is advantageous for providing wider-area cellular coverage with a near-ideal quality above and beyond what is possible with conventional terrestrial-based cellular coverage because of very high line-of-sight likelihood due to less environment and physical issues that substantially reduces the signal propagation and quality of a terrestrial coverage solution, and (2) More stable atmospheric conditions characterize the stratosphere compared to the troposphere below it. This stability allows the stratospheric drone to maintain a consistent position and altitude with less energy expenditure. The stratosphere offers more consistent and direct sunlight exposure for a solar-powered HAP with less atmospheric attenuation. Moreover, due to the thinner atmosphere at stratospheric altitudes, the stratospheric drone will experience a lower air resistance (drag), increasing the energy efficiency and, therefore, increasing the operational airtime.

Figure 6 illustrates Leichtwerk AG’s StratoStreamer HAP design that is near-production ready. Leichtwerk AG works closely together with AESA towards the type certificate that would make it possible to operationalize a drone constellation in Europe. The StratoStreamer has a wingspan of 65 meter and can carry a payload of 100+ kg. Courtesy: Leichtwerk AG.

Each of these solutions has its unique advantages and limitations. LEO satellites provide extensive coverage but come with higher operational complexities and costs. HAPs offer more focused coverage and are easier to manage, but they need the global reach of LEO satellites. The choice between these two depends on the specific requirements of the intended application, including coverage area, budget, and infrastructure capabilities.

In an era where digital connectivity is indispensable, stratospheric drones could emerge as a game-changing technology. These unmanned (autonomous) drones, operating in the stratosphere, offer unique operational and economic advantages over terrestrial networks and are even seen as competitive alternatives to low earth orbit (LEO) satellite networks like Starlink or OneWeb.

STRATOSPHERIC DRONES VS TERRESTRIAL NETWORKS.

Stratospheric drones positioned much closer to the Earth’s surface than satellites, provide distinct signal strength and latency benefits. The HAP’s vantage point in the stratosphere (around 20 km above the Earth) ensures a high probability of line-of-sight with terrestrial user devices, mitigating the adverse effects of terrain obstacles that frequently challenge ground-based networks. This capability is particularly beneficial in rural areas in general and mountainous or densely forested areas, where conventional cellular towers struggle to provide consistent coverage.

Why the stratosphere? The stratosphere is the layer of Earth’s atmosphere located above the troposphere, which is the layer where weather occurs. The stratosphere is generally characterized by stable, dry conditions with very little water vapor and minimal horizontal winds. It is also home to the ozone layer, which absorbs and filters out most of the Sun’s harmful ultraviolet radiation. It is also above the altitude of commercial air traffic, which typically flies at altitudes ranging from approximately 9 to 12 kilometers (30,000 to 40,000 feet). These conditions (in addition to those mentioned above) make operating a stratospheric platform very advantageous.

Figure 6 illustrates the coverage fundamentals of (a) a terrestrial cellular radio network with the signal strength and quality degrading increasingly as one moves away from the antenna and (b) the terrestrial coverage from a stratospheric drone (antenna in the sky) flying at an altitude of 15 to 30 km. The stratospheric drone, also called a High-Altitude Platform (HAP), provides near-ideal signal strength and quality due to direct line-of-sight (LoS) with the ground, compared to the signal and quality from a terrestrial cellular site that is influenced by its environment and physical factors and the fact that LoS is much less likely in a conventional terrestrial cellular network. It is worth keeping in mind that the coverage scenarios where a stratospheric drone and a low earth satellite may excel in particular are in rural areas and outdoor coverage in more dense urban areas. In urban areas, the clutter, or environmental features and objects, will make line-of-site more challenging, impacting the strength and quality of the radio signals.

Figure 6 The chart above illustrates the coverage fundamentals of (a) a terrestrial cellular radio network with the signal strength and quality degrading increasingly as one moves away from the antenna and (b) the terrestrial coverage from a stratospheric drone (antenna in the sky) flying at an altitude of 15 to 30 km. The stratospheric drone, also called a High Altitude Platform (HAP), provides near-ideal signal strength and quality due to direct line-of-sight (LoS) with the ground, compared to the signal & quality from a terrestrial cellular site that is influenced by its environment and physical factors and the fact that LoS is much less likely in a conventional terrestrial cellular network.

From an economic and customer experience standpoint, deploying stratospheric drones may be significantly more cost-effective than establishing extensive terrestrial infrastructure, especially in remote or rural areas. The setup and operational costs of cellular towers, including land acquisition, construction, and maintenance, are substantially higher compared to the deployment of stratospheric drones. These aerial platforms, once airborne, can cover vast geographical areas, potentially rendering numerous terrestrial towers redundant. At an operating height of 20 km, one would expect a coverage radius ranging from 20 km up to 500 km, depending on the antenna system, application, and business model (e.g., terrestrial broadband services, surveillance, environmental monitoring, …).

The stratospheric drone-based coverage platform, and by platform, I mean the complete infrastructure that will replace the terrestrial cellular network, will consist of unmanned autonomous drones with a considerable wingspan (e.g., 747-like of ca. 69 meters). For example, European (German) Leichtwerk’s StratoStreamer has a wingspan of 65 meters and a wing area of 197 square meters with a payload of 120+ kg (note: in comparison a Boing 747 has ca. 500+ m2 wing area but its payload is obviously much much higher and in the range of 50 to 60 metric tons). Leichtwerk AG work closely together with AESA in order to achieve the European Union Aviation Safety Agency (EASA) type certificate that would allow the HAPS to integrate into civil airspace (see refs. [34] for what that means).

An advanced antenna system is positioned under the wings (or the belly) of the drone. I will assume that the coverage radius provided by a single drone is 50 km, but it can dynamically be made smaller or larger depending on the coverage scenario and use case. The drone-based advanced antenna system breaks up the coverage area (ca. six thousand five hundred plus square kilometers) into 400 patches (i.e., a number that can be increased substantially), averaging approx. 16 km2 per patch and a radius of ca. 2.5 km. Due to its near-ideal cellular link budget, the effective spectral efficiency is expected to be initially around 6 Mbps per MHz per cell. Additionally, the drone does not have the same spectrum limitations as a rural terrestrial site and would be able to support frequency bands in the downlink from ~900 MHz up to 3.9 GHz (and possibly higher, although likely with different antenna designs). Due to the HAP altitude, the Earth-to-HAP uplink signal will be limited to a lower frequency spectrum to ensure good signal quality is being received at the stratospheric antenna. It is prudent to assume a limit of 2.1 GHz to possibly 2.6 GHz. All under the assumption that the stratospheric drone operator has achieved regulatory approval for operating the terrestrial cellular spectrum from their coverage platform. It should be noted that today, cellular frequency spectrum approved for terrestrial use cannot be used at an altitude unless regulatory permission has been given (more on this later).

Let’s look at an example. We would need ca. 46 drones to cover the whole of Germany with the above-assumed specifications. Furthermore, if we take the average spectrum portfolio of the 3 main German operators, this will imply that the stratospheric drone could be functioning with up to 145 MHz in downlink and at least 55 MHz uplink (i.e., limiting UL to include 2.1 GHz). Using the HAP DL spectral efficiency and coverage area we get a throughput density of 70+ Mbps/km2 and an effective rural cell throughput of 870 Mbps. In terrestrial-based cellular coverage, the contribution to quality at higher frequencies is rapidly degrading as a function of the distance to the antenna. This is not the case for HAP-based coverage due to its near-ideal signal propagation.

In comparison, the three incumbent German operators have on average ca. 30±4k sites per operator with an average terrestrial coverage area of 12 km2 and a coverage radius of ca. 2.0 km (i.e., smaller in cities, ~1.3 km, larger in rural areas, ~2.7 km). Assume that the average cost of ownership related only to the passive part of the site is 20+ thousand euros and that 50% of the 30k sites (expect a higher number) would be redundant as the rural coverage would be replaced by stratospheric drones. Such a site reduction quantum conservatively would lead to a minimum gross monetary reduction of 300 million euros annually (not considering the cost of the alternative technology coverage solution).

In our example, the question is whether we can operate a stratospheric drone-based platform covering rural Germany for less than 300 million euros yearly. Let’s examine this question. Say the stratospheric drone price is 1 million euros per piece (similar to the current Starlink satellite price, excluding the launch cost, which would add another 1.1 million euros to the satellite cost). For redundancy and availability purposes, we assume we need 100 stratospheric drones to cover rural Germany, allowing me to decommission in the radius of 15 thousand rural terrestrial sites. The decommissioning cost and economical right timing of tower contract termination need to be considered. Due to the standard long-term contracts may be 5 (optimistic) to 10+ years (realistic) year before the rural network termination could be completed. Many Telecom businesses that have spun out their passive site infrastructure have done so in mutual captivity with the Tower management company and may have committed to very “sticky” contracts that have very little flexibility in terms of site termination at scale (e.g., 2% annually allowed over total portfolio).

We have a capital expense of 100 million for the stratospheric drones.  We also have to establish the support infrastructure (e.g., ground stations, airfield suitability rework, development, …), and consider operational expenses. The ballpark figure for this cost would be around 100 million euros for Capex for establishing the supporting infrastructure and another 30 million euros in annual operational expenses. In terms of steady-state Capex, it should be at most 20 million per year. In our example, the terrestrial rural network would have cost 3 billion euros, mainly Opex, over ten years compared to 700 million euros, a little less than half as Opex, for the stratospheric drone-based platform (not considering inflation).

The economical requirements of a stratospheric unmanned and autonomous drone-based coverage platform should be superior compared to the current cellular terrestrial coverage platform. As the stratospheric coverage platform scales and increasingly more stratospheric drones are deployed, the unit price is also likely to reduce accordingly.

Spectrum usage rights yet another critical piece.

It should be emphasized that the deployment of cellular frequency spectrum in stratospheric and LEO satellite contexts is governed by a combination of technical feasibility, regulatory frameworks, coordination to prevent interference, and operational needs. The ITU, along with national regulatory bodies, plays a central role in deciding the operational possibilities and balancing the needs and concerns of various stakeholders, including satellite operators, terrestrial network providers, and other spectrum users. Today, there are many restrictions and direct regulatory prohibitions in repurposing terrestrially assigned cellular frequencies for non-terrestrial purposes.

The role of the World Radiocommunications Conference (WRC) role is pivotal in managing the global radio-frequency spectrum and satellite orbits. Its decisions directly impact the development and deployment of various radiocommunication services worldwide, ensuring their efficient operation and preventing interference across borders. The WRC’s work is fundamental to the smooth functioning of global communication networks, from television and radio broadcasting to cellular networks and satellite-based services. The WRC is typically held every three to four years, with the latest one, WRC-23, held in Dubai at the end of 2023, reference [13] provides the provisional final acts of WRC-23 (December 2023). In landmark recommendation, WRC-23 relaxed the terrestrial-only conditions for the 698 to 960 MHz and 1,71 to 2.17 GHz, and 2.5 to 2.69 GHz frequency bands to also apply for high-altitude platform stations (HAPS) base stations (“Antennas-in -Sky”). It should be noted that there are slightly different frequency band ranges and conditions, depending on which of the three ITU-R regions (as well as exceptions for particular countries within a region) the system will be deployed in. Also the HAPS systems do not enjoy protection or priority over existing use of those frequency bands terrestrially. It is important to note that the WRC-23 recommendation only apply to coverage platforms (i.e., HAPS) in the range from 20 to 50 km altitude. These WRC-23 frequency-bands relaxation does not apply to satellite operation. With the recognized importance of non-terrestrial networks and the current standardization efforts (e.g., towards 6G), it is expected that the fairly restrictive regime on terrestrial cellular spectrum may be relaxed further to also allow mobile terrestrial spectrum to be used in “Antenna-in-the-Sky” coverage platforms. Nevertheless, HAPS and terrestrial use of cellular frequency spectrum will have to be coordinated to avoid interference and resulting capacity and quality degradation.

SoftBank announced recently (i.e., 28 December 2023 [11]), after deliberations at the WRC-23, that they had successfully gained approval within the Asia-Pacific region (i.e., ITU-R region 3) to use mobile spectrum bands, namely 700-900MHz, 1.7GHz, and 2.5GHz, for stratospheric drone-based mobile broadband cellular services (see also refs. [13]). As a result of this decision, operators in different countries and regions will be able to choose a spectrum with greater flexibility when they introduce HAPS-based mobile broadband communication services, thereby enabling seamless usage with existing smartphones and other devices.

Another example of re-using terrestrial licensed cellular spectrum above ground is SpaceX direct-to-cell capable 2nd generation Starlink satellites.

On January 2nd, 2024, SpaceX launched their new generation of Starlink satellites with direct-to-cell capabilities to close a connection to a regular mobile cellular phone (e.g., smartphone). The new direct-to-cell Starlink satellites use T-Mobile US terrestrial licensed cellular frequency band (i.e., 2×5 MHz Band 25, PCS G-block) and will work, according to T-Mobile US, with most of their existing mobile phones. The initial direct-to-cell commercial plans will only support low-bandwidth text messaging and no voice or more bandwidth-heavy applications (e.g., streaming). Expectations are that the direct-to-cell system would deliver up to 18.3 Mbps (3.66 Mbps/MHz/cell) downlink and up to 7.2 Mbps (1.44 Mbps/MHz/cell) uplink over a channel bandwidth of 5 MHz (maximum).

Given that terrestrial 4G LTE systems struggle with such performance, it will be super interesting to see what the actual performance of the direct-to-cell satellite constellation will be.

COMPARISON WITH LEO SATELLITE BROADBAND NETWORKS.

When juxtaposed with LEO satellite networks such as Starlink (SpaceX), OneWeb (Eutelsat Group), or Kuiper (Amazon), stratospheric drones offer several advantages. Firstly, the proximity to the Earth’s surface (i.e., 300 – 2,000 km) results in lower latency, a critical factor for real-time applications. While LEO satellites, like those used by Starlink, have reduced latency (ca. 3 ms round-trip-time) compared to traditional geostationary satellites (ca. 240 ms round-trip-time), stratospheric drones can provide even quicker response times (one-tenth of an ms in round-trip-time), making the stratospheric drone substantially more beneficial for applications such as emergency services, telemedicine, and high-speed internet services.

A stratospheric platform operating at 20 km altitude and targeting surveillance, all else being equal, would be 25 times better at distinguishing objects apart than an LEO satellite operating at 500 km altitude. The global aerial imaging market is expected to exceed 7 billion euros by 2030, with a CAGR of 14.2% from 2021. The flexibility of the stratospheric drone platform allows for combining cellular broadband services and a wide range of advanced aerial imaging services. Again, it is advantageous that the stratospheric drone regularly returns to Earth for fueling, maintenance, and technology upgrades and enhancements. This is not possible with an LEO satellite platform.

Moreover, the deployment and maintenance of stratospheric drones are, in theory, less complex and costly than launching and maintaining a constellation of satellites. While Starlink and similar projects require significant upfront investment for satellite manufacturing and rocket launches, stratospheric drones can be deployed at a fraction of the cost, making them a more economically viable option for many applications.

The Starlink LEO satellite constellation currently is the most comprehensive satellite (fixed) broadband coverage service. As of November 2023, Starlink had more than 5,000 satellites in low orbit (i.e., ca. 550 km altitude), and an additional 7,000+ are planned to be deployed, with a total target of 12+ thousand satellites. The current generation of Starlink satellites has three downlink phased-array antennas and one uplink phase-array antenna. This specification translates into 48 beams downlink (satellite to ground) and 16 beams uplink (ground to satellite). Each Starlink beam covers approx. 2,800 km2 with a coverage range of ca. 30 km, over which a 250 MHz downlink channel (in the Ku band) has been assigned. According to Portillo et al. [14], the spectral efficiency is estimated to be 2.7 Mbps per MHz, providing a total throughput of a maximum of 675 Mbps in the coverage area or a throughput density of ca. 0.24 Mbps per km2.

According to the latest Q2-2023 Ookla speed test it is found that “among the 27 European countries that were surveyed, Starlink had median download speeds greater than 100 Mbps in 14 countries, greater than 90 Mbps in 20 countries, and greater than 80 in 24 countries, with only three countries failing to reach 70 Mbps” (see reference [18]). Of course, the actual customer experience will depend on the number of concurrent users demanding resources from the LEO satellite as well as weather conditions, proximity of other users, etc. Starlink themselves seem to have set an upper limit of 220 Mbps download speed for their so-called priority service plan or otherwise 100 Mbps (see [19] below). Quite impressive performance if there are no other broadband alternatives available.

According to Elon Musk, SpaceX aims to reduce each Starlink satellite’s cost to less than one million euros. However, according to Elon Musk, the unit price will depend on the design, capabilities, and production volume. The launch cost using the SpaceX Falcon 9 launch vehicle starts at around 57 million euros, and thus, the 50 satellites would add a launch cost of ca. 1.1 million euros per satellite. SpaceX operates, as of September 2023, 150 ground stations (“Starlink Gateways”) globally that continue to connect the satellite network with the internet and ground operations. At Starlink’s operational altitude, the estimated satellite lifetime is between 5 and 7 years due to orbital decay, fuel and propulsion system exhaustion, and component durability. Thus, a LEO satellite business must plan for satellite replacement cycles. This situation differs greatly from the stratospheric drone-based operation, where the vehicles can be continuously maintained and upgraded. Thus, they are significantly more durable, with an expected useful lifetime exceeding ten years and possibly even 20 years of operational use.

Let’s consider our example of Germany and what it would take to provide LEO satellite coverage service targeting rural areas. It is important to understand that a LEO satellite travels at very high speeds (e.g., upwards of 30 thousand km per hour) and thus completes an orbit around Earth in between 90 to 120 minutes (depending on the satellite’s altitude). It is even more important to remember that Earth rotates on its axis (i.e., 24 hours for a full rotation), and the targeted coverage area will have moved compared to a given satellite orbit (this can easily be several hundreds to thousands of kilometers). Thus, to ensure continuous satellite broadband coverage of the same area on Earth, we need a certain number of satellites in a particular orbit and several orbits to ensure continuous coverage at a target area on Earth. We would need at least 210 satellites to provide continuous coverage of Germany. Most of the time, most satellites would not cover Germany, and the operational satellite utilization will be very low unless other areas outside Germany are also being serviced.

Economically, using the Starlink numbers above as a guide, we incur a capital expense of upwards of 450 million euros to realize a satellite constellation that could cover Germany. Let’s also assume that the LEO satellite broadband operator (e.g., Starlink) must build and launch 20 satellites annually to maintain its constellation and thus incur an additional Capex of ca. 40+ million euros annually. This amount does not account for the Capex required to build the ground network and the operations center. Let’s say all the rest requires an additional 10 million euros Capex to realize and for miscellaneous going forward. The technology-related operational expenses should be low, at most 30 million euros annually (this is a guesstimate!) and likely less. So, covering Germany with an LEO broadband satellite platform over ten years would cost ca. 1.3 billion euros. Although substantially more costly than our stratospheric drone platform, it is still less costly than running a rural terrestrial mobile broadband network.

Despite being favorable compared in economic to the terrestrial cellular network, it is highly unlikely to make any operational and economic sense for a single operator to finance such a network, and it would probably only make sense if shared between telecom operators in a country and even more so over multiple countries or states (e.g., European Union, United States, PRC, …).

Despite the implied silliness of a single mobile operator deploying a satellite constellation for a single Western European country (irrespective of it being fairly large), the above example serves two purposes; (1) To illustrates how economically in-efficient rural mobile networks are that a fairly expansive satellite constellation could be more favorable. Keep in mind that most countries have 3 or 4 of them, and (2) It also shows that the for operators to share the economics of a LEO satellite constellation over larger areal footprint may make such a strategy very attractive economically,

Due to the path loss at 550 km (LEO) being substantially higher than at 20 km (stratosphere), all else being equal, the signal quality of the stratospheric broadband drone would be significantly better than that of the LEO satellite. However, designing the LEO satellite with more powerful transmitters and sensitive receivers can compensate for the factor of almost 30 in altitude difference to a certain extent. Clearly, the latency performance of the LEO satellite constellation would be inferior to that of the stratospheric drone-based platform due to the significantly higher operating altitude.

It is, however, the capacity rather than shared cost could be the stumbling block for LEOs: For a rural cellular network or stratospheric drone platform, we see the MNOs effectively having “control” over the capex costs of the network, whether it be the RAN element for a terrestrial network, or the cost of whole drone network (even if it in the future, this might be able to become a shared cost).

However, for the LEO constellation, we think the economics of a single MNO building a LEO constellation even for their own market is almost entirely out of the question (ie multiple €bn capex outlay). Hence, in this situation, the MNOs will rely on a global LEO provider (ie Starlink, or AST Space Mobile) and will “lend” their spectrum to their in their respective geography in order to provide service. Like the HAPs, this will also require further regulatory approvals in order to free up terrestrial spectrum for satellites in rural areas.

We do not yet have the visibility of the payments the LEOs will require, so there is the potential that this could be a lower cost alternative again to rural networks, but as we show below, we think the real limitation for LEOs might not be the shared capacity rental cost, but that there simply won’t be enough capacity available to replicate what a terrestrial network can offer today.

However, the stratospheric drone-based platform provides a near-ideal cellular performance to the consumer, close to the theoretical peak performance of a terrestrial cellular network. It should be emphasized that the theoretical peak cellular performance is typically only experienced, if at all, by consumers if they are very near the terrestrial cellular antenna and in a near free-space propagation environment. This situation is a very rare occurrence for the vast majority of mobile consumers.

Figure 7 summarizes the above comparison between a rural terrestrial cellular network with the non-terrestrial cellular networks such as LEO satellites and Stratospheric drones.

Figure 7 Illustrating a comparison between terrestrial cellular coverage with stratospheric drone-based (“Antenna-in-the-sky”) cellular coverage and Low Earth Orbit (LEO) satellite coverage options.

While the majority of the 5,500+ Starlink constellation is 13 GHz (Ku-band), at the beginning of 2024, Space X launched a few 2nd generation Starlink satellites that support direct connections from the satellite to a normal cellular device (e.g., smartphone), using 5 MHz of T-Mobile USA’s PCS band (1900 MHz). The targeted consumer service, as expressed by T-Mobile USA, is providing texting capabilities over areas with no or poor existing cellular coverage across the USA. This is fairly similar to services at similar cellular coverage areas presently offered by, for example, AST SpaceMobile, OmniSpace, and Lynk Global LEO satellite services with reported maximum speed approaching 20 Mbps. The so-called Direct-2-Device, where the device is a normal smartphone without satellite connectivity functionality, is expected to develop rapidly over the next 10 years and continue to increase the supported user speeds (i.e., utilized terrestrial cellular spectrum) and system capacity in terms of smaller coverage areas and higher number of satellite beams.

Table 1 below provides an overview of the top 10 LEO satellite constellations targeting (fixed) internet services (e.g., Ku band), IoT and M2M services, and Direct-to-Device (or direct-to-cell) services. The data has been compiled from the NewSpace Index website, which should be with data as of 31st of December 2023. The Top-10 satellite constellation rank has been based on the number of launched satellites until the end of 2023. Two additional Direct-2-Cell (D2C or Direct-to-Device, D2D) LEO satellite constellations are planned for 2024-2025. One is SpaceX Starlink 2nd generation, which launched at the beginning of 2024, using T-Mobile USA’s PCS Band to connect (D2D) to normal terrestrial cellular handsets. The other D2D (D2C) service is Inmarsat’s Orchestra satellite constellation based on L-band (for mobile terrestrial services) and Ka for fixed broadband services. One new constellation (Mangata Networks) targeting 5G services. With two 5G constellations already launched, i.e., Galaxy Space (Yinhe) launched 8 LEO satellites, 1,000 planned using Q- and V-bands (i.e., not a D2D cellular 5G service), and OmniSpace launched two satellites and have planned 200 in total. Moreover, currently, there is one planned constellation targeting 6G by the South Korean Hanwha Group (a bit premature, but interesting nevertheless) with 2,000 6G LEO Satellites planned. Most currently launched and planned satellite constellations offering (or plan to provide) Direct-2-Cell services, including IoT and M2M, are designed for low-frequency bandwidth services that are unlikely to compete with terrestrial cellular networks’ quality of service where reasonable good coverage (or better) exists.

In Table 1 below, we then show 5 different services with the key input variables as cell radius, spectral efficiency and downlink spectrum. From this we can derive what the “average” capacity could be per square kilometer of rural coverage.

We focus on this metric as the best measure of capacity available once multiple users are on the service the spectrum available is shared. This is different from “peak” speeds which are only relevant in the case of very few users per cell.

  • We start with terrestrial cellular today for bands up to 2.1GHz and show that assuming a 2.5km cell radius, the average capacity is equivalent to 11Mbps per sq.km.
  • For a LEO service using Ku-band, i.e., with 250MHz to an FWA dish, the capacity could be ca. 2Mbps per sq.km.
  • For a LEO-based D2D device, what is unknown is what the ultimate spectrum allowance could be for satellite services with cellular spectrum bands, and spectral efficiency. Giving the benefit of the doubt on both, but assuming the beam radius is always going to be larger, we can get to an “optimistic” future target of 2Mbps per sq. km, i.e., 1/5th of a rural terrestrial network.
  • Finally, we show for a stratospheric drone, that given similar cell radius to a rural cell today, but with higher downlink available and greater spectral efficiency, we can reach ca. 55Mbps per sq. km, i.e. 5x what a current rural network can offer.

INTEGRATING WITH 5G AND BEYOND.

The advent of 5G, and eventually 6G, technology brings another dimension to the utility of stratospheric drones delivering mobile broadband services. The high-altitude platform’s ability to seamlessly integrate with existing 5G networks makes them an attractive option for expanding coverage and enhancing network capacity at superior economics, particularly in rural areas where the economics for terrestrial-based cellular coverage tend to be poor. Unlike terrestrial networks that require extensive groundwork for 5G rollout, the non-terrestrial network operator (NTNO) can rapidly deploy stratospheric drones to provide immediate 5G coverage over large areas. The high-altitude platform is also incredibly flexible compared to both LEO satellite constellations and conventional rural cellular network flexibility. The platform can easily be upgraded during its ground maintenance window and can be enhanced as the technology evolves. For example, upgrading to and operationalizing 6G would be far more economical with a stratospheric platform than having to visit thousands or more rural sites to modernize or upgrade the installed active infrastructure.

SUMMARY.

Stratospheric drones represent a significant advancement in the realm of wireless communication. Their strategic positioning in the stratosphere offers superior coverage and connectivity compared to terrestrial networks and low-earth satellite solutions. At the same time, their economic efficiency makes them an attractive alternative to ground-based infrastructures and LEO satellite systems. As technology continues to evolve, these high-altitude platforms (HAPs) are poised to play a crucial role in shaping the future of global broadband connectivity and ultra-high availability connectivity solutions, complementing the burgeoning 5G networks and paving the way for next-generation three-dimensional communication solutions. Moving away from today’s flat-earth terrestrial-locked communication platforms.

The strategic as well as the disruptive potential of the unmanned autonomous stratospheric terrestrial coverage platform is enormous, as shown in this article. It has the potential to make most of the rural (at least) cellular infrastructure redundant, resulting in substantial operational and economic benefits to existing mobile operators. At the same time, the HAPs could, in rural areas, provide much better service overall in terms of availability, improved coverage, and near-ideal speeds compared to what is the case in today’s cellular networks. It might also, at scale, become a serious competitive and economical threat to LEO satellite constellations, such as, for example, Starlink and Kuipers, that would struggle to compete on service quality and capacity compared to a stratospheric coverage platform.

Although the strategic, economic, as well as disruptive potential of the unmanned autonomous stratospheric terrestrial coverage platform is enormous, as shown in this article, the flight platform and advanced antenna technology are still in a relatively early development phase. Substantial regulatory work remains in terms of permitting the terrestrial cellular spectrum to be re-used above terra firma at the “Antenna-in-the-Sky. The latest developments out of WRC-23 for Asia Pacific appear very promising, showing that we are moving in the right direction of re-using terrestrial cellular spectrum in high-altitude coverage platforms. Last but not least, operating an unmanned (autonomous) stratospheric platform involves obtaining certifications as well as permissions and complying with various flight regulations at both national and international levels.

Terrestrial Mobile Broadband Network – takeaway:

  • It is the de facto practice for mobile cellular networks to cover nearly 100% geographically. The mobile consumer expects a high-quality, high-availability service everywhere.
  • A terrestrial mobile network has a relatively low area coverage per unit antenna with relatively high capacity and quality.
  • Mobile operators incur high and sustainable infrastructure costs, especially in rural areas with low or no return on that cost.
  • Physical obstructions and terrain limit performance (i.e., non-free space characteristics).
  • Well-established technology with high reliability.
  • The potential for high bandwidth and low latency in urban areas with high demand may become a limiting factor for LEO satellite constellations and stratospheric drone-based platforms. Thus, it is less likely to provide operational and economic benefits covering high-demand, dense urban, and urban areas.

LEO Satellite Network – takeaway:

  • The technology is operational and improving. There is currently some competition (e.g., Starlink, Kuiper, OneWeb, etc.) in this space, primarily targeting fixed broadband and satellite backhaul services. Increasingly, new LEO satellite-based business models are launched providing lower-bandwidth cellular-spectrum based direct-to-device (D2D) text, 4G and 5G services to regular consumer and IoT devices (i.e., Starlink, Lynk Global, AST SpaceMobile, OmniSpace, …).
  • Broader coverage, suitable for global reach. It may only make sense when the business model is viewed from a worldwide reach perspective (e.g., Starlink, OneWeb,…), resulting in much-increased satellite network utilization.
  • An LEO satellite broadband network can cover a vast area per satellite due to its high altitude. However, such systems are in nature capacity-limited, although beam-forming antenna technologies (e.g., phased array antennas) allow better capacity utilization.
  • The LEO satellite solutions are best suited for low-population areas with limited demand, such as rural and largely unpopulated areas (e.g., sea areas, deserts, coastlines, Greenland, polar areas, etc.).
  • Much higher latency compared to terrestrial and drone-based networks. 
  • Less flexible once in orbit. Upgrades and modernization only via replacement.
  • The LEO satellite has a limited useful operational lifetime due to its lower orbital altitude (e.g., 5 to 7 years).
  • Lower infrastructure cost for rural coverage compared to terrestrial networks, but substantially higher than drones when targeting regional areas (e.g., Germany or individual countries in general).
  • Complementary to the existing mobile business model of communications service providers (CSPs) with a substantial business risk to CSPs in low-population areas where little to no capacity limitations may occur.
  • Requires regulatory permission (authorization) to operate terrestrial frequencies on the satellite platform over any given country. This process is overseen by national regulatory bodies in coordination with the International Telecommunication Union (ITU) as well as national regulators (e.g., FCC in the USA). Satellite operators must apply for frequency bands for uplink and downlink communications and coordinate with the ITU to avoid interference with other satellites and terrestrial systems. In recent years, however, there has been a trend towards more flexible spectrum regulations, allowing for innovative uses of the spectrum like integrating terrestrial and satellite services. This flexibility is crucial in accommodating new technologies and service models.
  • Operating a LEO satellite constellation requires a comprehensive set of permissions and certifications that encompass international and national space regulations, frequency allocation, launch authorization, adherence to space debris mitigation guidelines, and various liability and insurance requirements.
  • Both LEO and MEO satellites is likely going to be complementary or supplementary to stratospheric drone-based broadband cellular networks offering high-performing transport solutions and possible even acts as standalone or integrated (with terrestrial networks) 5G core networks or “clouds-in-the-sky”.

Stratospheric Drone-Based Network – takeaway:

  • It is an emerging technology with ongoing research, trials, and proof of concept.
  • A stratospheric drone-based broadband network will have lower deployment costs than terrestrial and LEO satellite broadband networks.
  • In rural areas, the stratospheric drone-based broadband network offers better economics and near-ideal quality than terrestrial mobile networks. In terms of cell size and capacity, it can easily match that of a rural mobile network.
  • The solution offers flexibility and versatility and can be geographically repositioned as needed. The versatility provides a much broader business model than “just” an alternative rural coverage solution (e.g., aerial imaging, surveillance, defense scenarios, disaster area support, etc.).
  • Reduced latency compared to LEO satellites.
  • Also ideal for targeted or temporary coverage needs.
  • Complementary to the existing mobile business model of communications service providers (CSPs) with additional B2B and public services business potential from its application versatility.
  • Potential substantial negative impact on the telecom tower business as the stratospheric drone-based broadband network would make (at least) rural terrestrial towers redundant.
  • May disrupt a substantial part of the LEO satellite business model due to better service quality and capacity leaving the LEO satellite constellations revenue pool to remote areas and specialized use cases.
  • Requires regulatory permission to operate terrestrial frequencies (i.e., frequency authorization) on the stratospheric drone platform (similar to LEO satellites). Big steps have are already been made at the latest WRC-23, where the frequency bands 698 to 960 MHz, 1710 to 2170 MHz, and 2500 to 2690 MHz has been relaxed to allow for use in HAPS operating at 20 to 50 km altitude (i.e., the stratosphere).
  • Operating a stratospheric platform in European airspace involves obtaining certifications as well as permissions and (of course) complying with various regulations at both national and international levels. This includes the European Union Aviation Safety Agency (EASA) type certification and the national civil aviation authorities in Europe.

FURTHER READING.

  1. New Street Research “Stratospheric drones: A game changer for rural networks?” (January 2024).
  2. https://hapsalliance.org/
  3. https://www.stratosphericplatforms.com/, see also “Beaming 5G from the stratosphere” (June, 2023) and “Cambridge Consultants building the world’s largest  commercial airborne antenna” (2021).
  4. Iain Morris, “Deutsche Telekom bets on giant flying antenna”, Light Reading (October 2020).
  5. “Deutsche Telekom and Stratospheric Platforms Limited (SPL) show Cellular communications service from the Stratosphere” (November 2020).
  6. “High Altitude Platform Systems: Towers in the Skies” (June 2021).
  7. “Stratospheric Platforms successfully trials 5G network coverage from HAPS vehicle” (March 2022).
  8. Leichtwerk AG, “High Altitude Platform Stations (HAPS) – A Future Key Element of Broadband Infrastructure” (2023). I recommend to closely follow Leichtwerk AG which is a world champion in making advanced gliding planes. The hydrogen powered StratoStreamer HAP is near-production ready, and they are currently working on a solar-powered platform. Germany is renowned for producing some of the best gliding planes in the world (after WWII Germany was banned from developing and producing aircrafts, military as well as civil. These restrictions was only relaxed in the 60s). Germany has a long and distinguished history in glider development, dating back to the early 20th century. German manufacturers like Schleicher, Schempp-Hirth, and DG Flugzeugbau are among the world’s leading producers of high-quality gliders. These companies are known for their innovative designs, advanced materials, and precision engineering, contributing to Germany’s reputation in this field.
  9. Jerzy Lewandowski, “Airbus Aims to Revolutionize Global Internet Access with Stratospheric Drones” (December 2023).
  10. Utilities One, “An Elevated Approach High Altitude Platforms in Communication Strategies”, (October 2023).
  11. Rajesh Uppal, “Stratospheric drones to provide 5g wireless communications global internet border security and military surveillance”  (May 2023).
  12. Softbank, “SoftBank Corp.-led Proposal to Expand Spectrum Use for HAPS Base Stations Agreed at World Radiocommunication Conference 2023 (WRC-23)”, press release (December 2023).
  13. ITU Publication, World Radiocommunications Conference 2023 (WRC-23), Provisional Final Acts, (December 2023). Note 1: The International Telecommunication Union (ITU) divides the world into three regions for the management of radio frequency spectrum and satellite orbits: Region 1: includes Europe, Africa, the Middle East west of the Persian Gulf including Iraq, the former Soviet Union, and Mongolia, Region 2: covers the Americas, Greenland, and some of the eastern Pacific Islands, and Region 3: encompasses Asia (excl. the former Soviet Union), Australia, the southwest Pacific, and the Indian Ocean’s islands.
  14. Geoff Huston, “Starlink Protocol Performance” (November 2023). Note 2: The recommendations, such as those designated with “ADD” (additional), are typically firm in the sense that they have been agreed upon by the conference participants. However, they are subject to ratification processes in individual countries. The national regulatory authorities in each member state need to implement these recommendations in accordance with their own legal and regulatory frameworks.
  15. Curtis Arnold, “An overview of how Starlink’s Phased Array Antenna “Dishy McFlatface” works.”, LinkedIn (August 2023).
  16. Quora, “How much does a satellite cost for SpaceX’s Starlink project and what would be the cheapest way to launch it into space?” (June 2023).
  17. The Clarus Network Group, “Starlink v OneWeb – A Comprehensive Comparison” (October 2023).
  18. Brian Wang, “SpaceX Launches Starlink Direct to Phone Satellites”, (January 2024).
  19. Sergei Pekhterev, “The Bandwidth Of The StarLink Constellation…and the assessment of its potential subscriber base in the USA.”, SatMagazine, (November 2021).
  20. I. del Portillo et al., “A technical comparison of three low earth orbit satellite constellation systems to provide global broadband,” Acta Astronautica, (2019).
  21. Nils Pachler et al., “An Updated Comparison of Four Low Earth Orbit Satellite Constellation Systems to Provide Global Broadband” (2021).
  22. Shkelzen Cakaj, “The Parameters Comparison of the “Starlink” LEO Satellites Constellation for Different Orbital Shells” (May 2021).
  23. Mike Puchol, “Modeling Starlink capacity” (October 2022).
  24. Mike Dano, “T-Mobile and SpaceX want to connect regular phones to satellites”, Light Reading (August 2022).
  25. Starlink, “SpaceX sends first text message via its newly launched direct to cell satellites” (January 2024).
  26. GSMA.com, “New Speedtest Data Shows Starlink Performance is Mixed — But That’s a Good Thing” (2023).
  27. Starlink, “Starlink specifications” (Starlink.com page).
  28. AST SpaceMobile website: https://ast-science.com/ Constellation Areas: Internet, Direct-to-Cell, Space-Based Cellular Broadband, Satellite-to-Cellphone. 243 LEO satellites planned. 2 launched.
  29. Lynk Global website: https://lynk.world/ (see also FCC Order and Authorization). It should be noted that Lynk can operate within 617 to 960 MHz (Space-to-Earth) and 663 to 915 MHz (Earth-to-Space). However, only outside the USA. Constellation Area: IoT / M2M, Satellite-to-Cellphone, Internet, Direct-to-Cell. 8 LEO satellites out of 10 planned.
  30. Omnispace website: https://omnispace.com/ Constellation Area: IoT / M2M, 5G. World’s first global 5G non terrestrial network. Initial support 3GPP-defined Narrow-Band IoT radio interface. Planned 200 LEO and <15 MEO satellites. So far only 2 satellites launched.
  31. NewSpace Index: https://www.newspace.im/ I find this resource having excellent and up-to date information of commercial satellite constellations.
  32. Wikipedia, “Satellite constellation”.
  33. LEOLABS Space visualization – SpaceX Starlink mapping. (deselect “Debris”, “Beams”, and “Instruments”, and select “Follow Earth”). An alternative visualization service for Starlink & OneWeb satellites is the website Satellitemap.space (you might go to settings and turn on signal Intensity which will give you the satellite coverage hexagons).
  34. European Union Aviation Safety Agency (EASA). Note that an EASA-type Type Certificate is a critical document in the world of aviation. This certificate is a seal of approval, indicating that a particular type of aircraft, engine, or aviation component meets all the established safety and environmental standards per EASA’s stringent regulations. When an aircraft, engine, or component is awarded an EASA Type Certificate, it signifies a thorough and rigorous evaluation process that it has undergone. This process assesses everything from design and manufacturing to performance and safety aspects. The issuance of the certificate confirms that the product is safe for use in civil aviation and complies with the necessary airworthiness requirements. These requirements are essential to ensure aircraft operating in civil airspace safety and reliability. Beyond the borders of the European Union, an EASA Type Certificate is also highly regarded globally. Many countries recognize or accept these certificates, which facilitate international trade in aviation products and contribute to the global standardization of aviation safety.

ACKNOWLEDGEMENT.

I greatly acknowledge my wife, Eva Varadi, for her support, patience, and understanding during the creative process of writing this article.

I also owe a lot of gratitude to James Ratzer, Partner at New Street Research, for editorial suggestions, great discussions and challenges making the paper far better than it otherwise would have been. I would also like to thank Russel Waller, Pan European Telecoms and ESG Equity Analyst at New Street Research, for being supportive and insistent to get something written for NSR.

I also greatly appreciate my past collaboration and the many discussions on the topic of Stratospheric Drones in particular and advanced antenna designs and properties in general that I have had with Dr. Jaroslav Holis, Senior R&D Manager (Group Technology, Deutsche Telekom AG) over the last couple of years. When it comes to my early involvement in Stratospheric Drones activities with Group Technology Deutsche Telekom AG, I have to recognize my friend, mentor, and former boss, Dr. Bruno Jacobfeuerborn, former CTO Deutsche Telekom AG and Telekom Deutschland, for his passion and strong support for this activity since 2015. My friend and former colleague Rachid El Hattachi deserves the credit for “discovering” and believing in the opportunities that a cellular broadband-based stratospheric drone brings to the telecom industry.

Many thanks to CEO Dr. Reiner Kickert of Leichtwerk AG for providing some high resolution pictures of his beautiful StratoStreamer.

Thanks to my friend Amit Keren for suggesting a great quote that starts this article.

Any errors or unclarities are solely due to myself and not the collaborators and colleagues that have done their best to support this piece.

Telco energy consumption – a path to a greener future?

To my friend Rudolf van der Berg this story is not about how volumetric demand (bytes or bits) results in increased energy consumption (W·h). That notion is silly, as we both “violently” agree on ;-). I recommend that readers also check out Rudolf’s wonderful presentation, “Energy Consumption of the Internet (May 2023),” which he delivered at the RIPE86 student event this year in 2023.

Recently, I had the privilege to watch a presentation by a seasoned executive talk about what his telco company is doing for the environment regarding sustainability and CO2 reduction in general. I think the company is doing something innovative beyond compensating shortfalls with buying certificates and (mis)use of green energy resources.

They replace (reasonably) aggressively their copper infrastructure (country stat for 2022: ~90% of HH/~16% subscriptions) with green sustainable fiber (country stat for 2022: ~78%/~60%). This is an obvious strategy that results in a quantum leap in customer experience potential and helps reduce overall energy consumption resulting from operating the ancient copper network.

Missing a bit imo, was the consideration of and the opportunity to phase out the HFC network (country stat for 2022: ~70%/~60%) and reduce the current HFC+Fibre overbuild of 1.45 and, of course, reduce the energy consumption and operational costs (and complexity) of operating two fixed broadband technologies (3 if we include the copper). However, maybe understandably enough, substantial investments have been made in upgrading to Docsis 3.1. An investment that possibly still is somewhat removed from having been written off.

The “wtf-moment” (in an otherwise very pleasantly and agreeable session) came when the speaker alluded that as part of their sustainability and CO2 reduction strategy, the telco was busy migrating from 4G LTE to 5G with the reasoning that 5G is 90% more energy efficient compared to 4G.

Firstly, it is correct that 5G is (in apples-for-apples comparisons!) ca. 90% more efficient in delivering a single bit compared to 4G. The metric we use is Joules-per-bit or Watts-seconds-per-bit. It is also not uncommon at all to experience Telco executives hinting at the relative greenness of 5G (it is, in my opinion, decidedly not a green broadband communications technology … ).

Secondly, so what! Should we really care about relative energy consumption? After all, we pay for absolute energy consumption, not for whatever relativized measure of consumed energy.

I think I know the answer from the CFO and the in-the-know investors.

If the absolute energy consumption of 5G is higher than that of 4G, I will (most likely) have higher operational costs attributed to that increased power consumption with 5G. If I am not in an apples-for-apples situation, which rarely is the case, and I am anyway really not in, the 5G technology requires substantially more power to provide for new requirements and specifications. I will be worse off regarding the associated cost in absolute terms of money. Unless I also have a higher revenue associated with 5G, I am economically worse off than I was with the older technology.

Having higher information-related energy efficiency in cellular communications systems is a feature of the essential requirement of increasingly better spectral efficiency all else being equal. It does not guarantee that, in absolute monetary terms, a Telco will be better off … far from it!

THE ENERGY OF DELIVERING A BIT.

Energy, which I choose to represent in Joules, is equal to the Power (in Watt or W) that I need to consume per time-unit for a given output unit (e.g., a bit) times the unit of time (e.g., a second) it took to provide the unit.

Take a 4G LTE base station that consumes ca. 5.0kW to deliver a maximum throughput of 160 Mbps per sector (@ 80 MHz per sector). The information energy efficiency of the specific 4G LTE base station (e.g., W·s per bit) would be ca. 10 µJ/bit. The 4G LTE base station requires 10 micro (one millionth) Joules to deliver 1 bit (in 1 second).

In the 5G world, we would have a 5G SA base station, using the same frequency bands as 4G and with an additional 10 MHz @ 700MHz and 100 MHz @ 3.5 GHz included. The 3.5 GHz band is supported by an advanced antenna system (AAS) rather than a classical passive antenna system used for the other frequency bands. This configuration consumes 10 kW with ~40% attributed to the 3.5 GHz AAS, supporting ~1 Gbps per sector (@ 190 MHz per sector). This example’s 5G information energy efficiency would be ca. 0.3 µJ/bit.

In this non-apples-for-apples comparison, 5G is about 30 times more efficient in delivering a bit than 4G LTE (in the example above). Regarding what an operator actually pays for, 5G is twice as costly in energy consumption compared to 4G.

It should be noted that the power consumption is not driven by the volumetric demand but by the time that demand exists and the load per unit of time. Also, base stations will have a power consumption even when idle with the degree depending on the intelligence of the energy management system applied.

So, more formalistic, we have

E per bit = P (in W) · time (in sec) per bit, or in the basic units

J / bit = W·s / bit = W / (bit/s) = W / bps = W / [ MHz · Mbps/MHz/unit · unit-quantity ]

E per bit = P (in W) / [ Bandwidth (in MHz) · Spectral Efficiency (in Mbps/MHz/unit) · unit-quantity ]

It is important to remember that this is about the system spec information efficiency and that there is no direct relationship between the Power that you need and the outputted information your system will ultimately support bit-wise.

\frac{E_{4G}}{bit} \; = \; \frac {\; P_{4G} \;} {\; B_{4G} \; \cdot \; \eta_{4G,eff} \; \cdot N \;\;\;} and \;\;\; \frac{E_{5G}}{bit} \; = \; \frac {\; P_{5G} \;} {\; B_{5G} \; \cdot \; \eta_{5G,eff} \; \cdot N \;}

Thus, the relative efficiency between 4G and 5G is

\frac{E_{4G}/bit}{E_{5G}/bit} \; = \; \frac{\; P_{4G} \;}{\; P_{5G}} \; \cdot \; \frac{\; B_{5G} \;}{\; B_{4G}} \; \cdot \; \frac{\; \eta_{5G,eff} \;}{\; \eta_{4G,eff}}

Currently (i.e., 2023), the various components of the above are approximately within the following ranges.

\frac{P_{4G}}{P_{5G}} \; \lesssim \; 1

\frac{B_{5G}}{B_{4G}} \; > \;2

\frac{\; \eta_{5G,eff} \;}{\; \eta_{4G,eff}} \; \approx \; 10

The power consumption of a 5G RAT is higher than that of a 4G RAT. As we add higher frequency spectrum (e.g., C-band, 6GHz, 23GHz,…) to the 5G RAT, increasingly more spectral bandwidth (B) will be available compared to what was deployed for 4G. This will increase the bit-wise energy efficiency of 5G compared to 4G, although the power consumption is also expected to increase as higher frequencies are supported.

If the bandwidth and system power consumption is the same for both radio access technologies (RATs), then we have the relative information energy efficiency is

\frac{E_{4G}/bit}{E_{5G}/bit} \; \approx \; \frac{\; \eta_{5G,eff} \;}{\; \eta_{4G,eff}} \; \gtrsim \; 10

Depending on the relative difference in spectral efficiency. 5G is specified and designed to have at least ten times (10x) the spectral efficiency of 4G. If you do the math (assuming apples-to-apples applies), it is no surprise that 5G is specified to be 90% more efficient in delivering a bit (in a given unit of time) compared to 4G LTE.

And just to emphasize the obvious,

E_{RAT} \; = \; P_{RAT} \; \cdot \; t \; \approx \; E_{idle} \; + \; P_{BB, RAT} \; \cdot \; t \; +\sum_{freq}P_{freq,\; antenna\; type}\; \cdot \; t_{freq} \;

RAT refers to the radio access technology, BB is the baseband, freq the cellular frequencies, and idle to the situation where the system is not being utilized.

Volume in Bytes (or bits) does not directly relate to energy consumption. As frequency bands are added to a sector (of a base station), the overall power consumption will increase. Moreover, the more computing is required in the antenna, such as for advanced antenna systems, including massive MiMo antennas, the more power will be consumed in the base station. The more the frequency bands are being utilized in terms of time, the higher will the power consumption be.

Indirectly, as the cellular system is being used, customers consume bits and bytes (=8·bit) that will depend on the effective spectral efficiency (in bps/Hz), the amount of effective bandwidth (in Hz) experienced by the customers, e.g., many customers will be in a coverage situation where they may not benefit for example from higher frequency bands), and the effective time they make use of the cellular network resources. The observant reader will see that I like the term “effective.” The reason is that customers rarely enjoy the maximum possible spectral efficiency. Likely, not all the frequency spectrum covering customers is necessarily being applied to individual customers, depending on their coverage situation.

In the report “A Comparison of the Energy Consumption of Broadband Data Transfer Technologies (November 2021),” the authors show the energy and volumetric consumption of mobile networks in Finland over the period from 2010 to 2020. To be clear, I do not support the author’s assertion of causation between volumetric demand and energy consumption. As I have shown above, volumetric usage does not directly cause a given power consumption level. Over the 10-year period shown in the report, they observe a 70% increase in absolute power consumption (from 404 to 686 GWh, CAGR ~5.5%) and a factor of ~70 in traffic volume (~60 TB to ~4,000 TB, CAGR ~52%). Caution should be made in resisting the temptation to attribute the increase in energy over the period to be directly related to the data volume increase, however weak it is (i.e., note that the authors did not resist that temptation). Rudolf van der Berg has raised several issues with the approach of the above paper (as well as with many other related works) and indicated that the data and approach of the authors may not be reliable. Unfortunately, in this respect, it appears that systematic, reliable, and consistent data in the Telco industry is hard to come by (even if that data should be available to the individual telcos).

Technology change from 2G/3G to 4G, site densification, and more frequency bands can more than easily explain the increase in energy consumption (and all are far better explanations than data volume). It should be noted that there will also be reasons that decrease power consumption over time, such as more efficient electronics (e.g., via modernization), intelligent power management applications, and, last but not least, switching off of older radio access technologies.

The factors that drive a cell site’s absolute energy consumption is

  • Radio access technology with new technologies generally consumes more energy than older ones (even if the newer technologies have become increasingly more spectrally efficient).
  • The antenna type and configuration, including computing requirements for advanced signal processing and beamforming algorithms (that will improve the spectral efficiency at the expense of increased absolute energy consumption).
  • Equipment efficiency. In general, new generations of electronics and systems designs tend to be more energy-efficient for the same level of performance.
  • Intelligent energy management systems that allow for effective power management strategies will reduce energy consumption compared to what it would have been without such systems.
  • The network optimization goal policy. Is the cellular network planned and optimized for meeting the demands and needs of the customers (i.e., the economic design framework) or for providing the peak performance to as many customers as possible (i.e., the Umlaut/Ookla performance-driven framework)? The Umlaut/Ookla-optimized network, maxing out on base station configuration, will observe substantially higher energy consumption and associated costs.
The absolute cellular energy consumption has continued to rise as new radio access technologies (RAT) have been introduced irrespective of the leapfrog in those RATS spectral (bits per Hz) and information-related (Joules per bit) efficiencies.

WHY 5G IS NOT A GREEN TECHNOLOGY?

Let’s first re-acquaint ourselves with the 2015 vision of the 5G NGMN whitepaper;

“5G should support a 1,000 times traffic increase in the next ten years timeframe, with energy consumption by the whole network of only half that typically consumed by today’s networks. This leads to the requirement of an energy efficiency increase of x2000 in the next ten years timeframe.” (Section 4.2.2 Energy Efficiency, 5G White Paper by NGMN Alliance, February 2015).

The bold emphasis is my own and not in the paper itself. There is no doubt that the authors of the 5G vision paper had the ambition of making 5G a sustainable and greener cellular alternative than historically had been the case.

So, from the above statement, we have two performance figures that illustrate the ambition of 5G relative to 4G. Firstly, we have a requirement that the 5G energy efficiency should be 2000x higher than 4G (as it was back in the beginning of 2015).

\frac{E_{4G}/bit}{E_{5G}/bit} \; = \; \frac{\; P_{4G} \;}{\; P_{5G}} \; \cdot \; \frac{\; B_{5G} \;}{\; B_{4G}} \; \cdot \; \frac{\; \eta_{5G,eff} \;}{\; \eta_{4G,eff}} \; \geq \; 2,000

or

\frac{\; P_{4G} \;}{\; P_{5G}} \; \cdot \; \frac{\; B_{5G} \;}{\; B_{4G}} \; \geq \; 200

if

\frac{\; \eta_{5G,eff} \;}{\; \eta_{4G,eff}} \; \approx \; 10

Getting more spectrum bandwidth is relatively trivial as you go up in frequency and into, for example, the millimeter wave range (and beyond). However, getting 20+ GHz (e.g., 200+x100 MHz @ 4G) of additional practically usable spectrum bandwidth would be rather (=understatement) ambitious.

And that the absolute energy consumption of the whole 5G network should be half of what it was with 4G

\frac{E_{5G}}{E_{4G}} \; = \; \frac{\; P_{5G} \; \cdot \; t\;}{\; P_{4G} \; \cdot \; t}\; \approx \; \frac{\; P_{5G} \;}{\; P_{4G} \; } \; \leq \; \frac{1}{2}

If you think about this for a moment. Halfing the absolute energy consumption is an enormous challenge, even if it would have been with the same RAT. It requires innovation leapfrogs across the RAT electronic architecture, design, and material science underlying all of it. In other words, fundamental changes are required in the RF frontend (e.g., Power amplifiers, transceivers), baseband processing, DSP, DAC, ADC, cooling, control and management systems, algorithms, compute, etc…

But reality eats vision for breakfast … There really is no sign that the super-ambitious goal set by the NGMN Alliance in early 2015 is even remotely achievable even if we would give it another ten years (i.e., 2035). We are more than two orders of magnitude away from the visionary target of NGMN, and we are almost at the 10-year anniversary of the vision paper. We more or less get the benefit of the relative difference in spectral efficiency (x10), but no innovation beyond that has contributed very much to quantum leap cellular energy efficiency bit-wise.

I know many operators who will say that from a sustainability perspective, at least before the energy prices went through the roof, it really does not matter that 5G, in absolute terms, leads to substantial increases in energy consumption. They use green energy to supply the energy demand from 5G and pay off $CO_2$ deficits with certificates.

First of all, unless the increased cost can be recovered with the customers (e.g., price plan increase), it is a doubtful economic venue to pursue (and has a bit of a Titanic feel to it … going down together while the orchestra is playing).

Second, we should ask ourselves whether it is really okay for any industry to greedily consume sustainable and still relatively scarce green resources without being incentivized (or encouraged) to pursue alternatives and optimize across mobile and fixed broadband technologies. Particularly when fixed broadband technologies, such as fiber, are available, that would lead to a very sizable and substantial reduction in energy consumption … as customers increasingly adapt to fiber broadband.

Fiber is the greenest and most sustainable access technology we can deploy compared to cellular broadband technologies.

SO WHAT?

5G is a reality. Telcos are and will continue to invest substantially into 5G as they migrate their customers from 4G LTE to what ultimately will be 5G Standalone. The increase in customer experience and new capabilities or enablers are significant. By now, most Telcos will (i.e., 2023) have a very good idea of the operational expense associated with 5G (if not … you better do the math). Some will have been exploring investing in their own green power plants (e.g., solar, wind, hydrogen, etc.) to mitigate part of the energy surge arising from transitioning to 5G.

I suspect that as Telcos start reflecting on Open RAN as they pivot towards 6G (-> 2030+), above and beyond what 6G, as a RAT, may bring of additional operational expense pain, there will be new energy consumption and sustainability surprises to the cellular part of Telcos P&L. In general, breaking up an electronic system into individual (non-integrated) parts, as opposed to being integrated into a single unit, is likely to result in an increased power consumption. Some of the operational in-efficiencies that occur in breaking up a tightly integrated design can be mitigated by power management strategies. Though in order to get such power management strategies to work at the optimum may force a higher degree of supplier uniformity than the original intent of breaking up the tightly integrated system.

However, only Telcos that consider both their mobile and fixed broadband assets together, rather than two silos apart, will gain in value for customers and shareholders. Fixed-mobile (network) conversion should be taken seriously and may lead to very different considerations and strategies than 10+ years ago.

With increasing coverage of fiber and with Telcos stimulating aggressive uptake, it will allow those to redesign the mobile networks for what they were initially supposed to do … provide convenience and service where there is no fixed network present, such as when being mobile and in areas where the economics of a fixed broadband network makes it least likely to be available (e.g., rural areas) although LEO satellites (i.e., here today), maybe stratospheric drones (i.e., 2030+), may offer solid economic alternatives for those places. Interestingly, further simplifying the cellular networks supporting those areas today.

TAKE AWAY.

Volume in Bytes (or bits) does not directly relate to the energy consumption of the underlying communications networks that enable the usage.

The duration, the time scale, of the customer’s usage (i.e., the use of the network resources) does cause power consumption.

The bit-wise energy efficiency of 5G is superior to that of 4G LTE. It is designed that way via its spectral efficiency. Despite this, a 5G site configuration is likely to consume more energy than a 4G LTE site in the field and, thus, not a like-for-like in terms of number of bands and type of antennas deployed.

The absolute power consumption of a 5G configuration is a function of the number of bands deployed, the type of antennas deployed, intelligent energy management features, and the effective time 5G resources that customers have demanded.

Due to its optical foundation, Fiber is far more energy efficient in both bit-wise relative terms and absolute terms than any other legacy fixed (e.g., xDSL, HFC) or cellular broadband technology (e.g., 4G, 5G).

Looking forward and with the increasing challenges of remaining sustainable and contributing to CO2 reduction, it is paramount to consider an energy-optimized fixed and mobile converged network architecture as opposed to today’s approach of optimizing the fixed network separately from the cellular network. As a society, we should expect that the industry works hard to achieve an overall reduction in energy consumption, relaxing the demand on existing green energy infrastructures.

With 5G as of today, we are orders of magnitude from the original NGMN vision of energy consumption of only half of what was consumed by cellular networks ten years ago (i.e., 2014), requiring an overall energy efficiency increase of x2000.

Be aware that many Telcos and Infrastructure providers will use bit-wise energy efficiency when they report on energy consumption. They will generally report impressive gains over time in the energy that networks consume to deliver bits to their customers. This is the least one should expect.

Last but not least, the telco world is not static and is RAT-wise not very clean, as mobile networks will have several RATs deployed simultaneously (e.g., 2G, 4G, and 5G). As such, we rarely (if ever) have apples-to-apples comparisons on cellular energy consumption.

ACKNOWLEDGEMENT.

I greatly acknowledge my wife, Eva Varadi, for her support, patience, and understanding during the creative process of writing this article. I also greatly appreciate the discussion on this topic that I have had with Rudolf van der Berg over the last couple of years. I thank him for pointing out and reminding me (when I forget) of the shortfalls and poor quality of most of the academic work and lobbying activities done in this area.

PS

If you are aiming at a leapfrog in absolute energy reduction of your cellular network, above and beyond what you get with your infrastructure suppliers (e.g., Nokia, Ericsson, Huawei…), I really recommend you take a look at Opanga‘s machine learning-based Joule ML solution. The Joules ML has been proven to reduce RAN energy costs by 20% – 40% on top of what the RAT supplier’s (e.g., Ericsson, Nokia, Huawei, etc.) own energy management solutions may bring.

Disclosure: I am associated with Opanga and on their Industry Advisory Board.

On Cellular Data Pricing, Revenue & Consumptive Growth Dynamics, and Elephants in the Data Pipe.

I am getting a bit sentimental as I haven’t written much about cellular data consumption for the last 10+ years. At the time, it did not take long for most folks in and out of our industry to realize that data traffic and, thereby, so many believed, the total cost of providing the cellular data would be growing far beyond the associated data revenues, e.g., remember the famous scissor chart back in the early two thousand tens. Many believed (then) that cellular data growth would be the undoing of the cellular industry. In 2011 many believed that the Industry only had a few more years before the total cost of providing cellular data would exceed the revenue rendering cellular data unprofitable. Ten years after, our industry remains alive and kicking (though they might not want to admit it too loudly).

Much of the past fear was due to not completely understanding the technology drivers, e.g., bits per second is a driver, and bytes that price plans were structured around not so much. The initial huge growth rates of data consumption that were observed did not make the unease smaller, i.e., often forgetting that a bit more can be represented as a huge growth rate when you start with almost nothing. Moreover, we also did have big scaling challenges with 3G data delivery. It became quickly clear that 3G was not what it had been hyped to be by the industry.

And … despite the historical evidence to the contrary, there are still to this day many industry insiders that believe that a Byte lost or gained is directly related to a loss or gain in revenue in a linear fashion. Our brains prefer straight lines and linear thinking, happily ignoring the unpleasantries of the non-linear world around us, often created by ourselves.

Figure 1 illustrates linear or straight-line thinking (left side), preferred by our human brains, contrasting the often non-linear reality (right side). It should be emphasized that horizontal and vertical lines, although linear, are not typically something that instinctively enters the cognitive process of assessing real-world trends.

Of course, if the non-linear price plans for cellular data were as depicted above in Figure 1, such insiders would be right even if anchored in linear thinking (i.e., even in the non-linear example to the right, an increase in consumption (GBs) leads to an increase in revenue). However, when it comes to cellular data price plans, the price vs. consumption is much more “beastly,” as shown below (in Figure 2);

Figure 2 illustrates the two most common price plan structures in Telcoland; (a, left side) the typical step function price logic that associates a range of data consumption with a price point, i.e., the price is a constant independent of the consumption over the data range. The price level is presented as price versus the maximum allowed consumption. This is by far the most common price plan logic in use. (b, right side) The “unlimited” price plan logic has one price level and allows for unlimited data consumption. T-Mobile US, Swisscom, and SK Telecom have all endorsed the unlimited with good examples of such pricing logic. The interesting fact is that most of those operators have several levels of unlimited tied to the consumptive behavior where above a given limit, the customer may be throttled (i.e., the speed will be reduced compared to before reaching the limit), or (and!) the unlimited plan is tied to either radio access technology (e.g., 4G, 4G+5G, 5G) or a given speed (e.g., 50 Mbps, 100 Mbps, 1Gbps, ..).

Most cellular data price plans follow a step function-like pricing logic as shown in Figure 2 (left side), where within each level, the price is constant up to the nominal data consumption value (i.e., purple dot) of the given plan, irrespective of the consumption. The most extreme version of this logic is the unlimited price plan, where the price level is independent of the volumetric data consumption. Although, “funny” enough, many operators have designed unlimited price plans that, in one way or another, depend on the customers’ consumption, e.g., after a certain level of unlimited consumption (e.g., 200 GB), cellular speed is throttled substantially (at least if the cell under which the customer demand resources are congested). So the “logic” is that if you wanted true unlimited, you still need to pay more than if you only require “unlimited”. Note that for the mathematically inclined, the step function is regarded as (piece-wise) linear … Although our linear brains might not appreciate that finesse very much. Maybe a heuristic that “The brain thinks in straight lines” would be more precisely restated as “The brain thinks in continuous non-constant monotonous straight lines”.

Any increase in consumption within a given pricing-consumption level will not result in any additional revenue. Most price plans allow for considerable growth without incurring additional associated revenues.

NETHERLANDS vs INDONESIA – BRIEFLY.

I like to keep informed and updated about markets I have worked in, with operators I have worked for, and with. I have worked across the globe in many very diverse markets and with operators in vastly different business cycles gives an interesting perspective on our industry. Throughout my career, I have been super interested in the difference between Telco operations and strategies in so-called mature markets versus what today may be much more of a misnomer than 10+ years ago, emerging markets.

The average cellular, without WiFi, consumption per customer in Indonesia was ca. 8 GB per month in 2022. That consumption would cost around 50 thousand Rp (ca. 3 euros) per month. For comparison, in The Netherlands, that consumption profile would cost a consumer around 16 euros per month. As of May 2023, the median cellular download speed was 106 Mbps (i.e., helped by countrywide 5G deployment, for 4G only, the speed would be around 60 to 80 Mbps) compared with 22 Mbps in Indonesia (i.e., where 5G has just been launched. Interestingly, although most likely coincidental, in Indonesia, a cellular data customer would pay ca. 5 times less than in the Netherlands for the same volumetric consumption. Note that for 2023, the average annual income in Indonesia is about one-quarter of that in the Netherlands. However, the Indonesian cellular consumer would also have one-fifth of the quality measured by downlink speed from the cellular base station to the consumer’s smartphone.

Let’s go deeper into how effective consumptive growth of cellular data is monetized… what may impact the consumptive growth, positively and negatively, and how it relates to the telco’s topline.

CELLULAR BUSINESS DYNAMICS.

Figure 3 Between 2016 and 2021, Western European Telcos lost almost 7% of their total cellular turnover (ca. 7+ billion euros over the markets I follow). This corresponds to a total revenue loss of ca. 1.4% per year over the period. To no surprise, the loss of cellular voice-based revenue has been truly horrendous, with an annual loss ca. 30%, although the Covid year (2021 and 2022, for that matter) was good to voice revenues (as we found ourselves confined to our homes and a call away from our colleagues). On the positive side, cellular data-based revenues have “positively” contributed to the revenue in Western Europe over the period (we don’t really know the counterfactual), with an annual growth of ca. 4%. Since 2016 cellular data revenues have exceeded that of cellular voice revenues and are 2022 expected to be around 70% of the total cellular revenue (for Western Europe). Cellular revenues have been and remain under pressure, even with a positive contribution from cellular data. The growth of cellular data volume (not including the contribution generated from WiFi usage) has continued to grow with a 38% annualized growth rate and is today (i.e., 2023) more than five times that of 2016. The annual growth rate of cellular data consumption per customer is somewhat lower ranging from the mid-twenties to the end-thirties percent. Needless to say that the corresponding cellular ARPU has not experienced anywhere near similar growth. In fact, cellular ARPU has generally been lowered over the period.

Some, in my opinion, obvious observations that are worth making on cellular data (I come to realize that although I find these obvious, I am often confronted with a lack of awareness or understanding of those);

Cellular data consumption grows much (much) faster than the corresponding data revenue (i.e., 38% vs 4% for Western Europe).

The unit growth of cellular data consumption does not lead to the same unit growth in the corresponding cellular data revenues.

Within most finite cellular data plans (thus the not unlimited ones), substantial data growth potential can be realized without resulting in a net increase of data-related revenues. This is, of course, trivial for unlimited plans.

The anticipated death of the cellular industry back in the twenty-tens was an exaggeration. The Industry’s death by signaling, voluptuous & unconstrained volumes of demanded data, and ever-decreasing euros per Bytes remains a fading memory and, of course, in PowerPoints of that time (I have provided some of my own from that period below). A good scare does wonders to stimulate innovation to avoid “Armageddon.” The telecom industry remains alive and well.

Figure 4 The latest data (up to 2022) from OECD on mobile data consumption dynamics. Source data can be found at OECD Data Explorer. The data illustrates the slowdown in cellular data growth from a customer perspective and in terms of total generated mobile data. Looking over the period, the 5-year cumulative growth rate between 2016 and 2021 is higher than 2017 to 2022 as well as the growth rate between 2022 and 2021 was, in general, even lower. This indicates a general slowdown in mobile data consumption as 4G consumption (in Western Europe) saturates and 5G consumption still picks up. Although this is not an account of the observed growth dynamics over the years, given the data for 2022 was just released, I felt it was worth including these for completeness. Unfortunately, I have not yet acquired the cellular revenue structure (e.g., voice and data) for 2022, it is work in progress.

WHAT DRIVES CONSUMPTIVE DATA GROWTH … POSITIVE & NEGATIVE.

What drives the consumer’s cellular data consumption? As I have done with my team for many years, a cellular operator with data analytics capabilities can easily check the list of positive and negative contributors driving cellular data consumption below.

Positive Growth Contributors:

  • Customer or adopter uptake. That is, new or old, customers that go from non-data to data customers (i.e., adopting cellular data).
  • Increased data consumption (i.e., usage per adopter) within the cellular data customer base that is driven by a lot of the enablers below;
  • Affordable pricing and suitable price plans.
  • More capable Radio Access Technology (RAT), e.g., HSDPA → HSPA+ → LTE → 5G, effectively higher spectral efficiency from advanced antenna systems. Typically will drive up the per-customer data consumption to the extent that pricing is not a barrier to usage.
  • More available cellular frequency spectrum is provisioned on the best RAT (regarding spectral efficiency).
  • Good enough cellular network consistent with customer demand.
  • Affordable and capable device ecosystem.
  • Faster mobile device CPU leads to higher consumption.
  • Faster & more capable mobile GPUs lead to higher consumption.
  • Device screen size. The larger the screen, the higher the consumption.
  • Access to popular content and social media.

Figure 5 illustrates the description of data growth as depending on the uptake of Adopters and the associated growth rate α(t) multiplied by the Usage per Adopter and the associated growth rate of usage μ(t). The growth of the Adopters can typically be approximated by an S-curve reaching its maximum as there are few more customers left to adopt a new service or product or RAT (i.e., α(t)→0%). As described in this section, the growth of usage per adopter, μ(t), will depend on many factors. Our intuition of μ is that it is positive for cellular data and historically has exceeded 30%. A negative μ would be an indication of consumptive churn. It should not be surprising that overall cellular data consumption growth can be very large as the Adopter growth rate is at its peak (i.e., around the S-curve inflection point), and Usage growth is high as well. It also should not be too surprising that after Adopter uptake has reached the inflection point, the overall growth will slow down and eventually be driven by the Usage per Adopter growth rate.

Figure 6 Using the OECD data (OECD Data Explorer) for the Western European mobile data per customer consumptive growth from 2011 to 2022, the above illustrates the annual growth rate of per-customer data mobile consumption. Mobile data consumption is a blend of usage across the various RATs enabling packet data usage. There is a clear increased annual growth after introducing LTE (4G) followed by a slowdown in annual growth, possibly due to reaching saturation in 4G adaptation, i.e., α3G→4G(t) → 0% leaving μ4G(t) driving the cellular data growth. There is a relatively weak increase in 2021, and although the timing coincides with 5G non-standalone (NSA) introduction (typically at 700 MHz or dynamics spectrum share (DSS) with 4G, e.g., Vodafone-Ziggo NL using their 1800 MHz for 4G and 5G) the increase in 2020 may be better attributed to Covid lockdown than a spurt in data consumption due to 5G NSA intro.

Anything that creates more capacity and quality (e.g., increased spectral efficiency, more spectrum, new, more capable RAT, better antennas, …) will, in general, result in an increased usage overall as well as on a per-customer basis (remember most price plans allow for substantial growth within the plans data-volume limit without incurring more cost for the customer). If one takes the above counterfactual, it should not be surprising that this would result in slower or negative consumption growth.

Negative growth contributors:

  • Cellular congestion causes increased packet loss, retransmissions, and deteriorating latency and speed performance. All in all, congestion may have a substantial negative impact on the customer’s service experience.
  • Throttling policies will always lower consumption and usage in general, as quality is intentionally lowered by the Telco.
  • Increased share of QUIC content on the network. The QUIC protocol is used by many streaming video providers (e.g., Youtube, Facebook, TikTok, …). The protocol improves performance (e.g., speed, latency, packet delivery, network changes, …) and security. Services using QUIC will “bully” other applications that use TCP/IP, encouraging TCP/IP to back off from using bandwidth. In this respect, QUIC is not a fair protocol.
  • Elephant flow dynamics (e.g., few traffic flows causing cell congestion and service degradation for the many). In general, elephant flows, particularly QUIC based, will cause an increase in TCP/IP data packet retransmissions and timing penalties. It is very much a situation where a few traffic flows cause significant service degradation for many customers.

One of the manifestations of cell congestion is packet loss and packet retransmission. Packet loss due to congestion ranges from 1% to 5%. or even several times higher at moments of peak traffic or if the user is in a poor cellular coverage area. The higher the packet loss, the worse the congestion, and the worse the customer experience. The underlying IP protocols will attempt to recover a lost packet by retransmission. The retransmission rate can easily exceed 10% to 15% in case of congestion. Generally, for a reliable and well-operated network, the packet loss should be well below 1% and even as low as 0.1%. Likewise, one would expect a packet retransmission rate of less than 2% (I believe the target should be less than 1%).

Thus, customers that happen to be under a given congested cell (e.g., caused by an elephant flow) would incur a substantially higher rate of retransmitted data packages (i.e., 10% to 15% or higher) as the TCP/IP protocol tries to make up for lost data packages. The customer may experience substantial service quality degradation and, as a final (unintended) “insult”, often be charged for those additional retransmitted data volumes.

From a cellular perspective, as the congestion has been relieved, the cellular operator may observe that the volume on the congested cell actually drops. The reason is that the packet loss and retransmission drops to a level far below the congested one (e.g., typically below 1%). As the quality improves for all customers demanding service from the previously overloaded (i.e., congested) cell, sustainable volume growth will commence in total and as well as will the average consumption on a customer basis. As will be shown below for normal cellular data consumption and most (if not all) price plans, a few percentage points drop in data volume will not have any meaningful effect on revenues. Either because the (temporary) drop happens within the boundaries of a given price plan level and thus has no effect on revenue, or because the overall gainful consumptive growth, as opposed to data volume attributed to poor quality, far exceeds the volume loss due to improved capacity and quality of a congested cell.

Well-balanced and available cellular sites will experience positive and sustainable data traffic growth.

Congested and over-loaded cellular sites will experience a negative and persistent reduction of data traffic.

Actively managing the few elephant flows and their negative impact on the many will increase customer satisfaction, reduce consumptive churn, and increase data growth, easily compensating for the congestion-induced increases due to packet retransmission. And unless an operator consistently is starved for radio access investments, or has poor radio access capacity management processes, most cell congestion can be attributed to the so-called elephant flows.

CELLULAR DATA CONSUMPTION IN REAL NETWORKS – ON A SECTOR LEVEL.

And irrespective of whatever drives positive and negative growth, it is worth remembering that daily traffic variations on a sector-by-sector basis and an overall cellular network level are entirely natural. An illustration of such natural sector variation over a (non-holiday) week is shown below in Figure 7 (c) for a sector in the top-20% of busiest sectors. In this example, the median variation over all sectors in the same week, as shown below, was around 10%. I often observe that even telco people (that should know better) find this natural variation quite worrisome as it appears counterintuitive to their linear growth expectations. Proper statistical measurement & analysis methodologies must be in place if inferences and solid analysis are required on a sector (or cell) basis over a relatively short time period (e.g., day, days, week, weeks,…).

Figure 7 illustrates the cellular data consumption daily variation over a (non-holiday) week. In the above, there are three examples (a) a sector from the bottom 20% in terms of carried volume, (b) a sector with a median data volume, and (c) a sector taken from the top 20% of carried data volume. Over the three different sectors (low, median, high) we observe very different variations over weekdays. From the top-20%, we have an almost 30% variation between the weekly minimum (Tuesday) and the weekly maximum (Thursday) to the bottom-20% with a variation in excess of 200% over the week. The charts above show another trend we observe in cellular networks regarding consumptive variations over time. Busy sectors tend to have a lower weekly variation than less busy sectors. I should point out that I have made no effort to select particular sectors. I could easily find some (of the less busy sectors) with even more wild variations than shown above.

The day-to-day variation is naturally occurring based on the dynamic behavior of the customers served by a given sector or cell (in a sector). I am frequently confronted with technology colleagues (whom I respect for their deep technical knowledge) that appear to expect (data) traffic on all levels monotonously increase with a daily growth rate that amounts to the annual CAGR observed by comparing the end-of-period volume level with the beginning of period volume level. Most have not bothered to look at actual network data and do not understand (or, to put it more nicely, simply ignore) the naturally statistical behavior of traffic that drives hourly, daily, weekly, and monthly variations. If you let statistical variations that you have no control over drive your planning & optimization decisions. In that case, you will likely fail to decide on the business-critical ones you can control.

An example of a high-traffic (top-20%) sector’s complete 365 day variations of data consumption is shown below in Figure 8. We observe that the average consumption (or traffic demand) increases nicely over the year with a bit of a slowdown (in this European example) during the summer vacation season (same around official holidays in general). Seasonal variations is naturally occurring and often will result in a lower-than-usual daily growth rate and a change in daily variations. In the sector traffic example below, Tuesdays and Saturdays are (typically) lower than the average, and Thursdays are higher than average. The annual growth is positive despite the consumptive lows over the year, which would typically freak out my previously mentioned industry colleagues. Of course, every site, sector, and cell will have a different yearly growth rate, most likely close to a normal distribution around the gross annual growth rate.

Figure 8 illustrates a top-20% sector’s data traffic growth dynamics (in GB) over a calendar year’s 365 days. Tuesdays and Saturdays are likely below the weekly average data consumption, and Thursdays are more likely to be above. Furthermore, the daily traffic growth is slowing around national holidays and in the summer vacation (i.e., July & August for this particular Western European country).

And to nail down the message. As shown in the example in Figure 9 below, every sector in your cellular network from one time period to the other will have a different positive and negative growth rate. The net effect over time (in terms of months more than days or weeks) is positive as long as customers adopt the supplied RAT (i.e., if customers are migrating from 4G to 5G, it may very well be that 4G consumed data will decline while the 5G consumed data will increase) and of course, as long as the provided quality is consistent with the expected and demanded quality, i.e., sectors with congestion, particular so-called elephant-flow induced congestion, will hurt the quality of the many that may reduce their consumptive behavior and eventually churn.

Figure 9 illustrates the variation in growth rates across 15+ thousand sectors in a cellular network comparing the demanded data volume between two consecutive Mondays per sector. Statistical analysis of the above data shows that the overall average value is ca. 0.49% and slightly skewed towards the positive growths rates (e.g., if you would compare a Monday with a Tuesday, the histogram would typically be skewed towards the negative side of the growth rates as Tuesday are a lower traffic day compared to Monday). Also, with the danger of pointing out the obvious, the daily or weekly growth rates expected from an annual growth rate of, for example, 30% are relatively minute, with ca. 0.07% and 0.49%, respectively.

The examples above (Figures 7, 8, and 9) are from a year in the past when Verstappen had yet to win his first F1 championship. That particular weekend also did not show F1 (or Sunday would have looked very different … i.e., much higher) or any other big sports event.

CELLULAR DATA PRICE PLAN LOGIC.

Figure 10 above is an example of the structure of a price plan. Possibly represented slightly differently from how your marketeer would do (and I am at peace with that). We observe the illustration of a price level of 8 data volume intervals on the upper left chart. This we can also write as (following the terminology of the lower right corner);

Thus, for the p_1 package allowing the customer to consume up to 3 GB is priced at 20 (irrespective of whether the customer would consume less). For package p_5 a consumer would pay 100 for a data consumption allowance up to 35 GB. Of course, we assume that the consumer choosing this package would generally consume more than 24 GB, which is the next cheaper package (i.e., p_4).

The price plan example above clearly shows that each price level offers customers room to grow before upgrading to the next level. For example, a customer consuming no more than 8 GB per month, fitting into p_3, could increase consumption with 4 GB (+50%) before considering the next level price plan (i.e., p_4). This is just to illustrate that even if the customer’s consumption may grow substantially, one should not per se be expecting more revenue.

Even though it should be reasonably straightforward that substantial growth of a customer base data consumption cannot be expected to lead to an equivalent growth in revenue, many telco insiders instinctively believe this should be the case. I believe that the error may be due to many mentally linearizing the step-function price plans (see Figure 2 upper right side) and simply (but erroneously) believing that any increase (decrease) in consumption directly results in an increase (or decrease) in revenue.

DATA PRICING LOGIC & USAGE DISTRIBUTION.

If we want to understand how consumptive behavior impacts cellular operators’ toplines, we need to know how the actual consumption distributes across the pricing logic. As a high-level illustration, Figure 11 (below) shows the data price step-function logic from Figure 9 with an overall consumptive distribution superimposed (orange solid line). It should be appreciated that while this provides a fairly clear way of associating consumption with pricing, it is an oversimplification at best. It will nevertheless allow me to estimate crudely the number of customers that are likely to have chosen a particular price plan matching their demand (and affordability). In reality, we will have customers that have chosen a given price plan but either consume less than the limit of the next cheaper plan (thus, if consistently so, could save but go to that plan). We will also have customers that consume more than their allowed limit. Usually, this would result in the operator throttling the speed and sending a message to the customer that the consumption exceeds the limit of the chosen price plan. If a customer would consistently overshoots the limits (with a given margin) of the chosen plan, it is likely that eventually, the customer will upgrade to the next more expensive plan with a higher data allowance.

Figure 11 above illustrates on the left side a consumptive distribution (orange line) identified by its mean and standard deviation superimposed on our price plan step-function logic example. The right summarizes the consumptive distribution across the eight price plan levels. Note that there is a 9th level in case the 200 GB limit is breached (0.2% in this example). I am assuming that such customers pay twice the price for the 200 GB price plan (i.e., 320).

In the example of an operator with 100 million cellular customers, the consumptive distribution and the given price plan lead to a fiat of 7+ billion per month. However, with a consumptive growth rate of 30% to 40% annually per active cellular data user (on average), what kind of growth should we expect from the associated cellular data revenues?

Figure 12 In the above illustration, I have mapped the consumptive distribution to the price plan levels and then developed the begin-of-period consumptive distribution (i.e., the light green curve) month by month until month 12 has been reached (i.e., the yellow curve). I assume the average monthly consumptive cellular data growth is 2.5% or ca. 35% after 12 months. Furthermore, I assume that for the few customers falling outside the 200 GB limit that they will purchase another 200 GB plan. For completeness, the previous 12 months (previous year) need to be carried out to compare the total cumulated cellular data revenue between the current and previous periods.

Within the current period (shown in Figure 12 above), the monthly cellular data revenue CAGR comes out at 0.6% or a total growth of 7.4% of monthly revenue between the beginning period and the end period. Over the same period, the average data consumption (per user) grew by ca. 34.5%. In terms of the current year’s total data revenue to the previous year’s total data revenue, we get an annual growth rate of 8.3%. This illustrates that it should not be surprising that the revenue growth can be far smaller than the consumptive growth given price plans such as the above.

It should be pointed out that the above illustration of consumptive and revenue growth simplifies the growth dynamics. For example, the simulation ignores seasonal swings over a 12-month period. Also, it attributes 1-to-1 all consumption falling within the price range to that particular price level when there is always spillover on both upper and lower levels of a price range that will not incur higher or lower revenues. Moreover, while mapping the consumptive distribution to the price-plan giga-byte intervals makes the simulation faster (and setup certainly easier), it is also not a very accurate approach to the coarseness of the intervals.

A LEVEL DEEPER.

While working with just one consumptive distribution, as in Figure 11 and Figure 12 above, allows for simpler considerations, it does not fully reflect the reality that every price plan level will have its own consumptive distribution. So let us go that level deeper and see whether it makes a difference.

Figure 13 above, illustrates the consumptive distribution within a given price plan range, e.g., the “5 GB @ 30” price-plan level for customers with a consumption higher than 3 GB and less than or equal to 5 GB. It should come as no surprise that some customers may not reach even the 3 GB, even though they pay for (up to) 5 GB, and some may occasionally exceed the 5 GB limit. In the example above, 10% of customers have a consumption below 3 GB (and could have chosen the next cheaper plan of up to 3 GB), and 3% exceed the limits of the chosen plan (an event that may result in the usage speed being throttled). As the average usage within a given price plan level approaches the ceiling (e.g., 5 GB in the above illustration), in general, the standard deviation will reduce accordingly as customers will jump to the Next Expensive Plan to meet their consumptive needs (e.g., “12 GB @ 50” level in the illustration above).

Figure 14 generalizes Figure 11 to the full price plan and, as illustrated in Figure 12, let the consumption profiles develop in time over a 12-month period (Initial and +12 month shown in the above illustration). The difference between the initial and 12 months can be best appreciated with the four smaller figures that break up the price plan levels in 0 to 40 GB and 40 to 200 GB.

The result in terms of cellular data revenue growth is comparable to that of the higher-level approach of Figure 12 (ca. 8% annual revenue growth vs 34 % overall consumptive annual growth rate). The detailed approach of Figure 11 is, however, more complicated to get working and requires much more real data to work with (which obviously should be available to operators in this time and age). One should note that in the illustrated example price plan (used in the figures above) that at a 2.5% monthly consumptive growth rate (i.e., 34% annually), it would take a customer an average of 24 months (spread of 14 to 35 month depending on level) to traverse a price plan level from the beginning of the level (e.g., 5 GB) to the end of the level (12 GB). It should also be clear that as a customer enters the highest price plan levels (e.g., 100 GB and 200 GB), little additional can be expected to be earned on those customers over their consumptive lifetime.

The illustrated detailed approach shown above is, in particular, useful to test a given price plan’s profitability and growth potential, given the particularities of the customers’ consumptive growth dynamics.

The additional finesse that could be considered in the analysis could be an affordability approach because the growth within a given price level slows down as the average consumption approaches the limit of the given price level. This could be considered by slowing the mean growth rate and allowing for the variance to narrow as the density function approaches the limit. In my simpler approach, the consumptive distributions will continue to grow at a constant growth rate. In particular, one should consider more sophisticated approaches to modeling the variance that determines the spillover into less and more expensive levels. An operator should note that consumption that reduces or consistently falls into the less expensive level expresses consumptive churn. This should be monitored on a customer level as well as on a radio access cell level. Consumptive churn often reflects the supplied radio access quality is out of sync with the customer demand dynamics and expectations. On a radio access cell level, the diligent operator will observe a sharp increase in retransmitted data packages and increased latency on a flow (and active customer basis) hallmarks of a congested cell.

WRAPPING UP.

To this day, 20+ odd years after the first packet data cellular price plans were introduced, I still have meetings with industry colleagues where they state that they cannot implement quality-enhancing technologies for the fear that data consumption may reduce and by that their revenues. Funny enough, often the fear is that by improving the quality for typically many of their customers being penalized by a few customers’ usage patterns (e.g., the elephants in the data pipe), the data packet loss and TCP/IP retransmissions are reducing as the quality is improving and more customers are getting the service they have paid for. It is ignoring the commonly established fact of our industry that improving the customer experience leads to sustainable growth in consumption that consequently may also have a positive topline impact.

I am often in situations where I am surprised with how little understanding and feeling Telco employees have for their own price plans, consumptive behavior, and the impact these have on their company’s performance. This may be due to the fairly complex price plans telcos are inventing, and our brain’s propensity for linear thinking certainly doesn’t make it easier. It may also be because Telcos rarely spend any effort educating their employees about their price plans and products (after all, employees often get all the goodies for “free”, so why bother?). Do a simple test at your next town hall meeting and ask your CXOs about your company’s price plans and their effectiveness in monetizing consumption.

So what to look out for?

Many in our industry have an inflated idea (to a fault) about how effective consumptive growth is being monetized within their company’s price plans.

Most of today’s cellular data plans can accommodate substantial growth without leading to equivalent associated data revenue growth.

The apparent disconnect between the growth rate of cellular data consumption (CAGR ~30+%), in its totality as well on an average per-customer basis, and cellular data revenues growth rate (CAGR < 10%) is simply due to the industry’s price plan structures allowing for substantial growth without a proportion revenue growth.

ACKNOWLEDGEMENT.

I greatly acknowledge my wife, Eva Varadi, for her support, patience, and understanding during the creative process of writing this Blog.

FURTHER READING.

Kim Kyllesbech Larsen, Mind Share: Right Pricing LTE … and Mobile Broadband in general (A Technologist’s observations) (slideshare.net), (May 2012). A cool seminal presentation on various approaches to pricing mobile data. Contains a lot of data that illustrates how far we have come over the last 10 years.

Kim Kyllesbech Larsen, Mobile Data-centric Price Plans – An illustration of the De-composed. | techneconomyblog (February, 2015). Exploring UK mobile mixed-services price plans in an attempt to decipher the price of data which at the time (often still is) a challenge to figure out due to (intentional?) obfuscation.

Kim Kyllesbech Larsen, The Unbearable Lightness of Mobile Voice. | techneconomyblog (January, 2015). On the demise of voice revenue and rise of data. More of a historical account today.

Tellabs “End of Profit” study executive summary (wordpress.com), (2011). This study very much echoed the increasing Industry concern back in 2010-2012 that cellular data growth would become unprofitable and the industry’s undoing. The basic premise was that the explosive growth of cellular data and, thus, the total cost of maintaining the demand would lead to a situation where the total cost per GB would exceed the revenue per GB within the next couple of years. This btw. was also a trigger point for many cellular-focused telcos to re-think their strategies towards the integrated telco having internal access to fixed and mobile broadband.

B. de Langhe et al., “Linear Thinking in a Nonlinear World”, Harvard Business Review, (May-June, 2017). It is a very nice and compelling article about how difficult it is to get around linear thinking in a non-linear world. Our brains prefer straight lines and linear patterns and dependencies. However, this may lead to rather amazing mistakes and miscalculations in our clearly nonlinear world.

OECD Data Explorer A great source of telecom data, for example, cellular data usage per customer, and the number of cellular data customers, across many countries. Recently includes 2022 data.

I have used Mobile Data – Europe | Statista Market Forecast to better understand the distribution between cellular voice and data revenues. Most Telcos do not break out their cellular voice and data revenues from their total cellular revenues. Thus, in general, such splits are based on historical information where it was reported, extrapolations, estimates, or more comprehensive models.

Kim Kyllesbech Larsen, The Smartphone Challenge (a European perspective) (slideshare.net) (April 2011). I think it is sort of a good account for the fears of the twenty-tens in terms of signaling storms, smartphones (=iPhone) and unbounded traffic growth, etc… See also “Eurasia Mobile Markets Challenges to our Mobile Networks Business Model” (September 2011).

Geoff Huston, “Comparing TCP and QUIC”, APNIC, (November 2022).

Anna Saplitski et al., “CS244 ’16: QUIC loss recovery”, Reproducing Network Research, (May 2016).

RFC9000, “QUIC: A UDP-Based Multiplexed and Secure Transport“, Internet Engineering Task Force (IETF), (February 2022).

Dave Gibbons, What Are Elephant Flows And Why Are They Driving Up Mobile Network Costs? (forbes.com) (February 2019).

K.-C. Lan and J. Heidemann, “A measurement study of correlations of Internet flow characteristic” (February 2006). This seminal paper has inspired many other research works on elephant flows. A flow should be understood as an unidirectional series of IP packets with the same source and destination addresses, port numbers, and protocol numbers. The authors define elephant flows as flows with a size larger than the mean plus three standard deviations of the sampled data. Though it is important to point out that the definition is less important. Such elephant flows are typically few (less than 20%) but will cause cell congestion by reducing the quality of many requiring a service in such an affected cell.

Opanga Networks is a fascinating and truly innovative company. Using AI, they have developed their solution around the idea of how to manage data traffic flows, reduce congestion, and increase customer quality. Their (N2000) solution addresses particular network situations where a limited number of customer data usage takes up a disproportionate amount of resources within the cellular network (i.e., the problem with elephant flows). Opanga’s solution optimizes those traffic congestion-impacting flows and results in an overall increase in service quality and customer experience. Thus, the beauty of the solution is that the few traffic patterns, causing the cellular congestion, continue without degradation, allowing the many traffic patterns that were impacted by the few to continue at their optimum quality level. Overall, many more customers are happy with their service. The operator avoids an investment of relatively poor return and can either save the capital or channel it into a much higher IRR (internal rate of return) investment. I have seen tangible customer improvements exceeding 30+ percent improvement to congested cells, avoiding substantial RAN Capex and resulting Opex. And the beauty is that it does not involve third-party network vendors and can be up and running within weeks with an investment that is easily paid back within a few months. Opanga’s product pipeline is tailor-made to alleviate telecom’s biggest and thorniest challenges. Their latest product, with the appropriate name Joules, enables substantial radio access network energy savings above and beyond what features the telcos have installed from their Radio Access Network suppliers. Disclosure: I am associated with Opanga as an advisor to their industrial advisory board.

The Nature of Telecom Capex – a 2023 Update.

CAPEX … IT’S PERSONAL

I built my first Telco technology Capex model back in 1999. I had just become responsible for what then was called Fixed Network Engineering with a portfolio of all technology engineering design & planning except for the radio access network but including all transport aspects from access up to Core and out to the external world. I got a bit frustrated that every time an assumption changed (e.g., business/marketing/sales), I needed to involve many people in my organization to revise their Capex demand. People that were supposed to get our greenfield network rolled out to our customers. Thus, I built my first Capex model that would take the critical business assumptions, size my network (including the radio access network), and consistently assign the right Capex amounts to each category. The model allowed for rapid turnaround on revised business assumptions and a highly auditable track of changes, planning drivers, and unit prices. Since then, I have built best-practice Capex (and technology Opex) models for many Deutsche Telekom AGs and Ooredoo Group entities. Moreover, I have been creating numerous network and business assessment and valuation models (with an eye on M&A), focusing on technology drivers behind Capex and Opex for many different types of telco companies (30+) operating in an extensive range of market environments around the world (20+). Creating and auditing techno-economical models, making those operational and of high quality, it has (for me) been essential to be extensively involved operationally in the telecom sector.

PRELUDE TO CAPEX.

Capital investments, or Capital Expenditures, or just Capex for short, make Telcos go around. Capex is the monetary means used by your Telco to acquire, develop, upgrade, modernize, and maintain tangible, as well as, in some instances, intangible, assets and infrastructure. We can find Capex back under “Property, Plants, and Buildings” (or PPB) in a company’s balance sheet or directly in the profit & loss (or income) statement. Typically for an investment to be characterized as a capital expense, it needs to have a useful lifetime of at least 2 years and be a physical or tangible asset.

What about software? A software development asset is, by definition, intangible or non-physical. However, it can, and often is, assigned Capex status, although such an assignment requires a bit more judgment (and auditorial approvals) than for a real physical asset.

The “Modern History of Telecom” (in Europe) is well represented by Figure 1, showing the fixed-mobile total telecom Capex-to-Revenue ratio from 1996 to 2025.

From 1996 to 2012, most of the European Telco Capex-to-Revenue ratio was driven by investment into mobile technology introductions such as 2G (GSM) in 1996 and 3G (UMTS) in 2000 to 2002 as well as initial 4G (LTE) investments. It is clear that investments into fixed infrastructure, particularly modernizing and enhancing, have been down-prioritized only until recently (e.g., up to 2010+) when incumbents felt obliged to commence investing in fiber infrastructure and urgent modernization of incumbents’ fixed infrastructures in general. For a long time, the investment focus in the telecom industry was mobile networks and sweating the fixed infrastructure assets with attractive margins.

Figure 1 illustrates the “Modern History of Telecom” in Europe. It shows the historical development of Western Europe Telecom Capex to Revenue ratio trend from 1996 to 2025. The maximum was about 28% at the time 2G (GSM) was launched and at minimum after the cash crunch after ultra-expensive 3G licenses and the dot.com crash of 2020. In recent years, since 2008, Capex to Revenue has been steadily increasing as 4G was introduced and fiber deployment started picking up after 20210. It should be emphasized that the Capex to Revenue trend is for both Mobile and Fixed. It does not include frequency spectrum investments.

Across this short modern history of telecom, possibly one of the worst industry (and technology) investments have been the investments we did into 3G. In Europe alone, we invested 100+ billion Euro (i.e., not included in the Figure) into 2100 MHz spectrum licenses that were supposed to provide mobile customers “internet-in-their-pockets”. Something that was really only enabled with the introduction of 4G from 2010 onwards.

Also, from 2010 onwards, telecom companies (in Europe) started to invest increasingly in fiber deployment as well as upgrading their ailing fixed transport and switching networks focusing on enabling competitive fixed broadband services. But fiber investments have picked up in a significant way in the overall telecom Capex, and I suspect it will remain so for the foreseeable future.

Figure 2 When we take the European Telco revenue (mobile & fixed) over the period 1996 to 2025, it is clear that the mobile business model quantum leaped revenue from its inception to around 2008. After this, it has been in steady decline, even if improvement has been observed in the fixed part of the telco business due to the transition from voice-dominated to broadband. Source: https://stats.oecd.org/

As can be observed from Figure 1, since the telecom credit crunch between 2000 and 2003, the Capex share of revenue has steadily increased from just around 12% in 2004, right after the credit crunch, to almost 20% in 2021. Over the period from 2008 to 2021, the industry’s total revenue has steadily declined, as can be seen in Figure 2. Taking the last 10 years (2011-2021) of mobile and fixed revenue data has, on average, reduced by 4+ billion euros a year. The cumulative annual growth rate (CAGR) was at a great +6% from the inception of 2G services in 1996 to 2008, the year of the “great recession.” From 2008 until 2021, the CAGR has been almost -2% in annual revenue loss for Western Europe.

What does that mean for the absolute total Capex spend over the same period? Figure 3 provides the trend of mobile and fixed Capex spending over the period. Since the “happy days” of 2G and 3G Capex spending, Capex rapidly declined after the industry spent 100+ billion Euro on 3G spectrum alone (i.e., 800+ million euros per MHz or 4+ euros per MHz-pop) before the required multi-billion Euro in 3G infrastructure. Though, after 2009, which was the lowest Capex spend after the 3G licenses were acquired, the telecom industry has steadily grown its annual total Capex spend with ca. +1 billion Euro per year (up to 2021) financing new technology introductions (4G and 5G), substantial mobile radio and core modernizations (a big refresh ca. every 6 -7 years), increasing capacity to continuously cope with consumer demand for broadband, fixed transport, and core infrastructure modernization, and last but not least (since the last ~ 8 years) increasing focus on fiber deployment. Over the same period from 2009 to 2021, the total revenue has declined by ca. 5 billion euros per year in Western Europe.

Figure 3 Using the above “Total Capex to Revenue” (Figure 1) and “Total Revenue” (Figure 2) allows us to estimate the absolute “Total Capex” over the same period. Apart from the big Capex swing around the introduction of 2G and 3G and the sharp drop during the “credit crunch” (2000 – 2003), Capex has grown steadily whilst the industry revenue has declined.

It will be very interesting to see how the next 10 years will develop for the telecom industry and its capital investment. There is still a lot to be done on 5G deployment. In fact, many Telcos are just getting started with what they would characterize as “real 5G”, which is 5G standalone at mid-band frequencies (e.g., > 3 GHz for Europe, 2.5 GHz for the USA), modernizing antenna structures from standard passive (low-order) to active antenna systems with higher-order MiMo antennas, possible mmWave deployments, and of course, quantum leap fiber deployment in laggard countries in Europe (e.g., Germany, UK, Greece, Netherlands, … ). Around 2028 to 2030, it would be surprising if the telecoms industry would not commence aggressively selling the consumer the next G. That is 6G.

At this moment, the next 3 to 5 years of Capital spending are being planned out with the aim of having the 2024 budgets approved by November or December. In principle, the long-term plans, that is, until 2027/2028, have agreed on general principles. Though, with the current financial recession brewing. Such plans would likely be scrutinized as well.

I have, over the last year since I published this article, been asked whether I had any data on Ebitda over the period for Western Europe. I have spent considerable time researching this, and the below chart provides my best shot at such a view for the Telecom industry in Western Europe from the early days of mobile until today. This, however, should be taken with much more caution than the above Caex and Revenues, as individual Telco’ s have changed substantially over the period both in their organizational structure and how results have been represented in their annual reports.

Figure 4 illustrates the historical development of the EBITDA margin over the period from 1995 to 2022 and a projection of the possible trends from 2023 onwards. Caution: telcos’ corporate and financial structures (including reporting and associated transparency into details) have substantially changed over the period. The early first 10+ years are more uncertain concerning margin than the later years. Directionally it is representative of the European Telco industry. Take Deutsche Telekom AG, it “lost” 25% of its revenue between 2005 and 2015 (considering only German & European segments). Over the same period, it shredded almost 27% of its Opex.

CAVEATS

Of course, Capex to Revenue ratios, any techno-economical ratio you may define, or cost distributions of any sort are in no way the whole story of a Telco life-and-budget cycle. Over time, due to possible structural changes in how Telcos operate, the past may not reflect the present and may even be less telling in the future.

Telcos may have merged with other Telcos (e.g., Mobile with Fixed), they may have non-Telco subsidiaries (i.e., IT consultancies, management consultancies, …), they may have integrated their fixed and mobile business units, they may have spun off their infrastructure, making use of towercos for their cell site needs (e.g., GD Towers, Vantage, Cellnex, American Towers …), open fibercos (e.g., Fiberhost Poland, Open Dutch Fiber, …) for their fiber needs, hyperscale cloud providers (e.g., AWS, Amazon, Microsoft Azure, ..) for their platform requirements. Capex and Opex will go left and right, up and down, depending on each of the above operational elements. All that may make comparing one Telco’s Capex with another Telco’s investment level and operational state-of-affairs somewhat uncertain.

I have dear colleagues who may be much more brutal. In general, they are not wrong but not as brutally right as their often high grounds could indicate. But then again, I am not a black-and-white guy … I like colors.

So, I believe that investment levels, or more generally, cost levels, can be meaningfully compared between Telcos. Cost, be it Opex or Capex, can be estimated or modeled with relatively high accuracy, assuming you are in the know. It can be compared with other comparables or non-comparables. Though not by your average financial controller with no technology knowledge and in-depth understanding.

Alas, with so many things in this world, you must understand what you are doing, including the limitations.

IT’S THAT TIME OF THE YEAR … CAPEX IS IN THE AIR.

It is the time of the year when many telcos are busy updating their business and financial planning for the following years. It is not uncommon to plan for 3 to 5 years ahead. It involves scenario planning and stress tests of those scenarios. Scenarios would include expectations of how the relevant market will evolve as well as the impact of the political and economic environment (e.g., covid lockdowns, the war in Ukraine, inflationary pressures, supply-chain challenges, … ) and possible changes to their asset ownership (e.g., infrastructure spin-offs).

Typically, between the end of the third or beginning of the fourth quarter, telecommunications businesses would have converged upon a plan for the coming years, and work will focus on in-depth budget planning for the year to come, thus 2024. This is important for the operational part of the business, as work orders and purchase orders for the first quarter of the following year would need to be issued within the current year.

The planning process can be sophisticated, involving many parts of the organization considering many scenarios, and being almost mathematical in its planning nature. It can be relatively simple with the business’s top-down financial targets to adhere to. In most instances, it’s likely a combination of both. Of course, if you are a publicly-traded company or part of one, your past planning will generally limit how much your new planning can change from the old. That is unless you improve upon your old plans or have no choice but to disappoint investors and shareholders (typically, though, one can always work on a good story). In general, businesses tend to be cautiously optimistic about uncertain business drivers (e.g., customer growth, churn, revenue, EBITDA) and conservatively pessimistic on business drivers of a more certain character (e.g., Capex, fixed cost, G&A expenses, people cost, etc..). All that without substantially and negatively changing plans too much between one planning horizon to the next.

Capital expense, Capex, is one of the foundations, or enablers, of the telco business. It finances the building, expansion, operation, and maintenance of the telco network, allowing customers to enjoy mobile services, fixed broadband services, TV services, etc., of ever-increasing quality and diversity. I like to look at Capex as the investments I need to incur in order to sustain my existing revenues, grow my revenues (preferably beating inflationary pressures), and finance any efficiency activities that will reduce my operational expenses in the future.

If we want to make the value of Capex to the corporation a little firmer, we need a little bit of financial calculus. We can write a company’s value (CV) as

CV \; = \; \frac{FCFF_0 \; (1 \; + \; g)}{\; WACC \; - \; g \; }

With g being the expected growth rate in free cash flow in perpetuity, WACC is the Weighted Average Cost of Capital, and FCFF is the Free Cash Flow to the Firm (i.e., company) that we can write as follows;

FCFF = NOPLAT + Depreciation & Amortization (DA) – ∆ Working Capital – Capex,

with NOPLAT being the Net Operating Profit Less Adjusted Taxes (i.e., EBIT – Cash Taxes). So if I have two different Capex budgets with everything else staying the same despite the difference in Capex (if true life would be so easy, right?);

CV_X \; - \; CV_Y \; = \; \Delta Capex \; \left[ \frac{1 \; - \; g}{\; WACC \; - \; g \;} \right]

assuming that everything except the proposed Capex remains the same. With a difference of, for example, 10 Million euros, a future growth rate g = 0% (maybe conservative), and a WACC of 5% (note: you can find the latest average WACC data for the industry here, which is updated regularly by New York University Leonard N. Stern School of Business. The 5% chosen here serves as an illustration only (e.g., this was approximately representative of Telco Europe back in 2022, as of July 2023, it was slightly above 6%). You should always choose the weighted average cost of capital that is applicable to your context). The above formula would tell us that the investment plan having 10 Million euros less would be 200 Million euros more valuable (20× the Capex not spent). Anyone with a bit of (hands-on!) experience in budget business planning would know that the above valuation logic should be taken with a mountain of salt. If you have two Capex plans with no positive difference in business or financial value, you should choose the plan with less Capex (and don’t count yourself rich on what you did not do). Of course, some topics may require Capex without obvious benefits to the top or bottom line. Such examples are easy to find, e.g., regulatory requirements or geo-political risks force investments that may appear valueless or even value destructive. Those require meticulous considerations, and timing may often play a role in optimizing your investment strategy around such topics. In some cases, management will create a narrative around a corporate investment decision that fits an optimized valuation, typically hedging on one-sided inflated risks to the business if not done. Whatever decision is made, it is good to remember that Capex, and resulting Opex, is in most cases a certainty. The business benefits in terms of more revenue or more customers are uncertain as is assuming your business will be worth more in a number of years if your antennas are yellow and not green. One may call this the “Faith-based case of more Capex.”

Figure 5 provides an overview of Western Europe of annual Fixed & Mobile Capex, Total and Service Revenues, and Capex to Revenue ratio (in %). Source: New Street Research Western Europe data.

Figure 5 provides an overview of Western European telcos’ revenue, Capex, and Capex to Revenue ratio. Over the last five years, Western European telcos have been spending increasingly higher Capex levels. In 2021 the telecom Capex was 6 billion euros higher than what was spent in 2017, about 13% higher. Fixed and mobile service revenue increased by 14 billion euros, yielding a Capex to Service revenue ratio of 23% in 2021 compared to 20.6% in 2017. In most cases, the total revenue would be reported, and if luck has its way (or you are a subscriber to New Street Research), the total Capex. Thus, capturing both the mobile and the fixed business, including any non-service-related revenues from the company. As defined in this article, non-service-related revenues would comprise revenues from wholesales, sales of equipment (e.g., mobile devices, STB, and CPEs), and other non-service-specific revenues. As a rule of thumb, the relative difference between total and service-related revenues is usually between 1.1 to 1.3 (e.g., the last 5-year average for WEU was 1.17). 

One of the main drivers for the Western European Capex has firstly been aggressive fiber-to-the-premise (FTTP) deployment and household fiber connectivity, typically measured in homes passed across most of the European metropolitan footprint as well as urban areas in general. As fiber covers more and more residential households, increased subscription to fiber occurs as well. This also requires substantial additional Capex for a fixed broadband business. Figure 6 illustrates the annual FTTP (homes passed) deployment volume in Western Europe as well as the total household fiber coverage.

Figure 6 above shows the fiber to the premise (FTTP) home passed deployment per anno from 2018 to 2021 Actual (source: European Commission’s “Broadband Coverage in Europe 2021” authored by Omdia et al.) and 2021 to 2025 projected numbers (i.e., this author’s own assessment). During the period from 2018 to 2021, household fiber coverage grew from 27% to 43% and is expected to grow to at least 71% by 2026 (not including overbuilt, thus unique household covered). The overbuilt data are based on a work in progress model and really should be seen as directional (it is difficult to get data with respect to the overbuilt).

A large part of the initial deployment has been in relatively dense urban areas as well as relying on aerial fiber deployment outside bigger metropolitan centers. For example, in Portugal, with close to 90% of households covered with fiber as of 2021, the existing HFC infrastructure (duct, underground passageways, …) was a key enabler for the very fast, economical, and extensive household fiber coverage there. Although many Western European markets will be reaching or exceeding 80% of fiber coverage in their urban areas, I would expect to continue to see a substantial amount of Capex being attributed. In fact, what is often overlooked in the assessment of the Capex volume being committed to fiber deployment, is that the unit-Capex is likely to increase substantially as countries with no aerial deployment option pick up their fiber rollout pace (e.g., Germany, the UK, Netherlands) and countries with an already relatively high fiber coverage go increasingly suburban and rural.

Figure 7 above shows the total fiber to the premise (FTTP) home remaining per anno from 2018 to 2021 Actual (source: European Commission’s “Broadband Coverage in Europe 2021” authored by Omdia et al.). The 2022 to 2030 projected remaining households are based on the author’s own assessment and does not consider overbuilt numbers.

The second main driver is in the domain of mobile network investment. The 5G radio access deployment has been a major driver in 2020 and 2021. It is expected to continue to contribute significantly to mobile operators Capex in the coming 5 years. For most Western European operators, the initial 5G deployment was at 700 MHz, which provides a very good 5G coverage. However, due to limited frequency spectral bandwidth, there are not very impressive speeds unless combined with a solid pre-existing 4G network. The deployment of 5G at 700 MHz has had a fairly modest effect on Mobile Capex (apart from what operators had to pay out in the 5G spectrum auctions to acquire the spectrum in the first place). Some mobile networks would have been prepared to accommodate the 700 MHz spectrum being supported by existing lower-order or classical antenna infrastructure. In 2021 and going forward, we will see an increasing part of the mobile Capex being allocated to 3.X GHz deployment. Far more sophisticated antenna systems, which co-incidentally also are far more costly in unit-Capex terms, will be taken into use, such as higher-order MiMo antennas from 8×8 passive MiMo to 32×32 and 64×64 active antennas systems. These advanced antenna systems will be deployed widely in metropolitan and urban areas. Some operators may even deploy these costly but very-high performing antenna systems in suburban and rural clutter with the intention to provide fixed-wireless access services to areas that today and for the next 5 – 7 years continue to be under-served with respect to fixed broadband fiber services.

Overall, I would also expect mobile Capex to continue to increase above and beyond the pre-2020 level.

As an external investor with little detailed insights into individual telco operations, it can be difficult to assess whether individual businesses or the industry are investing sufficiently into their technical landscape to allow for growth and increased demand for quality. Most publicly available financial reporting does not provide (if at all) sufficient insights into how capital expenses are deployed or prioritized across the many facets of a telco’s technical infrastructure, platforms, and services. As many telcos provide mobile and fixed services based on owned or wholesaled mobile and fixed networks (or combinations there off), it has become even more challenging to ascertain the quality of individual telecom operations capital investments.

Figure 8 illustrates why analysts like to plot Total Revenue against Total Capex (for fixed and mobile). It provides an excellent correlation. Though great care should be taken not to assume causation is at work here, i.e., “if I invest X Euro more, I will have Y Euro more in revenues.” It may tell you that you need to invest a certain level of Capex in sustaining a certain level of Revenue in your market context (i.e., country geo-socio-economic context). Source: New Street Research Western Europe data covering the following countries: AT, BE, DK, FI, FR, DE, GR, IT, NL, NO, PT, ES, SE, CH, and UK.

Why bother with revenues from the telco services? These would typically drive and dominate the capital investments and, as such, should relate strongly to the Capex plans of telcos. It is customary to benchmark capital spending by comparing the Capex to Revenue (see Figure 8), indicating how much a business needs to invest into infrastructure and services to obtain a certain income level. If nothing is stated, the revenue used for the Capex-to-Revenue ratio would be total revenue. For telcos with fixed and mobile businesses, it’s a very high-level KPI that does not allow for too many insights (in my opinion). It requires some de-averaging to become more meaningful.

THE TELCO TECHNOLOGY FACTORY

Figure 8 (below) illustrates the main capital investment areas and cost drivers for telecommunications operations with either a fixed broadband network, a mobile network, or both. Typically, around 90% of the capital expenditures will be invested into the technology factory comprising network infrastructure, products, services, and all associated with information technology. The remaining ca. 10% will be spent on non-technical infrastructures, such as shops, office space, and other non-tech tangible assets.

Figure 9 Telco Capex is spent across physical (or tangible) infrastructure assets, such as communications equipment, brick & mortar that hosts the equipment, and staff. Furthermore, a considerable amount of a telcos Capex will also go to human development work, e.g., for IT, products & services, either carried out directly by own staff or third parties (i.e., capitalized labor). The above illustrates the macro-levels that make out a mobile or fixed telecommunications network, and the most important areas Capex will be allocated to.

If we take the helicopter view on a telco’s network, we have the customer’s devices, either mobile devices (e.g., smartphone, Internet of Things, tablet, … ) or fixed devices, such as the customer premise equipment (CPE) and set-top box. Typically the broadband network connection to the customer’s premise would require a media converter or optical network terminator (ONT). For a mobile network, we have a wireless connection between the customer device and the radio access network (RAN), the cellular network’s most southern point (or edge). Radio access technology (e.g., 3G, 4G, or 5G) is very important determines for the customer experience. For a fixed network connection, we have fiber or coax (cable) or copper connecting the customer’s premise and the fixed network (e.g., street cabinet). Access (in general) follows the distribution of the customers’ locations and concentration, and their generated traffic is aggregated increasingly as we move north and up towards and into the core network. In today’s modern networks, big-fat-data broadband connections interconnect with the internet and big public data centers hosting both 3rd party and operator-provided content, services, and applications that the customer base demands. In many existing networks, data centers inside the operator’s own “walls” likewise will have service and application platforms that provide customers with more of the operator’s services. Such private data centers, including what is called micro data centers (μDCs) or edge DCs, may also host 3rd party content delivery networks that enable higher quality content services to a telco’s customer base due to a higher degree of proximity to where the customers are located compared to internet-based data centers (that could be located anywhere in the world).

Figure 10 illustrates break-out the details of a mobile as well as a fixed (fiber-based) network’s infrastructure elements, including the customers’ various types of devices.

Figure 10 illustrates that on a helicopter level, a fixed and a classical mobile network structure are reasonably similar, with the main difference of one network carrying the mobile traffic and the other the fixed traffic. The traffic in the fixed network tends to be at least ten larger than in the mobile network. They mainly differ in the access node and how it connects to the customer. For fixed broadband, the physical connection is established between, for example, the ONL (Optical Line Terminal) in the optical distribution network and ONT (Optical Line Terminal) at the customer’s home via a fiber line (i.e., wired). The wireless connection for mobile is between the Radio Node’s antenna and the end-user device. Note: AAS: Advanced Antenna System (e.g., MiMo, massive-MiMo), BBU: Base-band unit, CPE: Customer Premise Equipment, IOT: Internet of Things, IX: Internet Exchange, OLT: Optical Line Termination, and ONT: Optical Network Termination (same as ONU: Optical Network Unit).

From Figure 10 above, it should be clear that there are a lot of similarities between the mobile and fixed networks, with the biggest difference being that the mobile access network establishes a wireless connection to the customer’s devices versus the fixed access network physically wired connection to the device situated at the customer’s premises.

This is good news for fixed-mobile telecommunications operators as these will have considerable architectural and, thus, investment synergies due to those similarities. Although, the sad truth is that even today, many fixed-mobile telco companies, particularly incumbent, remain far away from having achieved fixed-mobile network harmonization and conversion.

Moreover, there are many questions to be asked as well as concerns when it comes to our industry’s Capex plans; what is the Capex required to accommodate data growth, are existing budgets allowing for sufficient network densification (to accommodate growth and quality), and what is the Capex trade-off between frequency spectrum acquisition, antenna technology, and site densification, how much Capex is justified to pursue the best network in a given market, what is the suitable trade-off between investing in fiber to the home and aggressive 5G deployment, should (incumbent) telco’s pursue fixed wireless access (FWA) and how would that impact their capital plans, what is the right antenna strategy, etc…

On a high level, I will provide guidance on many of the above questions, in this article and in forthcoming ones.

THE CAPEX STRUCTURE OF A TELECOM COMPANY.

When taking a macro look at Capex and not yet having a good idea about the breakdown between mobile and fixed investment levels, we are helped that on a macro level, the Capex categories are similar for a fixed and a mobile network. Apart from the last mile (access) in a fixed network is a fixed line (e.g., fiber, coax, or copper) and a wireless connection in a mobile network; the rest is comparable in nature and function. This is not surprising as a business with a fixed-mobile infrastructure would (should!) leverage the commonalities in transport and part of the access architecture.

In the fixed business, devices required to enable services on the fixed-line network at the fixed customers’ home (e.g., CPE, STB, …) are a capital expense driven by new customers and device replacement. This is not the case for mobile devices (i.e., an operational expense).

Figure 11 above illustrates the major Capex elements and their distribution defined by the median, lower and upper quantiles (the box), and lower and upper extremes (the whiskers) of what one should expect of various elements’ contribution to telco Capex. Note: CPE: Customer Premise Equipment, STB: Set-Top Box.

CUSTOMER PREMISE EQUIPMENT (CPE) & SET-TOP BOXES (STB) investments ARE between 10% to 20% of the TelEcoM Capex.

The capital investment level into Customer premise equipment (CPE) depends on the expected growth in the fixed customer base and the replacement of old or defective CPEs already in the fixed customer base. We would generally expect this to make out between 10% to 20% of the total Capex of a fixed-mobile telco (and 0% in a mobile-only business). When migrating from one access technology (e.g., copper/xDSL phase-out, coaxial cable) to another (e.g., fiber or hybrid coaxial cable), more Capex may be required. Similar considerations for set-top boxes (STB) replacement due to, for example, a new TV platform, non-compliance with new requirements, etc. Many Western European incumbents are phasing out their extensive and aging copper networks and replacing those with fiber-based networks. At the same time, incumbents may have substantial capital requirements phasing out their legacy copper-based access networks, the capital burden on other competitor telcos in markets where this is happening if such would have a significant copper-based wholesale relationship with the incumbent.

In summary, over the next five years, we should expect an increase in CPE-based Caped due to the legacy copper phase-out of incumbent fixed telcos. This will also increase the capital pressure in transport and access categories.

CPE & STB Capex KPIs: Capex share of Total and Capex per Gross Added Customer.

Capex modeling comment: Use your customer forecast model as the driver for new CPEs. Your research should give you an idea of the price range of CPEs used by your target fixed broadband business. Always include CPE replacement in the existing base and the gross adds for the new CPEs. Many fixed broadband retail businesses have been conservative in the capabilities of CPEs they have offered to their customer base (e.g., low-end cheaper CPEs, poor WiFi quality, ≤1Gbps), and it should be considered that these may not be sufficient for customer demand in the following years. An incumbent with a large install base of xDSL customers may also have a substantial migration (to fiber) cost as CPEs are required to be replaced with fiber cable CPEs. Due to the current supply chain and delivery issues, I would assume that operators would be willing to pay a premium for getting critical stock as well as having priority delivery as stock becomes available (e.g., by more expensive shipping means).

Core network & service platformS, including data centers, investments ARE between 8% to 12% of the telecom Capex.

Core network and service platforms should not take up more than 10% of the total Capex. We would regard anything less than 5% or more than 15% as an anomaly in Capital prioritization. This said, over the next couple of years, many telcos with mobile operations will launch 5G standalone core networks, which is a substantial change to the existing core network architecture. This also raises the opportunity for lifting and shifting from monolithic systems or older cloud frameworks to cloud-native and possibly migrating certain functions onto public cloud domains from one or more hyperscalers (e.g., AWS, Azure, Google). As workloads are moved from telco-owned data centers and own monolithic core systems, telco technology cost structure may change from what prior was a substantial capital expense to an operational expense. This is particularly true for software-related developments and licensing.

Another core network & service platform Capex pressure point may come from political or investor pressure to replace Chinese network elements, often far removed from obsolescence and performance issues, with non-Chinese alternatives. This may raise the Core network Capex level for the next 3 to 5 years, possibly beyond 12%. Alas, this would be temporary.

In summary, the following topics would likely be on the Capex priority list;

1. Life-cycle management investments (I like to call Business-as-Usual demand) into software and hardware maintenance, end-of-life replacements, growth (software licenses, HW expansions), and miscellaneous topics. This area tends to dominate the Capex demand unless larger transformational projects exist. It is also the first area to be de-prioritized if required. Working with Priority 1, 2, and 3 categorizations is a good Capital planning methodology. Where Priority 1 is required within the following budget year 1, Prio. 2 is important but can wait until year two without building up too much technical debt and Prio. 3 is nice to have and not expected to be required for the next two subsequent budget years.

2. 5G (Standalone, SA) Core Network deployment (timeline: 18 – 24 months).

3. Network cloudification, initially lift-and-shift with subsequent cloud-native transformation. The trigger point will be enabling the deployment of the 5G standalone (SA) core. Operators will also take the opportunity to clean up their data centers and network core location (timeline: 24 – 36 months).

4. Although edge computing data centers (DC) typically are supposed to support the radio access network (e.g., for Open-RAN), the capital assignment would be with the core network as the expertise for this resides here. The intensity of this Capex (if built by the operator, otherwise, it would be Opex) will depend on the country’s size and fronthaul/backhaul design. The investment trigger point would generally commence on Open-RAN deployment (e.g., 1&1 & Telefonica Germany). The edge DC (or μDC) would most like be standard container-sized (or half that size) and could easily be provided by independent towerco or specific edge-DC 3rd party providers lessening the Capex required for the telco. For smaller geographies (e.g., Netherlands, Denmark, Austria, …), I would not expect this item to be a substantial topic for the Capex plans. Mainly if Open-RAN is not being pursued over the next 5 – 10 years by mainstream incumbent telcos.

5. Chinese supplier replacement. The urgency would depend on regulatory pressure, whether compensation is provided (unlikely) or not, and the obsolescence timeline of the infrastructure in question. Given the high quality at very affordable economics, I expect this not to have the biggest priority and will be executed within timelines dictated more by economics and obsolescence timelines. In any case, I expect that before 2025 most European telcos will have phased out Chinese suppliers from their Core Networks, incl. any Service platforms in use today (timeline: max. 36 months).

6. Cybersecurity investments strengthen infrastructure, processes, and vital data residing in data centers, service platforms, and core network elements. I expect a substantial increase in Capex (and Opex) arising from the telco’s focus on increasing the cyber protection of their critical telecom infrastructure (timeline: max 18 months with urgency).

Core Capex KPIs: Capex share of Total (knowing the share, it is straightforward to get the Capex per Revenue related to the Core), Capex per Incremental demanded data traffic (in Gigabits and Gigabyte per second), Capex per Total traffic, Capex per customer.

Capex modeling comment: In case I have little specific information about an operator’s core network and service platforms, I would tend to model it as a Euro per Customer, Euro per-incremental customer, and Euro per incremental traffic. Checking that I am not violating my Capex range that this category would typically fall within (e.g., 8% to 12%). I would also have to consider obsolescence investments, taking, for example, a percentage of previous cumulated core investments. As mobile operators are in the process, or soon will be, of implementing a 5G standalone core, having an idea of the number of 5G customers and their traffic would be useful to factor that in separately in this Capex category.

Estimating the possible Capex spend on Edge-RAN locations, I would consider that I need ca. 1 μDC per 450 to 700 km2 of O-RAN coverage (i.e., corresponding to a fronthaul distance between the remote radio and the baseband unit of 12 to 15 km). There may be synergies between fixed broadband access locations and the need for μ-datacenters for an O-RAN deployment for an integrated fixed-mobile telco. I suspect that 3rd party towercos, or alike, may eventually also offer this kind of site solutions, possibly sharing the cost with other mobile O-RAN operators.

Transport – core, metro & aggregation investments are between 5% to 15% of Telecom Capex.

The transport network consists of an optical transport network (OTN) connecting all infrastructure nodes via optical fiber. The optical transport network extends down to the access layer from the Core through the Metro and Aggregation layers. On top, the IP network ensures logical connection and control flow of all data transported up and downstream between the infrastructure nodes. As data traffic is carried from the edge of the network upstream, it is aggregated at one or several places in the network (and, of course, disaggregated in the downstream direction). Thus, the higher the transport network, the more bandwidth is supported on the optical and the IP layers. Most of the Capex investment needs would ensure that sufficient optical and IP capacity is available, supporting the growth projections and new service requirements from the business and that no bottlenecks can occur that may have disastrous consequences on customer experience. This mainly comes down to adding cards and ports to the already installed equipment, upgrading & replacing equipment as it reaches capacity or quality limitations, or eventually becoming obsolete. There may be software license fees associated with growth or the introduction of new services that also need to be considered.

Figure 12 above illustrates (high-level) the transport network topology with the optical transport network and IP networking on top. Apart from optical and IP network equipment, this area often includes investments into IP application functions and related hardware (e.g., BNG, DHCP, DNS, AAA RADIUS Servers, …), which have not been shown in the above. In most cases, the underlying optical fiber network would be present and sufficiently scalable, not requiring substantial Capex apart from some repair and minor extensions. Note DWDM: Dense Wavelength-Division multiplexing is an optical fiber multiplexing technology that increases the bandwidth utilization of a FON, BNG: Border Network Gateway connecting subscribers to a network or an internet service providers (ISP) network, important in wholesale arrangements where a 3rd party provides aggregation and access. DHCP: Dynamic Host Configuration Protocol providing IP address allocation and client configurations. AAA: Authentication, Authorization, and Accounting of the subscriber/user, RADIUS: Remote Authentication Dial-In User Service (Server) providing the AAA functionalities.

Although many telcos operate fixed-mobile networks and might even offer fixed-mobile converged services, they may still operate largely separate fixed and mobile networks. It is not uncommon to find very different transport design principles as well as supplier landscapes between fixed and mobile. The maturity, when each was initially built, and technology roadmaps have historically been very different. The fixed traffic dynamics and data volumes are several times higher than mobile traffic. The geographical presence between fixed and mobile tends to be very different (unless the telco of interest is the incumbent with a considerable copper or HFC network). However, the biggest reason for this state of affairs has been people and technology organizations within the telcos resisting change and much more aggressive transport consolidation, which would have been possible.

The mobile traffic could (should!) be accommodated at least from the metro/aggregation layers and upstream through the core transport. There may even be some potential for consolidation on front and backhauls that are worth considering. This would lead to supplier consolidation and organizational synergies as the technology organizations converged into a fixed-mobile engineering organization rather than two separate ones.

I would expect the share of Capex to be on the higher end of the likely range and towards the 10+% at least for the next couple of years, mainly if fixed and mobile networks are being harmonized on the transport level, which may also create an opportunity reduce and harmonize the supplier landscape.

In summary, the following topics would likely be on the Capex priority list;

  1. Life-cycle management (business-as-usual) investments, accommodating growth including new service and quality requirements (annual business-as-usual). There are no indications that the traffic or mobile traffic growth rate over the next five years will be very different from the past. If anything, the 5-year CAGR is slightly decreasing.
  2. Consolidating fixed and mobile transport networks (timelines: 36 to 60 months, depending on network size and geography). Some companies are already in the process of getting this done.
  3. Chinese supplier replacement. To my knowledge, there are fewer regulatory discussions and political pressure for telcos to phase out transport infrastructure. Nevertheless, with the current geopolitical climate (and the upcoming US election in 2024), telcos need to consider this topic very carefully; despite economic (less competition, higher cost), quality, and possible innovation, consequences may result in a departure from such suppliers. It would be a natural consideration in case of modernization needs. An accelerated phase-out may be justified to remove future risks arising from geopolitical pressures.

While I have chosen not to include the Access transport under this category, it is not uncommon to see its budget demand assigned to this category, as the transport side of access (fronthaul and backhaul transport) technically is very synergetic with the transport considerations in aggregation, metro, and core.

Transport Capex KPIs: Capex share of Total, the amount of Capex allocated to Mobile-only and Fixed-only (and, of course, to a harmonized/converged evolved transport network), The Utilization level (if data is available or modeled to this level). The amount of Capex-spend on fiber deployment, active and passive optical transport, and IP.

Capex modeling comment: I would see whether any information is available on a number of core data centers, aggregation, and metro locations. If this information is available, it is possible to get an impression of both core, aggregation, and metro transport networks. If this information is not available, I would assume a sensible transport topology given the particularities of the country where the operator resides, considering whether the operator is an incumbent fixed operator with mobile, a mobile-only operation, or a mobile operator that later has added fixed broadband to its product portfolio. If we are not talking about a greenfield operation, most, if not all, will already be in place, and mainly obsolescence, incremental traffic, and possible transport network extensions would incur Capex. It is important to understand whether fixed-mobile operations have harmonized and integrated their transport infrastructure or large-run those independently of each other. There is substantial Capex synergy in operating an integrated transport network, although it will take time and Capex to get to that integration point.

Access investments are typically between 35% to 50% of the Telecom Capex.

Figure 13 (above) is similar to Figure 8 (above), emphasizing the access part of Fixed and Mobile networks. I have extended the mobile access topology to capture newer development of Open-RAN and fronthaul requirements with pooling (“centralizing”) the baseband (BBU) resources in an edge cloud (e.g., container-sized computing center). Fronthaul & Open-RAN poses requirements to the access transport network. It can be relatively costly to transform a legacy RAN backhaul-only based topology to an Open-RAN fronthaul-based topology. Open-RAN and fronthaul topologies for Greenfield deployments are more flexible and at least require less Capex and Opex. 

Mobile Access Capex.

I will define mobile access (or radio access network, RAN) as everything from the antenna on the site location that supports the customers’ usage (or traffic demand) via the active radio equipment (on-site or residing in an edge-cloud datacenter), through the fronthaul and backhaul transport, up to the point before aggregation (i.e., pre-aggregation). It includes passive and active infrastructure on-site, steal & mortar or storage container, front- and backhaul transport, data center software & equipment (that may be required in an edge data center), and any other hardware or software required to have a functional mobile service on whatever G being sold by the mobile operator.

Figure 14 above illustrates a radio access network architecture that is typically deployed by an incumbent telco supporting up to 4G and 5G. A greenfield operation on 5G (and maybe 4G) could (maybe should?) choose to disaggregate the radio access node using an open interface, allowing for a supplier mix between the remote radio head (RRH and digital frontend) at the site location and the centralized (or distributed) baseband unit (BBU). Fronthaul connects the antenna and RRH with a remote BBU that is situated at an edge-cloud data center (e.g., storage container datacenter unit = micro-data center, μDC). Due to latency constraints, the distance between the remote site and the BBU should not be much more than 10 km. It is customary to name the 5G new radio node a gNB (g-Node-B) like the 4G radio node is named eNB (evolved-Node-B).

When considering the mobile access network, it is good to keep in mind that, at the moment, there are at least two main flavors (that can be mixed, of course) to consider. (1) A classical architecture with the site’s radio access hardware and software from a single supplier, with a remote radio head (RRH) as well as digital frontend processing at or near the antenna. The radio nodes do not allow for mixing suppliers between the remote RF and the baseband. Radio nodes are connected to backhaul transmission that may be enabled by fiber or microwave radios. This option is simple and very well-proven. However, it comes with supplier lock-in and possibly less efficient use of baseband resources as these are likewise fixed to the radio node that the baseband unit is installed. (2) A new Open- or disaggregated radio access network (O-RAN), with the Antenna and RHH at the site location (the RU, radio unit in O-RAN), then connected via fronthaul (≤ 10 – 20 km distance) to a μDC that contains the baseband unit (the DU, distributed unit in O-RAN). The μDC would then be connected to the backhaul that connects northbound to the Central Unit (CU), aggregation, and core. The open interface between the RRH (and digital frontend) and the BBU allows different suppliers and hosts the RAN-specific software on common off-the-shelf (COTS) computing equipment. It allows (in theory) for better scaling and efficiency with the baseband resources. However, the framework has not been standardized by the usual bodies of standardization (e.g., 3GPP) and is not universally accepted as a common standard that all telco suppliers would adhere to. It also has not reached maturity yet (sort of obvious) and is currently (as of July 2022) seen to be associated with substantial cyber-security risks (re: maturity). It may be an interesting deployment model for greenfield operations (e.g., Rakuten Mobile Japan, Jio India, 1&1 Germany, Dish Mobile USA). The O-RAN options are depicted in Figure 15 below.

Figure 15 The above illustrates a generic Open RAN architecture starting with the Advanced Antenna System (AAS) and the Radio Unit (RU). The RU contains the functionality associated with the (OSI model) layer 1, partitioned into the lower layer 1 functions with the upper layer 1 functions possibly moved out of the RU and into the Distributed Unit (DU) connected via the fronthaul transport. The DU, which typically will be connected to several RUs, must ensure proper data link management, traffic control, addressing, and reliable communication with the RU (i.e., layer 2 functionalities). The distributed unit connects via the mid-haul transport link to the so-called Central Unit (CU), which typically will be connected to several DUs. The CU plays an important role in the overall ORAN architecture, acting as a central control and management vehicle that coordinates the operations of DUs and RUs, ensuring an efficient and effective operation of the ORAN network. As may be obvious, from the summary of its functionality, layer 3 functionalities reside in the CU. The Central Unit connects via backhaul, aggregation, and core transport to the core network.

For established incumbent mobile operators, I do not see Option (2) as very attractive, at least for the next 5 – 7 years when many legacy technologies (i.e., non-5G) remain to be supported. The main concern should be the maturity, lack of industry-wise standardization, as well as cost of transforming existing access transport networks into compliance with a fronthaul framework. Most likely, some incumbents, the “brave” ones, will deploy O-RAN for 1 or a few 5G bands and keep their legacy networks as is. Most incumbent mobile operators will choose (actually have chosen already) conventional suppliers and the classical topology option to provide their 5G radio access network as it has the highest synergy with the access infrastructure already deployed. Thus, if my assertion is correct, O-RAN will only start becoming mass-market mainstream in 5 to 7 years, when existing deployments become obsolete, and may ultimately become mass-market viable by the introduction of 6G towards the end of the twenties. The verdict is very much still out there, in my opinion.

Planning the mobile-radio access networks Capex requirements is not (that) difficult. Most of it can be mathematically derived and be easily assessed against growth expectations, expected (or targeted) network utilization (or efficiency), and quality. The growth expectations (should) come from consumer and retail businesses’ forecast of mobile customers over the next 3 to 5 years, their expected usage (if they care, otherwise technology should), or data-plan distribution (maybe including technology distributions, if they care. Otherwise, technology should), as well as the desired level of quality (usually the best).

Figure 16 above illustrates a typical cellular planning structural hierarchy from the sector perspective. One site typically has 3 sectors. One sector can have multiple cells depending on the frequency bands installed in the (multi-band) antennas. Massive MiMo antenna systems provide target cellular beams toward the user’s device that extend the range of coverage (via the beam). Very fast scheduling will enable beams to be switched/cycled to other users in the covered sector (a bit oversimplified). Typically, the sector is planned according to the cell utilization, thus on a frequency-by-frequency basis.

Figure 17 illustrates that most investment drivers can be approached as statistical distributions. Those distributions will tell us how much investment is required to ensure that a critical parameter X remains below a pre-defined critical limit Xc within a given probability (i.e., the proportion of the distribution exceeding Xc). The planning approach will typically establish a reference distribution based on actual data. Then based on marketing forecasts, the planners will evolve the reference based on the expected future usage that drives the planning parameter. Example: Let X be the customer’s average speed in a radio cell (e.g., in a given sector of an antenna site) in the busy hour. The business (including technology) has decided it will target 98% of its cells and should provide better than 10 Mbps for more than 50% of the active time a customer uses a given cell. Typically, we will have several quality-based KPIs, and the more breached they are, the more likely it will be that a Capex action is initiated to improve the customer experience.

Network planners will have access to much information down to the cell level (i.e., the active frequency band in a given sector). This helps them develop solid planning and statistical models that provide confidence in the extrapolation of the critical planning parameters as demand changes (typically increases) that subsequently drive the need for expansions, parameter adjustments, and other optimization requirements. As shown in Figure 17 above, it is customary to allow for some cells to breach a defined critical limit Xc, usually though it is kept low to ensure a given customer experience level. Examples of planning parameters could be cell (and sector) utilization in the busy hour, active concurrent users in cell (or sector), duration users spend at a or lower deemed poor speed level in a given cell, physical resource block (the famous PRB, try to ask what it stands for & what it means😉) utilization, etc.

The following topics would likely be on the Capex priority list;

  1. New radio access deployment Capex. This may be for building new sites for coverage, typically in newly built residential areas, and due to capacity requirements where existing sites can no longer support the demand in a given area. Furthermore, this Capex also covers a new technology deployment such as 5G or deploying a new frequency band requiring a new antenna solution like 3.X GHz would do. As independent tower infrastructure companies (towerco) increasingly are used to providing the required passive site infrastructure solution (e.g., location, concrete, or steel masts/towers/poles), this part will not be a Capex item but be charged as Opex back to the mobile operator. From a European mobile radio access network Capex perspective, the average cost of a total site solution, with active as well as passive infrastructure, should have been reduced by ca. 100 thousand plus Euro, which may translate into a monthly Opex charge of 800 to 1300 Euro per site solution. It should be noted that while many operators have spun off their passive site solutions to third parties and thus effectively reduced their site-related Capex, the cost of antennas has increased dramatically as operators have moved away from classical simple SiSo (Single-in Singe-out) passive antennas to much more advanced antenna systems supporting multiple frequency bands, higher-order antennas (e.g., MiMo) and recently also started deploying active antennas (i.e., integrated amplifiers). This is largely also driven by mobile operators commissioning more and more frequency bands on their radio-access sites. The planning horizon needs at least to be 2 years and preferably 3 to 5 years.
  2. Capex investments that accommodate anticipated radio access growth and increased quality requirements. It is normal to be between 18 – 24 months ahead of the present capacity demand overall, accepting no more than 2% to 5% of cells (in BH) to breach a critical specification limit. Several such critical limits would be used for longer-term planning and operational day-to-day monitoring.
  3. Life-cycle management (business-as-usual) investments such as software annual fees, including licenses that are typically structured around the technologies deployed (e.g., 2G, 3G, 4G, and 5G) and active infrastructure modernization replacing radio access equipment (e.g., baseband units, radio units, antennas, …) that have become obsolete. Site reworks or construction optimization would typically be executed (on request from the operator) by the Towerco entity, where the mobile operator leases the passive site infrastructure. Thus, in such instances may not be a Capex item but charged back as an Operational expense to the telco.
  4. Even if there have been fewer regulatory discussions and political pressure for telcos to phase out radio access, Chinese supplier replacement should be considered. Nevertheless, with the current geopolitical climate (and the upcoming US election), telcos need to consider this topic very carefully; despite economic (less competition, higher cost), quality, and possible innovation, consequences may result in a departure from such suppliers. It would be a natural consideration in case of modernization needs. An accelerated phase-out may be justified to remove future risks arising from geopolitical pressures, although it would result in above-and-beyond capital commitment over a shorter period than otherwise would be the case. Telco valuation may suffer more in the short to medium term than otherwise would have been the case with a more natural phaseout due to obsolescence.

Mobile Access Capex KPIs: Capex share of Total, Access Utilization (reported/planned data traffic demand to the data traffic that could be supplied if all or part of the spectrum was activated), Capex per Site location, Capex per Incremental data traffic demand (in Gigabyte and Gigabit per second which is the real investment driver), Capex per Total Traffic (in Gigabyte and Gigabit per second), Capex per Mobile Customer and Capex to Mobile Revenue (preferably service revenue but the total is fine if the other is not available). As a rule of thumb, 50% of a mobile network typically covers rural areas, which also may carry less than 20% of the total data traffic.

Whether actual and planned Capex is available or an analyst is modeling it, the above KPIs should be followed over an extended period. A single year does not tell much of a story.

Capex modeling comment: When modeling the Capex required for the radio access network, you need to have an idea about how many sites your target telco has. There are many ways to get to that number. In most European countries, it is a matter of public record. Most telcos, nowadays, rarely build their own passive site infrastructure but get that from independent third-party tower companies (e.g., CellNex w. ca. 75k locations, Vantage Towers w. ca. 82k locations, … ) or site-share on another operators site locations if available. So, modeling the RAN Capex is a matter of having a benchmark of the active equipment, knowing what active equipment is most likely to be deployed and how much. I see this as being an iterative modeling process. Given the number of sites and historical Capex, it is possible to come to a reasonable estimate of both volumes of sites being changed and the range of unit Capex (given good guestimates of active equipment pricing range). Of course, in case you are doing a Capex review, the data should be available to you, and the exercise should be straightforward. The mobile Capex KPIs above will allow for consistency checks of a modeling exercise or guide a Capex review process.

I recommend using the classical topology described above when building a radio access model. That is unless you have information that the telco under analysis is transforming to a disaggregated topology with both fronthaul and backhaul. Remember you are not only required to capture the Capex for what is associated with the site location but also what is spent on the access transport. Otherwise, there is a chance that you over-estimate the unit-Capex for the site-related investments.

It is also worth keeping in mind that typically, the first place a telecom company would cut Capex (or down-prioritize) is pressured during the planning process would be in the radio access network category. The reason is that the site-related unitary capex tends to be incredibly well-defined. If you reduce your rollout to 100 site-related units, you should have a very well-defined quantum of Capex that can be allocated to another category. Also, the operational impact of cutting in this category tends to be very well-defined. Depending on how well planned the overall Capex has been done, there typically would be a slack of 5% to 10% overall that could be re-assigned or ultimately reduced if financial results warrant such a move.

Fixed Access Capex.

As mobile access, fixed access is about getting your service out to your customers. Or, if you are a wholesale provider, you can provide the means of your wholesale customer reaching their customer by providing your own fixed access transport infrastructure. Fixed access is about connecting the home, the office, the public institution (e.g., school), or whatever type of dwelling in general.

Figure 18 illustrates a fixed access network and its position in the overall telco architecture. The following make up the ODN (Optical Distribution Network); OLT: Optical Line Termination, ODF: Optical Distribution Frame, POS: Passive Optical Splitter, ONT: Optical Network Termination. At the customer premise, besides the ONT, we have the CPE: Customer Premise Equipment and the STB: Set-Top Box. Suppose you are an operator that bought wholesale fixed access from another telco’ (incl. Open Access Providers, OAPs). In that case, you may require a BNG to establish the connection with your customer’s CPE and STB through the wholesale access network.

As fiber optical access networks are being deployed across Europe, this tends to be a substantial Capex item on the budgets of telcos. Here we have two main Capex drivers. First is the Capex for deploying fibers across urban areas, which provides coverage for households (or dwellings) and is measured as Capex-per-homes passed. Second is the Capex required for establishing the connection to households (or dwellings). The method of fiber deployment is either buried, possibly using existing ducts or underground passageways, or via aerial deployment using established poles (e.g., power poles or street furniture poles) or new poles deployed with the fiber deployment. Aerial deployment tends to incur lower Capex than buried fiber solutions due to requiring less civil work. The OLT, ODF, POS, and optical fiber planning, design, and build to provide home coverage depends on the home-passed deployment ambition. The fiber to connect a home (i.e., civil work and materials), ONT, CPE, and STBs are driven by homes connected (or FTTH connected). Typically, CPE and STBs are not included in the Access Capex but should be accounted for as a separate business-driven Capex item.

The network solutions (BNG, OLT, Routers, Switches, …) outside the customer’s dwelling come in the form of a cabinet and appropriate cards to populate the cabinet. The cards provide the capacity and serviced speed (e.g., 100 Mbps, 300 Mbps, 1 Gbps, 10 Gbps, …) sold to the fixed broadband customer. Moreover, for some of the deployed solutions, there is likely a mandatory software (incl. features) fee and possibly both optional and custom-specific features (although rare to see that in mainstream deployments). It should be clear (but you would be surprised) that ONT and CPE should support the provisioned speed of the fixed access network. The customer cannot get more quality than the minimum level of either the ONT, CPE, or what the ODN has been built to deliver. In other words, if the networking cards have been deployed only to support up to 1 Gbps and your ONT, and CPE may support 3 Gbps or more, your customer will not be able to have a service beyond 1 Gbps. Of course, the other way around as well. I cannot stress enough the importance of longer-term planning in this respect. Your network should be as flexible as possible in providing customer services. It may seem that Capex savings can be made by only deploying capacity sold today or may be required by business over the next 12 months. While taking a 3 to 5-year view on the deployed network capacity and ONT/CPEs provided to customers avoids having to rip out relatively new equipment or finance the significant replacement of obsolete customer premise equipment that no longer can support the services required.

When we look at the economic drivers for fixed access, we can look at the capital cost of deploying a kilometer of fiber. This is particularly interesting if we are only interested in the fiber deployment itself and nothing else. Depending on the type of clutter, deployment, and labor cost occur. Maybe it is more interesting to bundle your investment into what is required to pass a household and what is required to connect a household (after it has been passed). Thus, we look at the Capex-per-home (or dwellings) passed and separate the Capex to connect an individual customer’s premise. It is important to realize that these Capex drivers are not just a single value but will depend on the household density depends on the type of area the deployment happens. We generally expect dense urban clutters to have a high dwelling density; thus, more households are covered (or passed) per km of fiber deployed. Dense-urban areas, however, may not necessarily hold the highest density of potential residential customers and hold less retail interest in the retail business. Generally, urban areas have higher household densities (including residential households) than sub-urban clutter. Rural areas are expected to have the lowest density and, thus, the most costly (on a household basis) to deploy.

Figure 19, just below, illustrates the basic economics of buried (as opposed to aerial) fiber for FTTH homes passed and FTTH homes connected. Apart from showing the intuitive economic logic, the cost per home passed or connected is driven by the household density (note: it’s one driver and fairly important but does not capture all the factors). This may serve as a base for rough assessments of the cost of fiber deployment in homes passed and homes connected as a function of household density. I have used data in the Fiber-to-the-Home Council Europe report of July 2012 (10 years old), “The Cost of Meeting Europe’s Network Needs”, and have corrected for the European inflationary price increase since 2012 of ca. 14% and raised that to 20% to account for increased demand for FTTH related work by third parties. Then I checked this against some data points known to me (which do not coincide with the cities quoted in the chart). These data points relate to buried fiber, including the homes connected cost chart. Aerial fiber deployment (including home connected) would cost less than depicted here. Of course, some care should be taken in generalizing this to actual projects where proper knowledge of the local circumstances is preferred to the above.

Figure 19 The “chicken and egg” of connecting customers’ premises with fiber and providing them with 100s of Mbps up to Gbps broadband quality is that the fibers need to pass the home first before the home can be connected. The cost of passing a premise (i.e., the home passed) and connecting a premise (home connected) should, for planning purposes, be split up. The cost of rolling out fiber to get homes-passed coverage is not surprisingly particularly sensitive to household density. We will have more households per unit area in urban areas compared to rural areas. Connecting a home is more sensitive to household density in deep rural areas where the distance from the main fiber line connection point to the household may be longer. The above cost curves are for buried fiber lines and are in 2021 prices.

Aerial fiber deployment would generally be less capital-intensive due to faster and easier deployment (less civil work, including permitting) using pre-existing (or newly built) poles. Not every country allows aerial deployment or even has the infrastructure (i.e., poles) available, which may be medium and low-voltage poles (e.g., for last-mile access). Some countries will have a policy allowing only buried fibers in the city or metropolitan areas and supporting pole infrastructure for aerial deployment in sub-urban and rural clutters. I have tried to illustrate this with Figure 18 below, where the pie charts show the aerial potential and share that may have to be assigned to buried fiber deployment.

Figure 20 above illustrates the amount of fiber coverage (i.e., in terms of homes passed) in Western European markets. The number for 2015 and 2021 is based on European Commission’s “Broadband Coverage in Europe 2021” (authored by Omdia et al.). The 2025 & 2031 coverage numbers are my extrapolation of the 5-year trend leading up to 2021, considering the potential for aerial versus buried deployment. Aerial making accelerated deployment gains is more likely than in markets that only have buried fiber as a possibility, either because of regulation or lack of appropriate infrastructure for aerials. The only country that may be below 50% FTTH coverage in 2025 is Germany (i.e., DE), with a projected 39% of homes passed by 2025. Should Germany aim for 50% instead, they would have to do ca. 15 million households passed or, on average, 3 million a year from 2021 to 2025. Maximum Germany achieved in one year was in 2020, with ca. 1.4 million homes passed (i.e., Covid was good for getting “things done”). In 2021 this number dropped to ca. 700 thousand or half of the 2020 number. The maximum any country in Europe has done in one year was France, with 2.9 million homes passed in 2018. However, France does allow for aerial fiber deployment outside major metropolitan areas.

Figure 21 above provides an overview across Western Europe for the last 5 years (2016 – 2021) of average annual household fiber deployment, the maximum done in one year in the previous 5 years, and the average required to achieve household coverage in 2026 shown above in Figure 20. For Germany (DE), the average deployment pace of 3.23 homes passed per year (orange bar) would then result in a coverage estimate of 25%. I don’t see any practical reasons for the UK, France, and Italy not to make the estimated household coverage by 2026, which may exceed my estimates.

From a deployment pace and Capex perspective, it is good to keep in mind that as time goes by, the deployment cost per household is likely to increase as household density reduces when the deployment moves from metropolitan areas toward suburban and rural. Thus, even if the deployment pace may reduce naturally for many countries in Figure 20 towards 2025, absolute Capex may not necessarily reduce accordingly.

In summary, the following topics would likely be on the Capex priority list;

  1. Continued fiber deployment to achieve household coverage. Based on Figure 17, at household (HH) densities above 500 per km2, the unit Capex for buried fiber should be below 900 Euro per HH passed with an average of 600 Euro per HH passed. Below 500 HH per km2, the cost increases rapidly towards 3,000 Euro per HH passed. The aerial deployment will result in substantially lower Capex, maybe with as much as 50% lower unit Capex.
  2. As customers subscribe, the fiber access cost associated with connecting homes (last-mile connectivity) will need to be considered. Figure 17 provides some guidance regarding the quantum-Euro range expected for buried fiber. Aerial-based connections may be somewhat cheaper.
  3. Life-cycle management (business-as-usual) investments, modernization investments, accommodating growth including new service and quality requirements (annual business as usual). Typically it would be upgrading OLT, ONTs, routers, and switches to support higher bandwidth requirements upgrading line cards (or interface cards), and moving from ≤100 Mbps to 1 Gbps and 10 Gbps. Many telcos will be considering upgrading their GPON (Gigabit Passive Optical Networks, 2.5 Gbps↓ / 1.2 Gbps↑) to provide XGPON (10 Gbps↓ / 2.5 Gbps↑) or even XGSPON services (10 Gbps↓ / 10 Gbps↑).
  4. Chinese supplier exposure and risks (i.e., political and regulatory enforcement) may be an issue in some Western European markets and require accelerated phase-out capital needs. In general, I don’t see fixed access infrastructure being a priority in this respect, given the strong focus on increasing household fiber coverage, which already takes up a lot of human and financial resources. However, this topic needs to be considered in case of obsolescence and thus would be a business case and performance-driven with a risk adjustment in dealing with Chinese suppliers at that point in time.

Fixed Access Capex KPIs: Capex share of Total, Capex per km, Number of HH passed and connected, Capex per HH passed, Capex per HH connected, Capex to Incremental Traffic, GPON, XGPON and XGSPON share of Capex and Households connected.

Whether actual and planned Capex is available or an analyst is modeling it, the above KPIs should be followed over an extended period. A single year does not tell much of a story.

Capex modeling comment: In a modeling exercise, I would use estimates for the telco’s household coverage plans as well as the expected household-connected sales projections. Hopefully, historical numbers would be available to the analyst that can be used to estimate the unit-Capex for a household passed and a household connected. You need to have an idea of where the telco is in terms of household density, and thus as time goes by, you may assume that the cost of deployment per household increases somewhat. For example, use Figure 18 to guide the scaling curve you need. The above-fixed access Capex KPIs should allow checking for inconsistencies in your model or, if you are reviewing a Capex plan, whether that Capex plan is self-consistent with the data provided.

If anyone would have doubted it, there is still much to do with fiber optical deployment in Western Europe. We still have around 100+ million homes to pass and a likely capital investment need of 100+ billion euros. Fiber deployment will remain a tremendously important investment area for the foreseeable future.

Figure 22 shows the remaining fiber coverage in homes passed based on 2021 actuals for urban and rural areas. In general, it is expected that once urban areas’ coverage has reached 80% to 90%, the further coverage-based rollout will reduce. Though, for attractive urban areas, overbuilt, that is, deploying fiber where there already are fibers deployed, is likely to continue.

Figure 23 The top illustrates the next 5 years’ weekly rollout to reach an 80% to 90% household coverage range by 2025. The bottom, it shows an estimate of the remaining capital investment required to reach that 80% to 90% coverage range. This assessment is based on 2021 actuals from the European Commission’s “Broadband Coverage in Europe 2021” (authored by Omdia et al.); the weekly activity and Capex levels are thus from 2022 onwards.

In many Western European countries, the pace is expected to be increased considerably compared to the previous 5 years (i.e., 2016 – 2021). Even if the above figure may be over-optimistic, with respect to the goal of 2026, the European ambition for fiberizing European markets will impose a lot of pressure on speedy deployment.

IT investment levels are typically between 15% and 25% of Telecom Capex.

IT may be the most complex area to reach a consensus on concerning Capex. In my experience, it is also the area within a telco with the highest and most emotional discussion overhead within the operations and at a Board level. Just like everyone is far better at driving a car than the average driver, everyone is far better at IT than the IT experts and knows exactly what is wrong with IT and how to make IT much better and much faster, and much cheaper (if there ever was an area in telco-land where there are too many cooks).

Why is that the case? I tend to say that IT is much more “touchy-feely” than networks where most of the Capex can be estimated almost mathematically (and sufficiently complicated for non-technology folks to not bother with it too much … btw I tend to disagree with this from a system or architecture perspective). Of course, that is also not the whole truth.

IT designs, plans, develops (or builds), and operates all the business support systems that enable the business to sell to its customers, support its customers, and in general, keep the relationship with the customer throughout the customer life-cycle across all the products and services offered by the business irrespective of it being fixed or mobile or converged. IT has much more intense interactions with the business than any other technology department, whose purpose is to support the business in enabling its requirements.

Most of the IT Capex is related to people’s work, such as development, maintenance, and operations. Thus capitalized labor of external and internal labor is the main driver for IT Capex. The work relates to maintaining and improving existing services and products and developing new ones on the IT system landscape or IT stacks. In 2021, Western European telco Capex spending was about 20% of their total revenue. Out of that, 4±1 % or in the order of 10±3 billion Euro is spent on IT. With ca. 714 million fixed and mobile subscribers, this corresponds to an IT average spend of 14 Euros per telco customer in 2021. Best investment practices should aim at an IT Capex spend at or below 3% of revenue on average over 5 years (to avoid penalizing IT transformation programs). As a rule of thumb, if you do not have any details of internal cost structure (I bet you usually would not have that information), assume that the IT-related Opex has a similar quantum as Capex (you may compensate for GDP differences between markets). Thus, the total IT spend (Capex and Opex) would be in the order of 2×Capex, so the IT Spend to Revenue double the IT-related Capex to Revenue. While these considerations would give you an idea of the IT investment level and drill down a bit further into cost structure details, it is wise to keep in mind that it’s all a macro average, and the spread can be pretty significant. For example, two telcos with roughly the same number of customers, IT landscape, and complexity and have pretty different revenue levels (e.g., due to differences in ARPU that can be achieved in the particular market) may have comparable absolute IT spending levels but very different relative levels compared to the revenue. I also know of telcos with very low total IT spend to Revenue ITR (shareholder imposed), which had (and have) a horrid IT infrastructure performance with very extended outages (days) on billing and frequent instabilities all over its IT systems. Whatever might have been saved by imposing a dramatic reduction in the IT Capex (e.g., remember 10 million euros Capex reduction equivalent to 200 million euros value enhancement) was more than lost on inferior customer service and experience (including the inability to bill the customers).

You will find industry experts and pundits that expertly insist that your IT development spend is way too high or too low (although the latter is rare!). I recommend respectfully taking such banter seriously. Although try to understand what they are comparing with, what KPIs they are using, and whether it’s apples for apples and not with pineapples. In my experience, I would expect a mobile-only business to have a better IT spend level than a fixed-mobile telco, as a mobile IT landscape tends to be more modern and relatively simple compared to a fixed IT landscape. First, we often find more legacy (and I mean with a capital L) in the fixed IT landscape with much older services and products still being kept operational. The fixed IT landscape is highly customized, making transformation and modernization complex and costly. At least if old and older legacy products must remain operational. Another false friend in comparing one company IT spending with another’s is that the cost structure may be different. For example, it is worth understanding where OSS (Operational Support System) development is accounted for. Is it in the IT spend, or is it in the Network-side of things? Service platforms and Data Centers may be another difference where such spending may be with IT or Networks.

Figure 24 shows the helicopter view of a traditional telco IT architectural stack. Unless the telco is a true greenfield, it is a very normal state of affairs to have multiple co-existing stacks, which may have some degree of integration at various levels (sub-layers). Most fixed-mobile telcos remain with a high degree of IT architecture separation between their mobile and fixed business on a retail and B2B level. When approaching IT, investments never consider just one year. Understand their IT investment strategy in the immediate past (2-3 years prior) as well as how that fits with known and immediate future investments (2 – 3 years out).

Above, Figure 24 illustrates the typical layers and sub-layers in an IT stack. Every sub-layer may contain different applications, functionalities, and systems, all with an over-arching property of the sub-layer description. It is not uncommon for a telco to have multiple IT stacks serving different brands (e.g., value, premium, …) and products (e.g., mobile, fixed, converged) and business lines (e.g., consumer/retail, business-to-business, wholesale, …). Some layers may be consolidated across stacks, and others may be more fragmented. The most common division is between fixed and mobile product categories, as historically, the IT business support systems (BSS) as well as the operational support systems (OSS) were segregated and might even have been managed by two different IT departments (that kind of silliness is more historical albeit recent).

Figure 25 shows a typical fixed-mobile incumbent (i.e., anything not greenfield) multi-stack IT architecture and their most likely aspiration of aggressive integrated stack supporting a fixed-mobile conversion business. Out of experience, I am not a big fan of retail & B2B IT stack integration. It creates a lot of operational complexity and muddies the investment transparency and economics of particular B2B at the expense of the retail business.

A typical IT landscape supporting fixed and mobile services may have quite a few IT stacks and a wide range of solutions for various products and services. It is not uncommon that a Fixed-Mobile telco would have several mobile brands (e.g., premium, value, …) and a separate (from an IT architecture perspective, at least) fixed brand. Then in addition, there may be differences between the retail (business-to-consumer, B2C) and the business-to-business (B2B) side of the telco, also being supported by separate stacks or different partitions of a stack. This is illustrated in Figure 24 above. In order for the telco business to become more efficient with respect to its IT landscape, including development, maintenance, and operational aspects of managing a complex IT infrastructure landscape, it should strive to consolidate stacks where it makes sense and not un-importantly along the business wish of convergence at least between fixed and mobile.

Figure 24 above illustrates an example of an IT stack harmonization activity long retail brands as well as Fixed and Mobile products as well as a separation of stacks into a retail and a business-to-business stack. It is, of course, possible to leverage some of the business logic and product synergies between B2C and B2B by harmonizing IT stacks across both business domains. However, in my experience, nothing great comes out of that, and more likely than not, you will penalize B2C by spending above and beyond value & investment attention on B2B. The B2B requirements tend to be significantly more complex to implement, their specifications change frequently (in line with their business customers’ demand), and the unit cost of development returns less unit revenue than the consumer part. Economically and from a value-consideration perspective, the telco needs to find an IT stack solution that is more in line with what B2B contributes to the valuation and fits its requirements. That may be a big challenge, particularly for minor players, as its business rarely justifies a standalone IT stack or developments. At least not a stack that is developed and maintained at the same high-quality level as a consumer stack. There is simply a mismatch in the B2B requirements, often having much higher quality and functionality requirements than the consumer part, and what it contributes to the business compared to, for example, B2C.

When I judge IT Capex, I care less about the absolute level of spend (within reason, of course) than what is practical to support within the given IT landscape the organization has been dealt with and, of course, the organization itself, including 3rd party support. Most systems will have development constraints and a natural order of how development can be executed. It will not matter how much money you are given or how many resources you throw at some problems; there will be an optimum amount of resources and time required to complete a task. This naturally leads to prioritization which may lead to disappointment of some stakeholders and projects that may not be prioritized to the degree they might feel entitled to.

When looking at IT capital spending and comparing one telco with another, it is worthwhile to take a 3- to 5-year time horizon, as telcos may be in different business and transformation cycles. A one-year comparison or benchmark may not be appropriate for understanding a given IT-spend journey and its operational and strategic rationale. Search for incidents (frequency and severity) that may indicate inappropriate spend prioritization or overall too little available IT budget.

The IT Capex budget would typically be split into (a) Consumer or retail part (i.e., B2C), (b) Business to Business and wholesale part, (c) IT technical part (optimization, modernization, cloudification, and transformations in general), and a (d) General and Administrative (G&A) part (e.g., Finance, HR, ..). Many IT-related projects, particularly of transformative nature, will run over multiple years (although if much more than 24 months, the risk of failure and monetary waste increases rapidly) and should be planned accordingly. For the business-driven demand (from the consumer, business, and wholesale), it makes sense to assign Capex proportional to the segment’s revenue and the customers those segments support and leverage any synergies in the development work required by the business units. For IT, capital spending should be assigned, ensuring that technical debt is manageable across the IT infrastructure and landscape and that efficiency gains arising from transformative projects (including landscape modernization) are delivered timely. In general, such IT projects promise efficiency in terms of more agile development possibilities (faster time to market), lower development and operational costs, and, last but not least, improved quality in terms of stability and reduced incidents. The G&A prioritizes finance projects and then HR and other corporate projects.

In summary, the following topics would likely be on the Capex priority list;

  1. Provide IT development support for business demand in the next business plan cycle (3 – 5 years with a strong emphasis on the year ahead). The allocation key should be close to the Revenue (or Ebitda) and customer contribution expected within the budget planning period. The development focus is on maintenance, (incremental) improvements to existing products/services, and new products/services required to make the business plans. In my experience, the initial demand tends to be 2 to 3 times higher than what a reasonable financial envelope would dictate (i.e., even considering what is possible to do within the natural limitations of the given IT landscape and organization) and what is ultimately agreed upon.
  2. Cloudification transformation journey moving away from the traditional monolithic IT platform and into a public, hybrid, or private cloud environment. In my opinion, the safest approach is a “lift-and-shift” approach where existing functionality is developed in the cloud environment. After a successful migration from the traditional monolithic platform into the cloud environment, the next phase of the cloudification journey will be to move to a cloud-native framework should be embarked. This provides a very solid automation framework delivering additional efficiencies and improved stability and quality (e.g., reduction in incidents). Analysts should be aware that migrating to a (public) cloud environment may reduce the capitalization possibilities with the consequence that Capex may reduce in the forward budget planning, but this would be at the expense of increased Opex for the IT organization.
  3. Stack consolidation. Reducing the number of IT stacks generally lowers the IT Capex demand and improves development efficiency, stability, and quality. The trend is to focus on the harmonization efforts on the frontend (Portals and Outlets layer in Figure 14), the CRM layer (retiring legacy or older CRM solutions), and moving down the layers of the IT stack (see Figure 14) often touching the complex backend systems when they become obsolete providing an opportunity to migrate to a modern cloud-based solution (e.g., cloud billing).
  4. Modernization activities are not covered by cloudification investments or business requirements.
  5. Development support for Finance (e.g., ERP/SAP requirements), HR requirements, and other miscellaneous activities not captured above.
  6. Chinese suppliers are rarely an issue in Western European telecom’s IT landscape. However, if present in a telco’s IT environment, I would expect Capex has been allocated for phasing out that supplier urgently over the next 24 months (pending the complexity of such a transformation/migration program) due to strong political and regulatory pressures. Such an initiative may have a value-destructing impact as business-driven IT development (related to the specific system) might not be prioritized too highly during such a program and thus result in less ability to compete for the telco during a phase-out program.

IT Capex KPIs: IT share of Total Capex (if available, broken down into a Fixed and Mobile part), IT Capex to Revenue, ITR (IT total spend to Revenue), IT Capex per Customer, IT Capex per Employee, IT FTEs to Total FTEs.

Moreover, if available or being modeled, I would like to have an idea about how much of the IT Capex goes to investment categories such as (i) Maintain, (ii) Growth, and (iii) Transform. I will get worried if the majority of IT Capex over an extended period goes to the Growth category and little to Maintain and Transform. This indicates a telco that has deprioritized quality and ignores efficiency, resulting in the risk of value destruction over time (if such a trend were sustained). A telco with little Transform spend (again over an extended period) is a business that does not modernize (another word for sweating assets).

Capex modeling comment: when I am modeling IT and have little information available, I would first assume an IT Capex to Revenue ratio around 4% (mobile-only) to 6% (fixed-mobile operation) and check as I develop the other telco Capex components whether the IT Capex stays within 15% to 25%. Of course, keep an eye out for all the above IT Capex KPIs, as they provide a more holistic picture of how much confidence you can have in the Capex model.

Figure 26 illustrates the anticipated IT Capex to Revenue ranges for 2024: using New Street Research (total) Capex data for Western Europe, the author’s own Capex projection modeling, and using the heuristics that IT spend typically would be 15% to 25% of the total Capex, we can estimate the most likely ranges of IT Capex to Revenue for the telecommunications business covered by NSR for 2024. For individual operations, we may also want to look at the time series of IT spending to revenue and compare that to any available intelligence (e.g., transformation intensive, M&A integration, business-as-usual, etc..)

Using the heuristic of the IT Capex being between 15% (1st quantile) and 25% (3rd quantile) of the total Capex, we can get an impression of how much individual Telcos invest in IT annually. The above chart shows such an estimate for 2024. I have the historical IT spending levels for several Western European Telcos, which agree well with the above and would typically be a bit below the median unless a Telco is in the progress of a major IT transformation (e.g., after a merger, structural separation, Huawei forced replacement, etc..). One would also expect and should check that the total IT spend, Capex and Opex, are decreasing over time when the transformational IT spend has been removed. If this is observed, it would indicate that Telco does become increasingly more efficient in its IT operation. Usually, the biggest effect should be in IT Opex reduction over time.

Figure 27 illustrates the anticipated IT Capex to Customer ranges for 2024: having estimated the likely IT spend ranges (in Figure 26) for various Western European telcos, allows us to estimate the expected 2024 IT spend per customer (using New Street Research data, author’s own Capex projection model and the IT heuristics describe in the section). In general and in the absence of structural IT transformation programs, I would expect the IT per customer spend to be below the median. Some notes to the above results: TDC (Nuuday & TDC Net) has major IT transformation programs ongoing after the structural separation, KPN is in progress with replacing their Huawei BSS, and I would expect them to be at the upper part of IT spending, Telenor Norway seems higher than I would expect but is an incumbent that traditionally spends substantially more than its competitors so might be okay but caution should be taken here, Switzerland in general and Swisscom, in particular, is higher than I would have expected. This said, it is a sophisticated Telco services market that would be likely to spend above the European average, irrespective I would take some caution with the above representation for Switzerland & Swisscom.

Similar to the IT Capex to Revenue, we can get an impression of what Telcos spend on IT Capex as it relates to their total mobile and fixed customer base. Again for Telcos in Western Europe (as well as outside), these ranges shown above do seem reasonable as the estimated range of where one would expect the IT spend. The analyst is always encouraged to look at this over a 3- to 5-year period to better appreciate the trend and should keep in mind that not all Telcos are in synch with their IT investments (as hopefully is obvious as transformation strategies and business cycles may be very different even within the same market).

Other, or miscellaneous, investments tend to be between 3% and 8% of the Telecom Capex.

When modeling a telco’s Capex, I find it very helpful to keep an “Other” or “Miscellaneous” Capex category for anything non-technology related. Modeling-wise, having a placeholder for items you don’t know about or may have forgotten is convenient. I typically start my models with 15% of all Capex. As my model matures, I should be able to reduce this to below 10% and preferably down to 5% (but I will accept 8% as a kind of good enough limit). I have had Capx review assignments where the Capex for future years had close to 20% in the “Miscellaneous.” If this “unspecified” Capex would not be included, the Capex to Revenue in the later years would drop substantially to a level that might not be deemed credible. In my experience, every planned Capex category will have a bit of “Other”-ness included as many smaller things require Capex but are difficult to mathematically derive a measure for. I tend to leave it if it is below 5% of a given Capex category. However, if it is substantial (>5%), it may reveal “sandbagging” or simply less maturity in the Capex planning and budget process.

Apart from a placeholder for stuff we don’t know, you will typically find Capex for shop refurbishment or modernization here, including office improvements and IT investments.

DE-AVERAGING THE TELECOM CAPEX TO FIXED AND MOBILE CONTRIBUTIONS.

There are similar heuristics to go deeper down into where the Capex should be spent, but that is a detail for another time.

Our first step is decomposing the total Capex into a fixed and a mobile component. We find that a multi-linear model including Total Capex, Mobile Customers, Mobile Service Revenue, Fixed Customers, and Fixed Service Revenues can account for 93% of the Capex trend. The multi-linear regression formula looks like the following;

C_{total} \; = \; C_{mobile} \; + \; C_{fixed}

\; = \; \alpha_{customers}^{mobile} \; N_{customers}^{mobile} \; + \; \alpha_{revenue}^{mobile} \; R_{revenue}^{mobile}

\; +  \;  \beta_{customers}^{fixed} \; N_{customers}^{fixed} \; + \; \beta_{revenue}^{fixed} \; R_{revenue}^{fixed}

with C = Capex, N = total customer count, R = service revenue, and α and β are the regression coefficient estimates from the multi-linear regression. The Capex model has been trained on 80% of the data (1,008 data points) chosen randomly and validated on the remainder (252 data points). All regression coefficients (4 in total) are statistically significant, with p-values well below a 95% confidence level.

Figure 28 above shows the Predicted Capex versus the Actual Capex. It illustrates that the predicted model agreed reasonably well with the actual Capex, which would also be expected based on the statistical KPIs resulting from the fit.

The Total is (obviously) available to us and therefore allows us to estimate both fixed and mobile Capex levels, by

C_{fixed} \; = \;  \beta_{customers}^{fixed} \; N_{customers}^{fixed} \; + \; \beta_{revenue}^{fixed} \; R_{revenue}^{fixed}

C_{mobile} \; = \; C_{total} \; - \; C_{fixed}

The result of the fixed-mobile Capex decomposition is shown in Figure 26 below. Apart from being (reasonably) statistically sound, it is comforting that the trend in Capex for fixed and mobile seem to agree with what our intuition should be. The increase in mobile Capex (for Western Europe) over the last 5 years appears reasonable, given that 5G deployment commenced in early 2019. During the Covid lockdown from early 2020, fixed revenue was boosted by a massive shift in fixed broadband traffic (and voice) from the office to the individuals’ homes. Likewise, mobile service revenues have been in slow decline for years. Thus, the Capex increase due to 5G and reduced mobile service revenues ultimately leads to a relatively more significant increase in the mobile Capex to Revenue ratio.

Figure 29 illustrates the statistical modeling (by multi-linear regression), or decomposition, of the Total Capex as a function of Mobile Customers, Mobile Service Revenues, Fixed Customers, and Fixed Service Revenues, allowing to break up of the Capex into Fixed and Mobile components by decomposing the total Capex. The absolute Capex level is higher for fixed than what is found for mobile, with about a factor of 2 until 2021, when mobile Capex increases due to 5G investments in the mobile industry. It is found that the Mobile Capex has increased the most over the last 5 years (e.g., 5G deployment) while the service revenues have declined somewhat over the same period. This increased the Mobile Capex to Service Revenue ratio (note: based on Total Revenue, the ratio would be somewhat smaller, by ca. 17%). Source: Total Capex, Fixed, and Mobile Service revenues from New Street Research data for Western Europe. Note: The decomposition of the total Capex into Fixed and Mobile Capex is based on the author’s own statistical analysis and modeling. It is not a delivery of the New Street Research report.

CAN MOBILE-TRAFFIC GROWTH CONTINUE TO BE ACCOMMODATED CAPEX-WISE?

In my opinion, there has been much panic in our industry in the past about exhausting the cellular capacity of mobile networks and the imminent doom of our industry. A fear fueled by the exponential growth of user demand perceived inadequate spectrum amount and low spectral efficiency of the deployed cellular technologies, e.g., 3G-HSPA, classical passive single-in single-out antennas. Going back to the “hey-days” of 3G-HSPA, there was a fear that if cellular demand kept its growth rate, it would result in supply requirements going towards infinity and the required Capex likewise. So clearly an unsustainable business model for the mobile industry. Today, there is (in my opinion) no basis for such fears short or medium-term. With the increased fiberization of our society, where most homes will be connected to fiber within the next 5 – 10 years, cellular doomsday, in the sense of running out of capacity or needing infinite levels of Capex to sustain cellular demand, maybe a day never to come.

In Western Europe, the total mobile subscriber penetration was ca. 130% of the total population in 2021, with an excess of approximately 2.1+ mobile devices per subscriber. Mobile internet penetration was 76% of the total population in 2021 and is expected to reach 83% by 2025. In 2021, Europe’s average smartphone penetration rate was 77.6%, and it is projected to be around 84% by 2025. Also, by 2024±1, 50% of all connections in Western Europe are projected to be 5G connections. There are some expectations that around 2030, 6G might start being introduced in Western European markets. 2G and 3G will be increasingly phased out of the Western European mobile networks, and the spectrum will be repurposed for 4G and eventually 5G.

The above Figure 30 shows forecasted mobile users by their main mobile access technology. Source: based on the author’s forecast model relying on past technology diffusion trends for Western Europe and benchmarked against some WEU markets and other telco projections. See also 5G Standalone – European Demand & Expectations by Kim Larsen.

We may not see a complete phase-out of either older Gs, as observed in Figure 19. Due to a relatively large base of non-VOLTE (Voice-over-LTE) devices, mobile networks will have to support voice circuit-switched fallback to 2G or 3G. Furthermore, for the foreseeable future, it would be unlikely that all visiting roaming customers would have VOLTE-based devices. Furthermore, there might be legacy machine-2-machine businesses that would be prohibitively costly and complex to migrate from existing 2G or 3G networks to either LTE or 5G. All in all, ensure that 2G and 3G may remain with us for reasonably long.

Figure 31 above shows that mobile and fixed data traffic consumption is growing in totality and per-user level. On average mobile traffic grew faster than fixed from 2015 to 2021. A trend that is expected to continue with the introduction of 5G. Although the total traffic growth rate is slowing down somewhat over the period, on a per-user basis (mobile as well as fixed), the consumptive growth rate has remained stable.

Since the early days of 3G-HSPA (High-Speed Packet Access) radio access, investors and telco businesses have been worried that there would be an end to how much demand could be supported in our cellular networks. The “fear” is often triggered by seeing the exponential growth trend of total traffic or of the usage per customer (to be honest, that fear has not been made smaller by technology folks “panicking” as well).

Let us look at the numbers for 2021 as they are reported in the Cisco VNI report. The total mobile data traffic was in the order of 4 Exabytes (4 Billion gigabytes, GB), more than 5.5× the level of 2016. It is more than 600 million times the average mobile data consumption of 6.5 GB per month per customer (in 2021). Compare this with the Western European population of ca. 200 million. While big numbers, the 6.5 GB per month per customer is insignificant. Assuming that most of this volume comes from video streaming at an optimum speed of 3 – 5 Mbps (good enough for HD video stream), the 6.5 GB translates into approx. 3 – 5 hours of video streaming over a month.

The above Figure 32 Illustrates a 24-hour workday total data demand on the mobile network infrastructure. A weekend profile would be more flattish. We spend at least 12 hours in our home, ca. 7 hours at work (including school), and a maximum of 5 hours (~20%) commuting, shopping, and otherwise being away from our home or workplace. Previous studies of mobile traffic load have shown that 80% of a consumer’s mobile demand falls in 3 main radio node sites around the home and workplace. The remaining 20% tends to be much more mobile-like in the sense of being spread out over many different radio-node sites.

Daily we have an average of ca. 215 Megabytes per day (if spread equally over the month), corresponding to 6 – 10 minutes of video streaming. The average length of a YouTube was ca. 4.4 minutes. In Western Europe, consumers spend an average of 2.4 hours per day on the internet with their smartphones (having younger children, I am surprised it is not more than that). However, these 2.4 hours are not necessarily network-active in the sense of continuously demanding network resources. In fact, most consumers will be active somewhere between 8:00 to around 22:00, after which network demand reduces sharply. Thus, we have 14 hours of user busy time, and within this time, a Western European consumer would spend 2.4 hours cumulated over the day (or ca. 17% of the active time).

Figure 33 above illustrates (based on actual observed trends) how 5 million mobile users distribute across a mobile network of 5,000 sites (or radio nodes) and 15,000 sectors (typically 3 sectors = 1 site). Typically, user and traffic distributions tend to be log-norm-like with long tails. In the example above, we have in the busy hour a median value of ca. 80 users attached to a sector, with 15 being active (i.e., loading the network) in the busy hour, demanding a maximum of ca. 5 GB (per sector) or an average of ca. 330 MB per active user in the radio sector over that sector’s relevant busy hour.

Typically, 2 limits, with a high degree of inter-dependency, would allegedly hit the cellular businesses rendering profitable growth difficult at some point in the future. The first limit is a practical technology limit on how much capacity a radio access system can supply. As we will see a bit later, this will depend on the operator’s frequency spectrum position (deployed, not what might be on the shelf), the number of sites (site density), the installed antenna technology, and its effective spectral efficiency. The second (inter-dependent) limit is an economic limit. The incremental Capex that telcos would need to commit to sustaining the demand at a given quality level would become highly unprofitable, rendering further cellular business uneconomical.

From a Capex perspective, the cellular access part drives a considerable amount of the mobile investment demand. Together with the supporting transport, such as fronthaul, backhaul, aggregation, and core transport, the capital investment share is typically 50% or higher. This is without including the spectrum frequencies required to offer the cellular service. Such are usually acquired by local frequency spectrum auctions and amount to substantial investment levels.

In the following, the focus will be on cellular access.

The Cellular Demand.

Before discussing the cellular supply side of things, let us first explore the demand side from the view of a helicopter. Demand is created by users (N) of the cellular services offered by telcos. Users can be human or non-human such as things in general or more specific machines. Each user has a particular demand that, in an aggregated way, can be represented by the average demand in Bytes per User (d). Thus, we can then identify two growth drivers. One from adding new users (ΔN) to our cellular network and another from the incremental change in demand per user (ΔN) as time goes by.

It should be noted that the incremental change in demand or users might not per se be a net increase. Still, it could also be a net decrease, either because the cellular networks have reached the maximum possible level of capacity (or quality) that results in users either reducing their demand or “ churning” from those networks or that an alternative to today’s commercial cellular network triggers abandonment as high-demand users migrate to that alternative — leading both to a reduction in cellular users and the average demand per user. For example, a near-100% Fiber-to-the-Home coverage with supporting WiFi could be a reason for users to abandon cellular networks, at least in an indoor environment, which would reduce between 60 to 80% of present-day cellular data demand. This last (hypothetical) is not an issue for today’s cellular networks and telco businesses.

N_{t+1} \; = \; N_t \; + \; \Delta N_{t+1}

d_{t+1} \; = \; d_t \; + \; \Delta d_{t+1}

D_{t+1}^{total} \; = \; N_{t+1} \times d_{t+1}

Of course, this can easily be broken down into many more drivers and details, e.g., technology diffusion or adaptation, the rate of users moving from one access technology to another (e.g., 3G→4G, 4G→5G, 5G→FTTH+WiFi), improved network & user device capabilities (better coverage, higher speeds, lower latency, bigger display size, device chip generation), new cellular service adaptation (e.g., TV streaming, VR, AR, …), etc.…

However, what is often forgotten is that the data volume of consumptive demand (in Byte) is not the main direct driver for network demand and, thus, not for the required investment level. A gross volumetric demand can be caused by various gross throughput demands (bits per second). The throughput demanded in the busiest hour (T_{demand} or T_{BH}) is the direct driver of network load, and thus, network investments, the volumetric demand, is a manifestation of that throughput demand.

T_{demand} \; = \; T_{BH \; in \; bits/sec} \; max_t \sum_{cell} \; n_t^{cell} \; \times \; 8 \; \delta_t^{cell} \; = \; max_t \sum_{cell} \; \tau_t^{cell}

With n_t^{cell} 
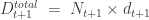
being the number of active users in a given radio cell at the time-instant of unit t taken within a day. \delta_t^{cell} is the Bytes consumed in a time instant (e.g., typically a second); thus, 8 \delta_t^{cell}  gives us the bits per time unit (or bits/sec), which is throughput consumed. Sum over all the cells’ instant throughput (\tau_t^{cell} bits/sec) in the same instant and take the maximum across. For example, a day provides the busiest hour throughput for the whole network. Each radio cell drives its capacity provision and supply (in bits/sec) and the investments required to provide that demanded capacity in the air interface and front- and back-haul.

For example, if n = 6 active (concurrent) users, each consuming on average  = 0.625 Mega Bytes per second (5 Megabits per second, Mbps), the typical requirement for a YouTube stream with an HD 1080p resolution, our radio access network in that cell would experience a demanded load of 30 Mbps (i.e., 6×5 Mbps). Of course, provided that the given cell has sufficient capacity to deliver what is demanded. A 4G cellular system, without any special antenna technology, e.g., Single-in-Single-out (SiSo) classical antenna and not the more modern Multiple-in-Multiple-out (MiMo) antenna, can be expected to deliver ca. 1.5 Mbps/MHz per cell. Thus, we would need at least 20 MHz spectrum to provide for 6 concurrent users, each demanding 5 Mbps. With a simple 2T2R MiMo antenna system, we could support about 8 simultaneous users under the same conditions. A 33% increase in what our system can handle without such an antenna. As mobile operators implement increasingly sophisticated antenna systems (i.e., higher-order MiMo systems) and move to 5G, a leapfrog in the handling capacity and quality will occur.

Figure 34 Is the sky the limit to demand? Ultimately, the limit will come from the practical and economic limits to how much can be supplied at the cellular level (e.g., spectral bandwidth, antenna technology, and software features …). Quality will reduce as the supply limit is reached, resulting in demand adaptation, hopefully settling at a demand-supply (metastable) equilibrium.

Cellular planners have many heuristics to work with that together trigger when a given radio cell would be required to be expanded to provide more capacity, which can be provided by software (licenses), hardware (expansion/replacement), civil works (sectorization/cell splits) and geographical (cell split) means. Going northbound, up from the edge of the radio network up through the transmission chain, such as fronthaul, back, aggregation, and core transport network, may require additional investments in expanding the supplied demand at a given load level.

As discussed, mobile access and transport together can easily make up more than half of a mobile capital budget’s planned and budgeted Capex.

So, to know whether the demand triggers new expansions and thus capital demand as well as the resulting operational expenses (Opex), we really need to look at the supply side. That is what our current mobile network can offer. When it cannot provide a targeted level of quality, how much capacity do we have to add to the network to be on a given level of service quality?

The Cellular Supply.

Cellular capacity in units of throughput (T_{supply}) given in bits per second, the basic building block of quality, is relatively easy to estimate. The cellular throughput (per unit cell) is provided by the amount of committed frequency spectrum to the air interface, what your radio access network and antenna support are, multiplied by the so-called spectral efficiency in bits per Hz per cell. The spectral efficiency depends on the antenna technology and the underlying software implementation of signal processing schemes enabling the details of receiving and sending signals over the air interface.

T_{supply} can be written as follows;

With Mbps being megabits (a million bits) per second and MHz being Mega Herz.

For example, if we have a site that covers 3 cells (or sectors) with a deployed 100 MHz @ 3.6GHz (B) on a 32T32R advanced antenna system (AAS) with an effective downlink (i.e., from the antenna to user), spectral efficiency \eta_{eff} of ca. 20 Mbps/MHz/cell (i.e., \eta_{eff} = n_{eff} \times \eta_{SISO}), we should expect to have a cell throughput on average at 1,000 Mbps (1 Gbps).

The capacity supply formula can be applied to the cell-level consideration providing sizing and thus investment guidance as we move northbound up the mobile network and traffic aggregates and concentrates towards the core and connections points to the external internet.

From the demand planning (e.g., number of customers, types of services sold, etc..), that would typically come from the Marketing and Sales department within the telco company, the technical team can translate those plans into a network demand and then calculate what they would need to do to cope with the customer demand within an agreed level of quality.

In Figure 35 above, operators provide cellular capacity by deploying their spectral assets on an appropriate antenna type and system-level radio access network hardware and software. Competition can arise from a superior spectrum position (balanced across low, medium, and high-frequency bands), better or more aggressive antenna technology, and utilizing their radio access supplier(s)’ features (e.g., signal processing schemes). Usually, the least economical option will be densifying the operator’s site grid where needed (on a macro or micro level).

Figure 36 above shows the various options available to the operator to create more capacity and quality. In terms of competitive edge, more spectrum than competitors provided it is being used and is balanced across low, medium, and high bands, provides the surest path to becoming the best network in a given market and is difficult to economically copy by operators with substantially less spectrum. Their options would be compensating for the spectrum deficit by building more sites and deploying more aggressive antenna technologies. The last one is relatively easy to follow by anyone and may only provide some respite temporarily.  

An average mobile network in Western Europe has ca. 270 MHz spectrum (60 MHz low-band below 1800 and 210 MHz medium-band below 5 GHz) distributed over an average of 7 cellular frequency bands. It is rare to see all bands deployed in actual deployments and not uniformly across a complete network. The amount of spectrum deployed should match demand density; thus, more spectrum is typically deployed in urban areas than in rural ones. In demand-first-driven strategies, the frequency bands will be deployed based on actual demand that would typically not require all bands to be deployed. This is opposed to MNOs that focus on high quality, where demand is less important, and where typically, most bands would be deployed extensively across their networks. The demand-first-driven strategy tends to be the most economically efficient strategy as long as the resulting cellular quality is market-competitive and customers are sufficiently satisfied.

In terms of downlink spectral capacity, we have an average of 155 MHz or 63 MHz, excluding the C-band contribution. Overall, this allows for a downlink supply of a minimum of 40 GB per hour (assuming low effective spectral efficiency, little advanced antenna technology deployed, and not all medium-band being utilized, e.g., C-Band and 2.5 GHz). Out of the 210 MHz mid-band spectrum, 92 MHz falls in the 3.X GHz (C-band) range and is thus still very much in the process of being deployed for 5G (as of June 2022). The C-band has, on average, increased the spectral capacity of Western European telcos by 50+% and, with its very high suitability for deployment together with massive MiMo and advanced antenna systems, effectively more than doubled the total cellular capacity and quality compared to pre-C-band deployment (using a 64T64R massive MiMo as a reference with today’s effective spectral efficiency … it will be even better as time goes by).

Figure 37 (above) shows the latest Ookla and OpenSignal DL speed benchmarks for Western Europe MNOs (light blue circles), and comparing this with their spectrum holdings below 3.x GHz indicates that there may be a lot of unexploited cellular capacity and quality to be unleashed in the future. Although, it would not be for free and likely require substantial additional Capex if deemed necessary. The ‘Expected DL Mbps’ (orange solid line, *) assumes the simplest antenna setup (e.g., classical SiSo antennas) and that all bands are fully used. On average, MNOs above the benchmark line have more advanced antenna setups (higher-order antennas) and fully (or close to) spectrum deployment. MNOs below the benchmark line likely have spectrum assets that have not been fully deployed yet and (or) “under-prioritized” their antenna technology infrastructure. The DL spectrum holding excludes C- and mmWave spectrum. Note:  There was a mistake in the original chart published on LinkedIn as the data was depicted against the total spectrum holding (DL+UL) and not only DL. Data: 54 Western European telcos.

Figure 37 illustrates the Western European cellular performance across MNOs, as measured by DL speed in Mbps, and compares this with the theoretical estimate of the performance they could have if all DL spectrum (not considering C-band, 3.x GHz) in their portfolio had been deployed at a fairly simple antenna setup (mainly SiSo and some 2T2R MiMo) with an effective spectral efficiency of 0.85 Mbps per MHz. It is good to point out that this is expected of 3G HSPA without MiMo. We observe that 21 telcos are above the solid (orange) line, and 33 have an actual average measured performance that is substantially below the line in many cases. Being above the line indicates that most spectrum has been deployed consistently across the network, and more advanced antennas, e.g., higher-order MiMo, are in use. Being below the line does (of course) not mean that networks are badly planned or not appropriately optimized. Not at all. Choices are always made in designing a cellular network. Often dictated by the economic reality of a given operator, geographical demand distribution, clutter particularities, or the modernization cycle an operator may be in. The most obvious reasons for why some networks are operating well under the solid line are; (1) Not all spectrum is being used everywhere (less in rural and more in urban clutter), (2) Rural configurations are simpler and thus provide less performance than urban sites. We have (in general) more traffic demand in urban areas than in rural. Unless a rural area turns seasonally touristic, e.g., lake Balaton in Hungary in the summer … It is simply a good technology planning methodology to prioritize demand in Capex planning, and it makes very good economic sense (3) Many incumbent mobile networks have a fundamental grid based on (GSM) 900MHz and later in-filled for (UMTS) 2100MHz…which typically would have less site density than networks based on (DCS) 1800MHz. However, site density differences between competing networks have been increasingly leveled out and are no longer a big issue in Western Europe (at least).

Overall, I see this as excellent news. For most mobile operators, the spectrum portfolio and the available spectrum bandwidth are not limiting factors in coping with demanded capacity and quality. Operators have many network & technology levers to work with to increase both quality and capacity for their customers. Of course, subject to a willingness to prioritize their Capex accordingly.

A mobile operator has few options to supply cellular capacity and quality demanded by its customer base.

  • Acquire more spectrum bandwidth by buying in an auction, buying from 3rd party (including M&A), asymmetric sharing, leasing, or trading (if regulatory permissible).
  • Deploy a better (spectral efficient) radio access technology, e.g., (2G, 3G) → (4G, 5G) or/and 4G → 5G, etc. Benefits will only be seen once a critical mass of customer terminal equipment supporting that new technology has been reached on the network (e.g., ≥20%).
  • Upgrade antenna technology infrastructure from lower-order passive antennas to higher-order active antenna systems. In the same category would be to ensure that smart, efficient signal processing schemes are being used on the air interface.
  • Building a denser cellular network where capacity demand dictates or coverage does not support the optimum use of higher frequency bands (e.g., 3.x GHz or higher).
  • Small cell deployment in areas where macro-cellular built-out is no longer possible or prohibitively costly. Though small cells scale poorly with respect to economics and maybe really the last resort.

Sectorization with higher-frequency massive-MiMo may be an alternative to small-cell and macro-cellular additions. However, sectorization requires that it is possible civil-engineering wise (e.g., construction) re: structural stability, permissible by the landlord/towerco and finally economic compared to a new site built. Adding more than the usual 3-sectors to a site would further boost site spectral efficiency as more antennas are added.

Acquiring more spectrum requires that such spectrum is available either by a regulatory offering (public auction, public beauty contest) or via alternative means such as 3rd party trading, leasing, asymmetric sharing, or by acquiring an MNO (in the market) with spectrum. In Western Europe, the average cost of spectrum is in the ballpark of 100 million Euro per 10 million population per 20 MHz low-band or 100 MHz medium bands. Within the European Union, recent auctions provide a 20-year usage-rights period before the spectrum would have to be re-auctioned. This policy is very different from, for example, in the USA, where spectrum rights are bought and ownership secured in perpetuity (sometimes conditioned on certain conditions being met). For Western Europe, apart from the mmWave spectrum, in the foreseeable future, there will not be many new spectrum acquisition opportunities in the public domain.

This leaves mobile operators with other options listed above. Re-farming spectrum away from legacy technology (e.g., 2G or 3G) in support of another more spectral efficient access technology (e.g., 4G and 5G) is possibly the most straightforward choice. In general, it is the least costly choice provided that more modern options can support the very few customers left. For either retiring 2G or 3G, operators need to be aware that as long as not all terminal equipment support Voice-over-LTE (VoLTE), they need to keep either 2G or 3G (but not both) for 4G circuit-switched fallback (to 2G or 3G) for legacy voice services. The technologist should be prepared for substantial pushback from the retail and wholesale business, as closing down a legacy technology may lead to significant churn in that legacy customer base. Although, in absolute terms, the churn exposure should be much smaller than the overall customer base. Otherwise, it will not make sense to retire the legacy technology in the first place. Suppose the spectral re-farming is towards a new technology (e.g., 5G). In that case, immediate benefits may not occur before a critical mass of capable devices is making use of the re-farmed spectrum. The Capex impact of spectral re-farming tends to be minor, with possibly some licensing costs associated with net savings from retiring the legacy. Most radio departments within mobile operators, supplier experts, and managed service providers have gained much experience in this area over the last 5 – 7 years.

Another venue that should be taken is upgrading or modernizing the radio access network with more capable antenna infrastructure, such as higher-order massive MiMo antenna systems. As has been pointed out by Prof. Emil Björnson also, the available signal processing schemes (e.g., for channel estimation, pre-coding, and combining) will be essential for the ultimate gain that can be achieved. This will result in a leapfrog increase in spectral efficiency. Thus, directly boosting air-interface capacity and the quality that the mobile customer can enjoy. If we take a 20-year period, this activity is likely to result in a capital demand in the order of 100 million euros for every 1,000 sites being modernized and assumes a modernization (or obsolescence) cycle of 7 years. In other words, within the next 20 years, a mobile operator will have undergone at least 3 antenna-system modernization cycles. It is important to emphasize that this does not (entirely) cover the likely introduction of 6G during the 20 years. Operators face two main risks in their investment strategy. One risk is that they take a short-term look at their capital investments and customer demand projections. As a result, they may invest in insufficient infrastructure solutions to meet future demands, forcing accelerated write-offs and re-investments. The second significant risk is that the operator invests too aggressively upfront in what appears to be the best solution today to find substantially better and more efficient solutions in the near future that more cautious competitive operators could deploy and achieve a substantially higher quality and investment efficiency. Given the lack of technology maturity and the very high pace of innovation in advanced antenna systems, the right timing is crucial but not straightforward.

Last and maybe least, the operator can choose to densify its cellular grid by adding one or more macro-cellular sites or adding small cells across existing macro-cellular coverage. Before it is possible to build a new site or site, the operator or the serving towerco would need to identify suitable locations and subsequently obtain a permit to establish the new site or site. In urban areas, which typically have the highest macro-site densities, getting a new permit may be very time-consuming and with a relatively high likelihood of not being granted by the municipality. Small cells may be easier to deploy in urban environments than in macro sites. For operators making use of towerco to provide the passive site infrastructure, the cost of permitting and building the site and materials (e.g., steel and concrete) is a recurring operational expense rather than a Capex charge. Of course, active equipment remains a Capex item for the relevant mobile operator.

The conclusion I make above is largely consistent with the conclusions made by New Street Research in their piece “European 5G deep-dive” (July 2021). There is plenty of unexploited spectrum with the European operators and even more opportunity to migrate to more capable antenna systems, such as massive-MiMo and active advanced antenna systems. There are also above 3GHz, other spectrum opportunities without having to think about millimeter Wave spectrum and 5G deployment in the high-frequency spectrum range.

ACKNOWLEDGEMENT.

I greatly acknowledge my wife Eva Varadi, for her support, patience, and understanding during the creative process of writing this Blog. There should be no doubt that without the support of Russell Waller (New Street Research), this blog would not have been possible. Thank you so much for providing much of the data that lays the ground for much of the Capex analysis in this article. Of course, a lot of thanks go out to my former Technology and Network Economics colleagues, who have been a source of inspiration and knowledge. I cannot get away with acknowledging Maurice Ketel (who for many years let my Technology Economics Unit in Deutsche Telekom, I respect him above and beyond), Paul Borker, David Haszeldine, Remek Prokopiak, Michael Dueser, Gudrun Bobzin, as well as many, many other industry colleagues who have contributed with valuable insights, discussions & comments throughout the years. Many thanks to Paul Zwaan for a lot of inspiration, insights, and discussions around IT Architecture.

Without executive leadership’s belief in the importance of high-quality techno-financial models, I have no doubt that I would not have been able to build up the experience I have in this field. I am forever thankful, for the trust and for making my professional life super interesting and not just a little fun, to Mads Rasmussen, Bruno Jacobfeuerborn, Hamid Akhavan, Jim Burke, Joachim Horn, and last but certainly not least, Thorsten Langheim.

FURTHER READING.

  1. Kim Kyllesbech Larsen, “The Nature of Telecom Capex.” (July, 2022). My first article laying the ground for Capex in the Telecom industry. The data presented in this article is largely outdated and remains for comparative reasons.
  2. Kim Kyllesbech Larsen, “5G Standalone European Demand Expectations (Part I).”, (January, 2022).
  3. Kim Kyllesbech Larsen, “RAN Unleashed … Strategies for being the best (or the worst) cellular network (Part III).”, (January, 2022).
  4. Tom Copeland, Tim Koller, and Jack Murrin, “Valuation”, John Wiley & Sons, (2000). I regard this as my “bible” when it comes to understanding enterprise valuation. There are obviously many finance books on valuation (I have 10 on my bookshelf). Copeland’s book is the best imo.
  5. Stefan Rommer, Peter Hedman, Magnus Olsson, Lars Frid, Shabnam Sultana, and Catherine Mulligan, “5G Core Networks”, Academic Press, (2020, 1st edition). Good account for what a 5G Core Network entails.
  6. Jia Shen, Zhongda Du, Zhi Zhang, Ning Yang and Hai Tang, “5G NR and enhancements”, Elsevier (2022, 1st edition). Very good and solid account of what 5G New Radio (NR) is about and the considerations around it.
  7. Wim Rouwet, “Open Radio Access Network (O-RAN) Systems Architecture and Design”, Academic Press, (2022). One of the best books on Open Radio Access Network architecture and design (honestly, there are not that many books on this topic yet). I like that the author, at least as an introduction makes the material reasonably accessible to even non-experts (which tbh is also badly needed).
  8. Strand Consult, “OpenRAN and Security: A Literature Review”, (June, 2022). Excellent insights into the O-RAN maturity challenges. This report focuses on the many issues around open source software-based development that is a major part of O-RAN and some deep concerns around what that may mean for security if what should be regarded as critical infrastructure. I warmly recommend their “Debunking 25 Myths of OpenRAN”.
  9. Ian Morris, “Open RAN’s 5G course correction takes it into choppy waters”, Light Reading, (July, 2023).
  10. Hwaiyu Geng P.E., “Data Center Handbook”, Wiley (2021, 2nd edition). I have several older books on the topic that I have used for my models. This one brings the topic of data center design up to date. Also includes the topic of Cloud and Edge computing. Good part on Data Center financial analysis. 
  11. James Farmer, Brian Lane, Kevin Bourgm Weyl Wang, “FTTx Networks, Technology Implementation, and Operations”, Elsevier, (2017, 1st edition). It has some books covering FTTx deployment, GPON, and other alternative fiber technologies. I like this one in particular as it covers hands-on topics as well as basic technology foundations.
  12. Tower companies overview, “Top-12 Global 5G Cell Tower Companies 2021”, (Nov. 2021). A good overview of international tower companies with a meaningful footprint in Europe.
  13. New Street Research, “European 5G deep-dive”, (July, 2021).
  14. Prof. Emil Björnson, https://ebjornson.com/research/ and references therein. Please take a look at many of Prof. Björnson video presentations (e.g., many brilliant YouTube presentations that are fairly assessable).

5G Standalone – Network Slicing, a Bigger Slice of the Value Pie (Part II)

Full disclosure … when I was first introduced to the concept of Network Slicing, from one of the 5G fathers that I respect immensely (Rachid, it must have been back at the end of 2014), I thought that it was one of the most useless concepts that I had heard of. I did simply not see (or get) the point of introducing this level of complexity. It did not feel right. My thoughts were that taking the slicing concept to the limit might actually not make any difference to not having it, except for a tremendous amount of orchestration and management overhead (and, of course, besides the technological fun of developing it and getting it to work).

It felt a bit (a lot, actually) as a “let’s do it because we can” thinking. With the “We can” rationale based on the maturity of cloudification and softwarization frameworks, such as cloud-native, public-cloud scale, cloud computing (e.g., edge), software-defined networks (SDN), network-function virtualization (NFV), and the-one-that-is-always-named Artificial Intelligence (AI). I believed there could be other ways to offer the same variety of service experiences without this additional (what I perceived as an unnecessary) complexity. At the time, I had reservations about its impact on network planning, operations, and network efficiency. Not at all sure, it would be a development in the right economic direction.

Since then, I have softened to the concept of Network Slicing. Not (of course) that I have much choice, as slicing is an integral part of 5G standalone (5G) implementation that will be implemented and launched over the next couple of years across our industry. Who knows, I may very likely be proven very wrong, and then I learn something.

What is a network slice? We can see a network slice as an on-user-demand logical separated network partitioning, software-defined on-top of our common physical network infrastructure (wam … what a mouthful … test me out on this one next time you see me), slicing through our network technology stack and its layers. Thinking of a virtual private network (VPN) tunnel through a transport network is a reasonably good analogy. The network slice’s logical partitioning is isolated from other traffic streams (and slices) flowing through the 5G network. Apart from the slice logical isolation, it can have many different customizations, e.g., throughput, latency, scale, Quality of Service, availability, redundancy, security, etc… The user equipment initiates the slice request from a list of pre-defined slice categories. Assuming the network is capable of supporting its requirements, the chosen slice category is then created, orchestrated, and managed through the underlying physical infrastructure that makes up the network stack. The pre-defined slice categories are designed to match what our industry believe is the most essential use-cases, e.g., (a) enhanced mobile broadband use cases (eMBB), (b) ultra-reliable low-latency communications (uRLLC) use cases, (c) massive machine-type communication (MMTC) use cases, (d) Vehicular-to-anything (V2X) use-cases, etc… While the initial (early day) applications of network slicing are expected to be fairly static and configurationally relatively simple, infrastructure suppliers (e.g., Ericsson, Huawei, Nokia, …)expect network slices to become increasingly dynamic and rich in their configuration possibilities. While slicing is typically evoked for B2B and B2B2X, there is not really a reason why consumers could not benefit from network slicing as well (e.g., gaming/VR/AR, consumer smart homes, consumer vehicular applications, etc..).

Show me the money!

Ericsson and Arthur D. Little (ADL) have recently investigated the network slicing opportunities for communications service providers (CSP). Ericsson and ADL have analyzed more than 70 external market reports on the global digitalization of industries and critically reviewed more than 400 5G / digital use cases (see references in Further Readings below). They conclude that the demand from digitalization cannot be served by CSPs without Network Slicing, e.g., “Current network resources cannot match the increasing diversity of demands over time” and “Use cases will not function” (in a conventional mobile network). Thus, according to Ericsson and ADL, the industry can not “live” without Network Slicing (I guess it is good that it comes with 5G SA then). In fact, from their study, they conclude that 30% of the 5G use cases explored would require network slicing (oh joy and good luck that it will be in our networks soon).

Ericsson and ADL find globally a network slicing business potential of 200 Billion US dollars by 2030 for CSPs. With a robust CAGR (i.e., the potential will keep growing) between 23% to 36% by 2030 (i.e., CAGR estimate for period 2025 to 2030). They find that 6 Industries segments take 90+% of the slicing potential(1) Healthcare (23%), (2) Government (17%), (3) Transportation (15%), (4) Energy & Utilities (14%), (5) Manufacturing (12%) and (6) Media & Entertainment (11%). For the keen observer, we see that the verticals are making up for most of the slicing opportunities, with only a relatively small part being related to the consumers. It should, of course, be noted that not all CSPs are necessarily also mobile network operators (MNOs), and there are also outside the strict domain of MNOs revenue potential for non-MNO CSPs (I assume).

Let us compare this slicing opportunity to global mobile industry revenue projections from 2020 to 2030. GSMA has issued a forecast for mobile revenues until 2025, expecting a total turnover of 1,140 Billion US$ in 2025 at a CAGR (2020 – 2025) of 1.26%. Assuming this compounded annual growth rate would continue to apply, we would expect a global mobile industry revenue of 1,213 Bn US$ by 2030. Our 5G deployments will contribute in the order of 621 Bn US$ (or 51% of the total). The incremental total mobile revenue between 2020 and 2030 would be ca. 140 Bn US$ (i.e., 13% over period). If we say that roughly 20% is attributed to mobile B2B business globally, we have that by 2030 we would expect a B2B turnover of 240+ Bn US$ (an increase of ca. 30 Bn US$ over 2020). So, Ericsson & ADL’s 200 Bn US$ network slicing potential is then ca. 16% of the total 2030 global mobile industry turnover or 30+% of the 5G 2030 turnover. Of course, this assumes that somehow the slicing business potential is simply embedded in the existing mobile turnover or attributed to non-MNO CSPs (monetizing the capabilities of the MNO 5G SA slicing enablers).

Of course, the Ericsson-ADL potential could also be an actual new revenue stream untapped by today’s network infrastructures due to the lack of slicing capabilities that 5G SA will bring in the following years. If so, we can look forward to a boost of the total turnover of 16% over the GSMA-based 2030 projection. Given ca. 90% of the slicing potential is related to B2B business, it may imply that B2B mobile business would almost double due to network slicing opportunities (hmmm).

Another recent study assessed that the global 5G network slicing market will reach approximately 18 Bn US$ by 2030 with a CAGR of ca. 41% over 2020-2030.

Irrespective of the slicing turnover quantum, it is unlikely that the new capabilities of 5G SA (including network slicing and much richer granular quality of service framework) will lead to new business opportunities and enable unexplored use cases. That, in turn, may indeed lead to enhanced monetization opportunities and new revenue streams between now (2022) and 2030 for our industry.

Most Western European markets will see 5G SA being launched over the next 2 to 3 years; as 5G penetration rapidly approaches 50% penetration, I expect network slicing use cases being to be tried out with CSP/MNOs, industry partners, and governmental institutions soon after 5G SA has been launched. It should be pointed out that already for some years, slicing concepts have been trialed out in various settings. Both in 4G as well as 5G NSA networks.

Prologue to Network Slicing.

5G comes with a lot of fundamental capabilities as shown in the picture below,

5G allows for (1) enhanced mobile broadband, (2) very low latency, (3) massive increase in device density handling, i.e., massive device scale-up, (4) ultra-higher network reliability and service availability, and (5) enhanced security (not shown in the above diagram) compared to previous Gs.

The service (and thus network) requirement combinations are very high. The illustration below shows two examples of mapped-out sub-set of service (and therefore also eventually slice) requirements mapped onto the major 5G capabilities. In addition, it is quite likely that businesses would have additional requirements related to slicing performance monitoring, for example, in real-time across the network stack.

and with all the various industrial or vertical use cases (see below) one could imagine (noting that there may be many many more outside our imagination), the “fathers” of 5G became (very) concerned with how such business-critical services could be orchestrated and managed within a traditional mobile network architecture as well as across various public land mobile networks (PLMN). Much of this also comes out of the wish that 5G should “conquer” (take a slice of) next-generation industries (i.e., Industry 4.0), providing additional value above and beyond “the dumb bit pipe.” Moreover, I do believe that in parallel with the wish of becoming much more relevant to Industry 4.0 (and the next generation of verticals requirements), what also played a role in the conception of network slicing is the deeply rooted engineering concept of “control being better than trust” and that “centralized control is better than decentralized” (I lost count on this debate of centralized control vs. distributed management a long time ago).

So, yes … The 5G world is about to get a lot more complex in terms of Industrial use cases that 5G should support. And yes, our consumers will expect much higher download speeds, real-time (whatever that will mean) gaming capabilities, and “autonomous” driving …

“… it’s clear that the one shared public network cannot meet the needs of emerging and advanced mobile connectivity use cases, which have a diverse array of technical operations and security requirements.” (quote from Ericsson and Arthur D. Little study, 2021).

“The diversity of requirements will only grow more disparate between use cases — the one-size-fits-all approach to wireless connectivity will no longer suffice.” (quote from Ericsson and Arthur D. Little study, 2021).

Being a naturalist (yes, I like “naked” networks), it does seem somewhat odd (to me) to say that next generation (e.g., 5G) networks cannot support all the industrious use cases that we may throw at it in its native form. Particular after having invested billions in such networks. By partitioning a network up in limiting (logically isolated), slice instances can all be supported (allegedly). I am still in the thinking phase on that one (but I don’t think the math adds up).

Now, whether one agrees (entirely) with the economic sentiment expressed by Ericsson and ADL or not. We need a richer granular way of orchestrating and managing all those diverse use-cases we expect our 5G network to support.

Network Slicing.

So, we have (or will get) network slicing with our 5G SA Core deployment. As a reminder, when we talk about a network slice, we mean;

“An on-user-demand logical separated network partitioning, software-defined, on-top of a common physical network infrastructure.”

So, the customer requested the network slice, typically via a predefined menu of slicing categories that may also have been pre-validated by the relevant network. Requested slices can also be Customized, by the requester, within the underlying 5G infrastructure capabilities and functionalities. If the network can provide the requested slicing requirements, the slice is (in theory) granted. The core network then orchestrates a logically separated network partitioning throughout the relevant infrastructure resources to comply with the requested requirements (e.g., speed, latency, device scale, coverage, security, etc…). The requested partitioning (i.e., the slice) is isolated from other slices to enable (at least on a logical level) independence of other live slices. Slice Isolation is an essential concept to network slicing. Slice Elasticity ensures that resources can be scaled up and down to ensure individual slice efficiency and an overall efficient operation of all operating slices. It is possible to have a single individual network slice or partition a slice into sub-slices with their individual requirements (that does not breach the overarching slice requirements). GSMA has issued roaming and inter-PLMN guidelines to ensure 5G network slicing inter-operability when a customer’s application finds itself outside its home -PLMN.

Today, and thanks to GSMA and ITU, there are some standard network slice services pre-defined, such as (a) eMBB – Enhanced Mobile Broadband, (b) mMTC – Massive machine-type communications, (c) URLLC – Ultra-reliable low-latency communications, (d) V2X – Vehicular-to-anything communications. These identified standard network slices are called Slice Service Types (SST). SSTs are not only limited to above mentioned 4 pre-defined slice service types. The SSTs are matched to what is called a Generic Slice Template (GST) that currently, we have 37 slicing attributes, allowing for quite a big span of combinations of requirements to be specified and validated against network capabilities and functionalities (maybe there is room for some AI/ML guidance here).

The user-requested network slice that has been set up end-2-end across the network stack, between the 5G Core and the user equipment, is called the network slice instance. The whole slice setup procedure is very well described in Chapter 12 of “5G NR and enhancements, from R15 to R16. The below illustration provides a high-level illustration of various network slices,

The 5G control function Access and Mobility management Function (AMF) is the focal point for the network slicing instances. This particular architectural choice does allow for other slicing control possibilities with a higher or lower degree of core network functionality sharing between slice instances. Again the technical details are explained well in some of the reading resources provided below. The takeaway from the above illustration is that the slice instance specifications are defined for each layer and respective physical infrastructure (e.g., routers, switches, gateways, transport device in general, etc…) of the network stack (e.g., Telco Core Cloud, Backbone, Edge Cloud, Fronthaul, New Radio, and its respective air-interface). Each telco stack layer that is part of a given network slice instance is supposed to adhere strictly to the slice requirements, enabling an End-2-End, from Core to New Radio through to the user equipment, slice of a given quality (e.g., speed, latency, jitter, security, availability, etc..).

And it may be good to keep in mind that although complex industrial use cases get a lot of attention, voice and mobile broadband could easily be set up with their own slice instances and respective quality-of-services.

Network slicing examples.

All the technical network slicing “stuff” is pretty much-taken care of by standardization and provided by the 5G infrastructure solution providers (e.g., Mavenir, Huawei, Ericsson, Nokia, etc..). Figuring the technical details of how these works require an engineering or technical background and a lot of reading.

As I see it, the challenge will be in figuring out, given a use-case, the slicing requirements and whether a single slice instance suffice or multiple are required to provide the appropriate operations and fulfillment. This, I expect, will be a challenge for both the mobile network operator as well as the business partner with the use case. This assumes that the economics will come out right for more complex (e.g., dynamic) and granular slice-instance use cases. For the operator as well as for businesses and public institutions.

The illustration below provides examples of a few (out of the 37) slicing attributes for different use cases, (a) Factories with time-critical, non-time-critical, and connected goods sub-use cases (e.g., sub-slice instances, QoS differentiated), (b) Automotive with autonomous, assisted and shared view sub-use cases, (c) Health use cases, and (d) Energy use cases.

One case that I have been studying is Networked Robotics use cases for the industrial segment. Think here about ad-hoc robotic swarms (for agricultural or security use cases) or industrial production or logistics sorting lines; below are some reflections around that.

End thoughts.

With the emergence of the 5G Core, we will also get the possibility to apply Network slicing to many diverse use cases. That there are interesting business opportunities with network slicing, I think, is clear. Whether it will add 16% to the global mobile topline by 2030, I don’t know and maybe also somewhat skeptical about (but hey, if it does … fantastic).

Today, the type of business opportunities that network slicing brings in the vertical segments is not a very big part of a mobile operator’s core competence. Mobile operators with 5G network slicing capabilities ultimately will need to build up such competence or (and!) team up with companies that have it.

That is, if the future use cases of network slicing, as envisioned by many suppliers, ultimately will get off the ground economically as well as operationally. I remain concerned that network slicing will not make operators’ operations less complex and thus will add cost (and possible failures) to their balance sheets. The “funny” thing (IMO) is that when our 5G networks are relatively unloaded, we would not have a problem delivering the use cases (obviously). Once our 5G networks are loaded, network slicing may not be the right remedy to manage traffic pressure situations or would make the quality we are providing to consumers progressively worse (and I am not sure that business and value-wise, this is a great thing to do). Of course, 6G may solve all those concerns 😉

Acknowledgement.

I greatly acknowledge my wife, Eva Varadi, for her support, patience, and understanding during the creative process of writing this Blog. Also, many of my Deutsche Telekom AG and Industry colleagues, in general, have in countless ways contributed to my thinking and ideas leading to this little Blog. Thank you!

Further readings.

Kim Kyllesbech Larsen, “5G Standalone – European Demand & Expectations (Part I).”, LinkedIn article, (December 2021).

Kim Kyllesbech Larsen, “5G Economics – The Numbers (Appendix X).”, Techneconomyblog.com, (July 2017).

Kim Kyllesbech Larsen, “5G Economics – The Tactile Internet (Chapter 2)”, Techneconomyblog.com, (January 2017).

Henrik Bailier, Jan Lemark, Angelo Centonza, and Thomas Aasberg, “Applied network slicing scenarios in 5G”, Ericsson Technology Review, (February 2021).

Ericsson and Arthur D. Little, “Network slicing: A go-to-market guide to capture the high revenue potential”, Ericsson.com, (2021). The study concludes that network slicing is a 200 Bn. US$ opportunity for CSPs by 2030. It is 1 out of 4 reports on network slicing. See also “Network slicing: Top 10 use cases to target”, “The essential building blocks of E2E network slicing” and “The network slicing transformation journey“.

 S. O’Dea, “Global mobile industry revenue from 2016 to 2025″, (March, 2021).

S. M. Ahsan Kazmi, Latif U.Khan, Nguyen H. Tran, and Choong Seon Hong, “Network Slicing for 5G and Beyond Networks”, Springer International Publishing, (2019). 

Jia Shen, Zhongda Du, & Zhi Zhang, “5G NR and enhancements, from R15 to R16”, Elsevier Science, (2021). Provides a really good overview of what to expect from 5G standalone. Chapter 12 provides a good explanation of (and in detail account for) how 5G Network Slicing works in detail. Definitely one of my favorite books on 5G, it is not “just” an ANRA.

GSMA Association, “An Introduction to Network Slicing”, (2017). A very good introduction to Network slicing.

ITU-T, “Network slice orchestration and management for providing network services to 3rd party in the IMT-2020 network”, Recommendation ITU-T Y.3153 (2019). Describing high-level customer slice request for instantiation, changes and ultimately the termination.

Claudia Campolo, Antonella Molinaro, Antonio Lera, and Francesco Menichella, “5G Network Slicing for Vehicle-to-Everything Services”, IEEE Wireless Communications 24, (December 2017). Great account of how network slicing should work for V2X services.

GSMA, “Securing the 5G Era” (2021). A good overview of security principles in 5G and how previous vulnerabilities in previous cellular generations are being addressed in 5G. This includes some explanation on why slicing further enhances security.

5G Standalone – European Demand & Expectations (Part I).

By the end of 2020, according with Ericsson, it was estimated that there where ca. 7.6 million 5G subscriptions in Western Europe (~ 1%). Compare this to North America’s ca. 14 million (~4%) and 190 million (~11%) North East Asia (e.g, China, South Korea, Japan, …).

Maybe Western Europe is not doing that great, when it comes to 5G penetration, in comparison with other big regional markets around the world. To some extend the reason may be that 4G network’s across most of Western Europe are performing very well and to an extend more than servicing consumers demand. For example, in The Netherlands, consumers on T-Mobile’s 4G gets, on average, a download speed of 100+ Mbps. About 5× the speed you on average would get in USA with 4G.

From the October 2021 statistics of the Global mobile Suppliers Association (GSA), 180 operators worldwide (across 72 countries) have already launched 5G. With 37% of those operators actively marketing 5G-based Fixed Wireless Access (FWA) to consumers and businesses. There are two main 5G deployment flavors; (a) non-standalone (NSA) deployment piggybacking on top of 4G. This is currently the most common deployment model, and (b) as standalone (SA) deployment, independently from legacy 4G. The 5G SA deployment model is to be expected to become the most common over the next couple of years. As of October 2021, 15 operators have launched 5G SA. It should be noted that, operators with 5G SA launched are also likely to support 5G in NSA mode as well, to provide 5G to all customers with a 5G capable handset (e.g., at the moment only 58% of commercial 5G devices supports 5G SA). Only reason for not supporting both NSA and SA would be for a greenfield operator or that the operator don’t have any 4G network (none of that type comes to my mind tbh). Another 25 operators globally are expected to be near launching standalone 5G.

It should be evident, also from the illustration below, that mobile customers globally got or will get a lot of additional download speed with the introduction of 5G. As operators introduce 5G, in their mobile networks, they will leapfrog their available capacity, speed and quality for their customers. For Europe in 2021 you would, with 5G, get an average downlink (DL) speed of 154 ± 90 Mbps compared to 2019 4G DL speed of 26 ± 8 Mbps. Thus, with 5G, in Europe, we have gained a whooping 6× in DL speed transitioning from 4G to 5G. In Asia Pacific, the quality gain is even more impressive with a 10× in DL speed and somewhat less in North America with 4× in DL speed. In general, for 5G speeds exceeding 200 Mbps on average may imply that operators have deployed 5G in the C-band band (e.g., with the C-band covering 3.3 to 5.0 GHz).

The above DL speed benchmark (by Opensignal) gives a good teaser for what to come and to expect from 5G download speed, once a 5G network is near you. There is of course much more to 5G than downlink (and uplink) speed. Some caution should be taken in the above comparison between 4G (2019) and 5G (2021) speed measurements. There are still a fair amount of networks around the world without 5G or only started upgrading their networks to 5G. I would expect the 5G average speed to reduce a bit and the speed variance to narrow as well (i.e., performance becoming more consistent).

In a previous blog I describe what to realistically expect from 5G and criticized some of the visionary aspects of the the original 5G white paper paper published back in February 2015. Of course, the tech-world doesn’t stand still and since the original 5G visionary paper by El Hattachi and Erfanian. 5G has become a lot more tangible as operators deploy it or is near deployment. More and more operators have launched 5G on-top of their 4G networks and in the configuration we define as non-standalone (i.e., 5G NSA). Within the next couple of years, coinciding with the access to higher frequencies (>2.1 GHz) with substantial (unused or underutilized) spectrum bandwidths of 50+ MHz, 5G standalone (SA) will be launched. Already today many high-end handsets support 5G SA ensuring a leapfrog in customer experience above and beyond shear mobile broadband speeds.

The below chart illustrates what to expect from 5G SA, what we already have in the “pocket” with 5G NSA, and how that may compare to existing 4G network capabilities.

There cannot be much doubt that with the introduction of the 5G Core (5GC) enabling 5G SA, we will enrich our capability and service-enabler landscape. Whether all of this cool new-ish “stuff” we get with 5G SA will make much top-line sense for operators and convenience for consumers at large is a different story for a near-future blog (so stay tuned). Also, there should not be too much doubt that 5G NSA already provide most of what the majority of our consumers are looking for (more speed).

Overall, 5G SA brings benefits, above and beyond NSA, on (a) round-trip delay (latency) which will be substantially lower in SA, as 5G does not piggyback on the slower 4G, enabling the low latency in ultra-reliable low latency communications (uRLLC), (b) a factor of 250× improvement device density (1 Million devices per km2) that can be handled supporting massive machine type communication scenarios (mMTC), (c) supports communications services at higher vehicular speeds, (d) in theory should result in low device power consumption than 5G NSA, and (e) enables new and possible less costly ways to achieve higher network (and connection) availability (e.g., with uRLLC).

Compared to 4G, 5G SA brings with it a more flexible, scalable and richer set of quality of service enablers. A 5G user equipment (UE) can have up to 1,024 so called QoS flows versus a 4G UE that can support up to 8 QoS classes (tied into the evolved packet core bearer). The advantage of moving to 5G SA is a significant reduction of QoS driven signaling load and management processing overhead, in comparison to what is the case in a 4G network. In 4G, it has been clear that the QoS enablers did not really match the requirements of many present day applications (i.e., brutal truth maybe is that the 4G QoS was outdated before it went live). This changes with the introduction of 5G SA.

So, when is it a good idea to implement 5G Standalone for mobile operators?

There are maybe three main events that should trigger operators to prepare for and launch 5G SA;

  1. Economical demand for what 5G SA offers.
  2. Critical mass of 5G consumers.
  3. Want to claim being the first to offer 5G SA.

with the 3rd point being the least serious but certainly not an unlikely factor in deploying 5G SA. Apart from potentially enriching consumers experience, there are several operational advantages of transitioning to a 5GC, such as more mature IT-like cloudification of our telecommunications networks (i.e., going telco-cloud native) leading to (if designed properly) a higher degree of automation and autonomous network operations. Further, it may also allow the braver parts of telco-land to move a larger part of its network infrastructure capabilities into the public-cloud domain operated by hyperscalers or network-cloud consortia’s (if such entities will appear). Another element of the 5G SA cloud nativification (a new word?) that is frequently not well considered, is that it will allow operators to start out (very) small and scale up as business and consumer demand increases. I would expect that particular with hyperscalers and of course the-not-so-unusual-telco-supplier-suspects (e.g., Ericsson, Nokia, Huawei, Samsung, etc…), operators could launch fairly economical minimum viable products based on a minimum set of 5G SA capabilities sufficient to provide new and cost-efficient services. This will allow early entry for business-to-business new types of QoS and (or) slice-based services based on our new 5G SA capabilities.

Western Europe mobile market expectations – 5G technology share.

By end of 2021, it is expected that Western Europe would have in the order of 36 Million 5G connections, around a 5% 5G penetration. Increasing to 80 Million (11%) by end of 2022. By 2024 to 2025, it is expected that 50% of all mobile connections would be 5G based. As of October 2021 ca. 58% of commercial available mobile devices supports already 5G SA. This SA share is anticipated to grow rapidly over the next couple of years making 5G NSA increasingly unimportant.

Approaching 50% of all connections being 5G appears a very good time to aim having 5G standalone implemented and launched for operators. Also as this may coincide with substantial efforts to re-farming existing frequency spectrum from 4G to 5G as 5G data traffic exceeds that of 4G.

For Western Europe 2021, ca. 18% of the total mobile connections are business related. This number is expected to steadily increase to about 22% by 2030. With the introduction of new 5G SA capabilities, as briefly summarized above, it is to be expected that the 5G business connection share quickly will increase to the current level and that business would be able to directly monetize uRLLC, mMTC and the underlying QoS and network slicing enablers. For consumers 5G SA will bring some additional benefits but maybe less obvious new monetization possibilities, beyond the proportion of consumers caring about latency (e.g., gamers). Though, it appears likely that the new capabilities could bring operators efficiency opportunities leading to improved margin earned on consumers (for another article).

Recommendation:

  • Learn as much as possible from recent IT cloudification journeys (e.g., from monolithic to cloud, understand pros and cons with lift-and-shift strategies and the intricacies of operating cloud-native environments in public cloud domains).
  • Aim to have 5GC available for 5G SA launch latest by 2024.
  • Run 5GC minimum viable product poc’s with friendly (business) users prior to bigger launch.
  • As 5G is launched on C-band / 3.x GHz it may likewise be a good point in time to have 5G SA available. At least for B2B customers that may benefit from uRLLC, lower latency in general, mMTC, a much richer set of QoS, network slicing, etc…
  • Having a solid 4G to 5G spectrum re-farming strategy ready between now and 2024 (too late imo). This should map out 4G+NSA and SA supply dynamics as increasingly customers get 5G SA capabilities in their devices.

Western Europe mobile market expectations – traffic growth.

With the growth of 5G connections and the expectation that 5G would further boost the mobile data consumption, it is expected that by 2023 – 2024, 50% of all mobile data traffic in Western Europe would be attributed to 5G. This is particular driven by increased rollout of 3.x GHz across the Western European footprint and associated massive MiMo (mMiMo) antenna deployments with 32×32 seems to be the telco-lands choice. In blended mobile data consumption a CAGR of around 34% is expected between 2020 and 2030, with 2030 having about 26× more mobile data traffic than that of 2020. Though, I suspect that in Western Europe, aggressive fiberization of telecommunications consumer and business markets, over the same period, may ultimately slow the growth (and demand) on mobile networks.

A typical Western European operator would have between 80 – 100+ MHz of bandwidth available for 4G its downlink services. The bandwidth variation being determined by how much is required of residual 3G and 2G services and whether the operator have acquired 1500MHz SDL (supplementary downlink) spectrum. With an average 4G antenna configuration of 4×4 MiMo and effective spectral efficiency of 2.25 Mbps/MHz/sector one would expect an average 4G downlink speed of 300+ Mbps per sector (@ 90 MHz committed to 4G). For 5G SA scenario with 100 MHz of 3.x GHz and 2×10 MHz @ 700 MHz, we should expect an average downlink speed of 500+ Mbps per sector for a 32×32 massive MiMo deployment at same effective spectral efficiency as 4G. In this example, although naïve, quality of coverage is ignored. With 5G, we more than double the available throughput and capacity available to the operator. So the question is whether we remain naïve and don’t care too much about the coverage aspects of 3.x GHz, as beam-forming will save the day and all will remain cheesy for our customers (if something sounds too good to be true, it rarely is true).

In an urban environment it is anticipated that with beam-forming available in our mMiMo antenna solutions downlink coverage will be reasonably fine (i.e., on average) with 3.x GHz antennas over-layed on operators existing macro-cellular footprint with minor densification required (initially). In the situation that 3.x GHz uplink cannot reach the on-macro-site antenna, the uplink can be closed by 5G @ 700 MHz, or other lower cellular frequencies available to the operator and assigned to 5G (if in standalone mode). Some concerns have been expressed in literature that present advanced higher order antenna’s (e.g., 16×16 and above ) will on average provide a poorer average coverage quality over a macro cellular area than what consumers would be used to with lower order antennas (e.g., 4×4 or lower) and that the only practical (at least with today’s state of antennas) solution would be sectorization to make up for beam forming shortfalls. In rural and sub-urban areas advanced antennas would be more suitable although the demand would be a lot less than in a busy urban environment. Of course closing the 3.x GHz with existing rural macro-cellular footprint may be a bigger challenge than in an urban clutter. Thus, massive MiMo deployments in rural areas may be much less economical and business case friendly to deploy. As more and more operators deploy 3.x GHz higher-order mMiMo more field experience will become available. So stay tuned to this topic. Although I would reserve a lot more CapEx in my near-future budget plans for substantial more sectorization in urban clutter than what I am sure is currently in most operators plans. Maybe in rural and suburban areas the need for sectorizations would be much smaller but then densification may be needed in order to provide a decent 3.x GHz coverage in general.

Western Europe mobile market expectations – 5G RAN Capex.

That brings us to another important aspect of 5G deployment, the Radio Access Network (RAN) capital expenditures (CapEx). Using my own high-level (EU-based) forecast model based on technology deployment scenario per Western European country that in general considers 1 – 3% growth in new sites per anno until 2024, then from 2025 onwards, I assuming 2 – 5% growth due to densifications needs of 5G, driven by traffic growth and before mentioned coverage limitations of 3.x GHz. Exact timing and growth percentages depends on initial 5G commercial launch, timing of 3.x GHz deployment, traffic density (per site), and site density considering a country’s surface area.

According with Statista, Western Europe had in 2018 a cellular site base of 421 thousands. Further, Statista expected this base will grow with 2% per anno in the years after 2018. This gives an estimated number of cellular sites of 438k in 2020 that has been assumed as a starting point for 2020. The model estimates that by 2030, over the next 10 years, an additional 185k (+42%) sites will have been built in Western Europe to support 5G demand. 65% (120+k) of the site growth, over the next 10 years, will be in Germany, France, Italy, Spain and UK. All countries with relative larger geographical areas that are underserved with mobile broadband services today. Countries with incumbent mobile networks, originally based on 900 MHz GSM grids (of course densified since the good old GSM days), and thus having coarser cellular grids with higher degree of mismatching the higher 5G cellular frequencies (i.e., ≥ 2.5 GHz). In the model, I have not accounted for an increased demand of sectorizations to keep coverage quality upon higher order mMiMO deployments. This, may introduce some uncertainty in the Capex assessment. However, I anticipate that sectorization uncertainty may be covered in the accelerated site demand the last 5 years of the period.

In the illustration above, the RAN capital investment assumes all sites will eventually be fiberized by 2025. That may however be an optimistic assumption and for some countries, even in Western Europe, unrealistic and possibly highly uneconomical. New sites, in my model, are always fiberized (again possibly too optimistic). Miscellaneous (Misc.) accounts for any investments needed to support the RAN and Fiber investments (e.g., Core, Transport, Cap. Labor, etc..).

In the economical estimation price erosion has been taken into account. This erosion is a blended figure accounting for annual price reduction on equipment and increases in labor cost. I am assuming a 5-year replacement cycle with an associated 10% average price increase every 5 years (on the previous year’s eroded unit price). This accounts for higher capability equipment being deployed to support the increased traffic and service demand. The economical justification for the increase unit price being that otherwise even more new sites would be required than assumed in this model. In my RAN CapEx projection model, I am assuming rational deployment, that is demand driven deployment. Thus, operators investments are primarily demand driven, e.g., only deploying infrastructure required within a given financial recovery period (e.g., depreciation period). Thus, if an operator’s demand model indicate that it will need a given antenna configuration within the financial recovery period, it deploys that. Not a smaller configuration. Not a bigger configuration. Only the one required by demand within the financial recovery period. Of course, there may be operators with other deployment incentives than pure demand driven. Though on average I suspect this would have a neglectable effect on the scale of Western Europe (i.e., on average Western Europe Telco-land is assumed to be reasonable economically rational).

All in all, demand over the next 8 years leads to an 80+ Billion Euro RAN capital expenditure, required between 2022 and 2030. This, equivalent to a annual RAN investment level of a bit under 10 Billion Euro. The average RAN CapEx to Mobile Revenue over this period would be ca. 6.3%, which is not a shockingly high level (tbh), over a period that will see an intense rollout of 5G at increasingly higher frequencies and increasingly capable antenna configurations as demand picks up. Biggest threat to capital expenditures is poor demand models (or no demand models) and planning processes investing too much too early, ultimately resulting in buyers regret and cycled in-efficient investment levels over the next 10 years. And for the reader still awake and sharp, please do note that I have not mentioned the huge elephant in the room … The associated incremental operational expense (OpEx) that such investments will incur.

As mobile revenues are not expected to increase over the period 2022 to 2030, this leaves 5G investments main purpose to maintaining current business level dominated by consumer demand. I hope this scenario will not materialize. Given how much extra quality and service potential 5G will deliver over the next 10 years, it seems rather pessimistic to assume that our customers would not be willing to pay more for that service enhancement that 5G will brings with it. Alas, time will show.

Acknowledgement.

I greatly acknowledge my wife Eva Varadi for her support, patience and understanding during the creative process of writing this Blog. Petr Ledl, head of DTAG’s Research & Trials, and his team’s work has been a continuous inspiration to me (thank you so much for always picking up on that phone call Petr!). Also many of my Deutsche Telekom AG, T-Mobile NL & Industry colleagues in general have in countless of ways contributed to my thinking and ideas leading to this little Blog. Thank you!

Further readings.

Kim Kyllesbech Larsen, “5G Standalone Will Deliver! – But What?”, Keynote presentation at Day 2 Telecoms Europe 5G Conference, (November 2021). A YouTube voice over is given here on the presentation.

Kim Kyllesbech Larsen, “5G Economics – The Numbers (Appendix X).”, Techneconomyblog.com, (July 2017).

Kim Kyllesbech Larsen, “5G Economics – An Introduction (Chapter 1)”, Techneconomyblog.com, (December 2016).

Peter Boyland, “The State of Mobile Network Experience – Benchmarking mobile on the eve of the 5G revolution”, OpenSignal, (May 2019).

Ian Fogg, “Benchmarking the Global 5G Experience”, OpenSignal, (November 2021).

Rachid El Hattachi & Javan Erfanian , “5G White Paper”, NGMN Alliance, (February 2015). See also “5G White Paper 2” by Nick Sampson (Orange), Javan Erfanian (Bell Canada) and Nan Hu (China Mobile).

Global Mobile Frequencies Database. (last update, 25 May 2021). I recommend very much to subscribe to this database (€595,. single user license). Provides a wealth of information on spectrum portfolios across the world.

Thomas Alsop, “Number of telecom tower sites in Europe by country in 2018 (in 1,000s)”, Statista Telecommunications, (July 2020).

Jia Shen, Zhongda Du, & Zhi Zhang, “5G NR and enhancements, from R15 to R16”, Elsevier Science, (2021). Provides a really good overview of what to expect from 5G standalone. Particular, very good comparison with what is provided with 4G and the differences with 5G (SA and NSA).

Ali Zaidi, Fredrik Athley, Jonas Medbo, Ulf Gustavsson, Giuseppe Durisi, & Xiaoming Chen, “5G Physical Layer Principles, Models and Technology Components”, Elsevier Science, (2018). The physical layer will always pose a performance limitation on a wireless network. Fundamentally, the amount of information that can be transferred between two locations will be limited by the availability of spectrum, the laws of electromagnetic propagation, and the principles of information theory. This book provides a good description of the 5G NR physical layer including its benefits and limitations. It provides a good foundation for modelling and simulation of 5G NR.

Thomas L. Marzetta, Erik G. Larsson, Hong Yang, Hien Quoc Ngo, “Fundamentals of Massive MIMO”, Cambridge University Press, (2016). Excellent account of the workings of advanced antenna systems such as massive MiMo. 

Western Europe: Western Europe has a bit of a fluid definition (I have found), here Western Europe includes the following countries comprising a population of ca. 425 Million people (in 2021); Austria, Belgium, Denmark, Finland, France, Germany, Greece, Ireland, Italy, Netherlands, Norway, Portugal, Spain, Sweden, Switzerland United Kingdom, Andorra, Cyprus, Faeroe Islands, Greenland, Guernsey, Jersey, Malta, Luxembourg, Monaco, Liechtenstein, San Marino, Gibraltar.

Is the ‘Uber’ moment for the Telecom sector coming?

As I am preparing for my keynote speech for the Annual Dinner event of the Telecom Society Netherlands (TSOC) end of January 2020, I thought the best way was to write down some of my thoughts on the key question “Is the ‘Uber’ moment for the telecom sector coming?”. In the end it turned out to be a lot more than some of my thoughts … apologies for that. Though it might still be worth reading, as many of those considerations in this piece will be hitting a telcos near you soon (if it hasn’t already).

Knowing Uber Technologies Inc’s (Uber) business model well (and knowing at least the Danish taxi industry fairly well as my family has a 70+ years old Taxi company, Radio-Taxi Nykoebing Sjaelland Denmark, started by my granddad in 1949), it instinctively appear to be an odd question … and begs the question “why would the telecom sector want an Uber moment?” … Obviously, we would prefer not to be massively loss making (as is the Uber moment at this and past moments, e.g., several billions of US$ loss over the last couple of years) and also not the regulatory & political headaches (although we have our own). Not to mention some of the negative reputation issues around “their” customer experience (quiet different from telco topics and thank you for that). Also not forgetting that Uber has access to only a fraction of the value chain in the markets the operate … Althans of course Uber is also ‘infinitely’ lighter in terms of assets than a classical Telco … Its also a bit easier to replicate an Uber (or platform businesses in general) than an asset-heavy Telco (as it requires a “bit” less cash to get started;-). But but … of course the question is more related to the type of business model Uber represent rather than the taxi / ride hailing business model itself. Thinking of Uber makes such a question more practical and tangible …

And not to forget … The super cool technology aspects of being a platform business such as Uber … maybe Telco-land can and should learn from platform businesses? … Lets roll!

uber Uber

Uber main business (ca. 81%) is facilitating peer-2-peer ride sharing and ride hailing services via their mobile application and its websites. Uber tabs into the sharing economy. Making use of under-utilized private cars and their owners (producers) willingness to give up hours of their time to drive others (consumers) around in their private vehicle. Uber had 95 million active users (consumers) in 2018 and is expected to reach 110 million in 2019 (22% CAGR between 2016 & 2019). Uber has around 3+ million drivers (producers) spread out over 85+ countries and 900+ cities around the world (although 1/3 is in the USA). In the third quarter of 2019, Uber did 1.77 billion trips. That is roughly 200 trips per Uber driver per month of which the median income is 155 US$ per month (1.27 US$ per trip) before gasoline and insurances. In December 2017, the median monthly salary for Americans was $3,714.

In addition Uber also provides food delivery services (i.e., Uber Eats, ca. 11%), Uber Freight services (ca. 7%) and what they call Other Bets (ca. 1%). The first 9 month of 2019, Uber spend more than 40% of the turnover on R&D. Uber has an average revenue per trip (ARPT) of ca. 2 US$ (out of 9.5 US$ per trip based on gross bookings). Not a lot of ARPT growth the last 9 quarters. Although active users (+30% YoY), trips (+31% YoY), Gross Bookings (+32%) and Adjusted Net Revenue (+35%) all shows double digit growth.

Uber allegedly takes a 25% fee of each fare (note: if you compare gross bookings, the total revenue generated by their services, to net revenue which Uber receives the average is around 20%).

Uber’s market cap, roughly 10 years after being founded, after its IPO was 76 Bn US$ (@ May 10th, 2019) only exceeded by Facebook (104.2 Bn @ IPO) and Alibaba Group (167.6 Bn US$ @ IPO). 7 month after Uber’s market cap is ca. 51 Bn US$ (-33% down on IPO). The leading European telco Deutsche Telekom AG (25 years old, 1995) in comparison has a market capitalization around 70 Bn US$ and is very far from loss making. Deutsche Telekom is one of the world’s leading integrated telecommunications companies, with some 170+ million mobile customers, 28 million fixed-network lines, and 20 million broadband lines.

Peal the Onion

“Telcos are pipe businesses, Ubers are platform businesses”

In other words, Telco’s are adhering to a classical business model with fairly linear causal value chain (see Michael Porter’s classic from 1985). It’s the type of input/output businesses that has been around since the dawn of the industrial revolution. Such a business model can (and should) have a very high degree of end-2-end customer experience control.

Ubers (e.g., Uber, Airbnb, Booking.com, ebay, Tinder, Minecraft, …) are non-linear business models that benefit from direct and indirect network effects allowing for exponential growth dynamics. Such businesses are often piggybacking on under-utilized or un-used assets owned by individuals (e.g., homes & rooms, cars, people time, etc…). Moreover, these businesses facilitate networked connectivity between consumers and producers via a digital platform. As such, platform businesses rarely have complete end-2-end customer experience control but would focus on the quality and experience of networked connectivity. While platform business have little control over their customers (i.e., consumers and producers) experiences or overall customer journey they may have indirectly via near real-time customer satisfaction feedback (although this is after the fact).

Clearly the internet has enabled many new ways of doing business. In particular it allows for digital businesses (infrastructure lite) to create value by facilitating networked-scaled business models where demand (i.e., customers demand XYZ) and supply (i.e., businesses supplying XYZ).

Think of Airbnb‘s internet-based platform that connects (or networks) consumers (guests), who are looking for temporary accommodation (e.g., hotel room), with producers (hosts, private or corporate) of temporary accommodations to each other. Airbnb thus allow for value creation by tying into the sharing economy of private citizens. Under-utilized private property is being monetized, benefiting hosts (producers), guests (consumers) and the platform business (by charging a transactional fee). Airbnb charges hosts a 3% fee that mainly covers the payment processing cost. Moreover, Airbnb’s typical guest fee is under 13% of the booking cost. “Airbnb is a platform business built upon software and other peoples under-utilized homes & rooms”While Airbnb facilitated private (temporary) accommodations to consumers, today there are other online platform businesses (e.g., Booking.com, Experia.com, agoda.com, … ) that facilitates connections between hotels and consumers.

Think of Uber‘s online ride hailing platform connects travelers (consumer) with drivers (producers, private or corporate) as an alternative to normal cab / taxi services. Uber benefits from the under-utilization of most private cars, the private owners willingness to spend spare time and desire to monetize this under-utilization by becoming a private cab driver. Again the platform business exploring the sharing economy. Uber charges their drivers 25% of the faring fee. “Uber is a platform business built upon software and other peoples under-utilized cars and spare time”. The word platform was used 747 times in Uber’s IPO document. After Uber launched its digital online ride hailing platform, many national and regional taxi applications have likewise been launched. Facilitating an easier and more convenient way of hauling a taxi, piggybacking on the penetration of smartphones in any given market. In those models official taxi businesses and licensed taxi drivers collaborate around an classical industry digital platform facilitating and managing dispatches on consumer demand.

“A platform business relies on the sharing economy, monetizing networking (i.e., connecting) consumers and producers by taking a transaction fee on the value of involved transaction flow.”

E.g., consumer pays producer, or consumer get service for free and producer pays the platform business. It is a highly scaleble business model with exponential potential for growth assuming consumers and producers alike adapt your platform. The platform business model tends to be (physical) infrastructure and asset lite and software heavy. It typically (in start-up phase at least) relies on commercially available cloud offering (e.g., Lyft relies on AWS, Uber on AWS & Google) or if the platform business is massively scaled (e.g., Facebook), the choice may be to own data center infrastructure to have better platform control over operations. Typically you will see that successful Platform businesses at scale implements hybrid cloud model levering commercially available cloud solutions and own data centers. Platform businesses tend to be heavily automated (which is relative easy in a modern cloud environment) and rely very significantly on monetizing their data with underlying state-of-the-art real-time big data systems and of course intelligent algorithmic (i.e., machine learning based) business support systems.

Consider this

A platform-business’s technology stack, residing in a cloud, will typically run on a virtual machine or within a so-called container engine. The stack really resides on the upper protocol layers and is transparent to lower level protocols (e..g, physical, link, network, transport, …). In general the platform stack can be understood to function on the 3 platform layers presented in the chart to the left; (top-platform-layer) Networked Marketplace that connects producers and consumers with each other. This layer describes how a platform business customers connect (e.g., mobile app on smartphone), (middle-platform-layer) Enabling Layer in which microservices, software tools, business logic, rules and so forth will reside, (bottom-platform-layer) the Big Data Layer or Data Layer with data-driven decision making are occurring often supported by advanced real-time machine learning applications. The remaining technology stuff (e.g., physical infrastructure, servers, storage, LAN/WAN, switching, fixed and mobile telco networking, etc..) is typically taken care of by cloud or data center providers and telco providers. Which is explains why platform businesses tends to be infrastructure or asset lite (and software heavy) compared to telco and data-center providers.

“Many classical linear businesses are increasingly copying the platform businesses digital strategies (achieving an improved operational excellence) without given up on their fundamental value-chain control. Thus allowing to continue to provide consumers a known and often improved customer experience compared to a pure platform business.”

So what about the Telco model?

Well, the Telco business model is adhering to a linear value chain and business logic. And unless you are thinking of a service telco provider or virtual telco operator, Telcos are incredible infrastructure and asset heavy with massive capital investments required to provide competitive services to their customers. Apart from the required capital intensive underlying telco technology infrastructure, the telco business model requires; (1) public licenses to operate (often auctioned, or purchased and rarely “free”), (2) requires (public) telephony numbers, (3) spectrum frequencies (i.e.,for mobile operation) and so forth …

Furthermore, overall customer experience and end-2-end customer journey is very important to Telcos (as it is to most linear businesses and most would and should subscribe to being very passionate about it). In comparison to Platform Businesses, it would not be an understatement (at this moment in time at least) to say that most Telco businesses are lagging on cloudification/softwarisation, intelligent automation (whether domain-based or End-2-End) and advanced algorithmic (i.e., machine learning enabled) decision making as it relates to overarching business decisions as well as customer-related micro-decisions. However, from an economical perspective we are not talking about more than 10% – 20% of a Telco’s asset base (or capital expenses).

Mobile telco operators tend to be fairly advanced in their approaches to customer experience management, although mainly reactive rather than pro-active (due to lower intelligent algorithmic maturity again in comparison to most platform businesses). In general, fixed telco businesses are relative immature in their approaches to customer experience management (compared to mobile operators) possibly due lack of historical competitive pressure (“why care when consumers have not other choice” mindset). Alas this too is changing as more competition in fixed telco-land emerges.

“Telcos have some technology catching up to do in comparison & where relevant with platform businesses. However, that catching up does not force them to change the fundamentals of their business model (unless it make sense of course).”

Characteristic of a Platform Business

  • Often relies on the sharing economy (i.e., monetizing under-utilized resources).
  • It’s (exponential) growth relies on successful networking of consumers & producers (i.e., piggybacking on network effects).
  • Software-centric: platform business is software and focus / relies on the digital domain & channels.
  • Mobile-centric: mobile apps for consumers & producers.
  • Cloud-centric: platform-solution built on Public or Hybrid cloud models.
  • Cloud-native maturity level (i.e., the highest cloud maturity level).
  • Heavily end-2-end automated across cloud-native platform, processes & decision making.
  • Highly sophisticated data-driven decision making.
  • Infrastructure / asset lite (at scale may involve own data center assets).
  • Business driven & optimized by state-of-art big data real-time solutions supported by a very high level of data science & engineering maturity.
  • Little or no end-2-end customer experience control (i.e., in the sense of complete customer journey).
  • Very strong focus on connection experience including payment process.
  • Revenue source may be in form of transactional fee imposed on the value involved in networking producers and consumers (e.g., payment transaction, cost-per-click, impressions, etc..).

In my opinion it is not a given that a platform business always have to disrupt an existing market (or classical business model). However, a successful platform business often will be transformative, resulting in classical business attempting to copy aspects of the platform business model (e..g, digitalization, automation, cloud transformation, etc..). It is too early in most platform businesses life-cycle to conclude whether, where they disrupt, it is a temporary disruption (until the disrupted have transformed) or a permanently destruction of an existing classical market model (i.e., leaving little or no time for transformation).

So with the above in mind (and I am sure for many other defining factors), it is hard to see a classical telco transforming itself into a carbon copy of a platform business and maybe more importantly why this would make a lot of sense to do in the first instance. But but … it is also clear that Telco-land should proudly copy what make sense (e.g., particular around tech and level of digitization).

Teaser thought Though if you think in terms of sharing economical principles, the freedom that an eSIM (or software-based SIM equivalents) provides with 5 or more network profiles may bring to a platform business going beyond traditional MVNOs or Service Providers … well well … you think! (hint: you may still need an agreement with the classical telco though … if you are not in the club already;-). Maybe a platform model could also tab into under-utilized consumer resources that the consumer has already paid for? or what about a transactional model on Facebook (or other social media) where the consumer actual monetizes (and controls) personal information directly with third party advertisers? (actually in this model the social media company could also share part of its existing spoil earned on their consumer product, i.e., the consumer) etc…

However, it does not mean that telcos cannot (and should not) learn from some of the most successful platform business around. There certainly is enough classical beliefs in the industry that may be ripe for a bit of disruption … so untelconizing (or as my T-Mobile US friends like to call it uncarrier) ourselves may not be such a bad idea.

Telco-land

“There is more to telco technologies than its core network and backend platforms.”

Having a great (=successful) e-commerce business platform with cloud-native maturity level including automation that most telcos can only dream of, and mouth watering real-time big data platforms with the smartest data scientist and data engineers in the world … does not make for an easy straightforward transformation to a national (or world for that matter) leading (or non-leading) telco business in the classical sense of owning the value chain end-to-end.

Japan’s Rakuten is one platform business that has the ambition and expressed intention to move from being traditional platform-based business (ala Amazon.com) to become a mobile operator leveraging all the benefits and know-how of their existing platform technologies. Extending those principles, such as softwarization, cloudification and cloud-native automation principles, all the way out to the edge of the mobile antenna.

Many of us in telco-land thought that starting out with a classical telco, with mobile and maybe fixed assets as well, would make for an easy inclusion of platform-like technologies (as describe above), have had to revise our thinking somewhat. Certainly time-lines have been revised a couple of times, as have the assumed pre-conditions or context for such a transformation. Even economical and operational benefits that seems compelling, at least from a Greenfield perspective, turns out to be a lot more muddy when considering the legacy spaghetti we have in telcos with years and years in bag. And for the ones who keep saying that 5G will change all that … no I really doubt that it will any time soon.

While above platform-like telco topology looks so much simpler than the incumbent one … we should not forget it is what lays underneath the surface that matters. And what matters is software. Lots of software. The danger will always be present that we are ending up replacing hardware & legacy spaghetti complexity with software spaghetti complexity. Resulting unintended consequences in terms of longer-term operational stability (e.g,, when you go beyond being a greenfield business).

“Software have made a lot in the physical world redundant but it may also have leapfrogged the underlying operational complexity to an extend that may pose an existential threat down the line.”

While many platform businesses have perfected cloud-native e-commerce stacks reaching all the way out to the end-consumers mobile apps, residing on the smartphone’s OS, they do operate on the higher level of whatever relevant telco protocol stack. Platform businesses today relies on classical telcos to provide a robust connection data pipe to their end-users at high availability and stability.

What’s coming for us in Telco-land?

“Software will eat more and more of telco-land’s hardware as well as the world.”

(side note: for the ones who want to say that artificial intelligence (AI) will be eating the software, do remember that AI is software too and imo we talk then about autosarcophagy … no further comment;-).

Telcos, of the kinds with a past, will increasingly implement software solutions replacing legacy hardware functionality. Such software will be residing in a cloud environment either in form of public and/or private cloud models. We will be replacing legacy hardware-centric telco components or boxes with a software copy, residing on a boring but highly standardized hardware platform (i.e., a common off the shelf server). Yes … I talk about software definable networks (SDN) and network functional virtualization (NFV) features and functionalities (though I suspect SDN/NFV will be renamed to something else as we have talked about this for too many years for it to keep being exciting;-). The ultimate dream (or nightmare pending on taste) is to have all telco functions defined in software and operating on a very low number of standardized servers (let’s call it the pizza-box model). This is very close to the innovative and quiet frankly disruptive ideas of for example Drivenets in Israel (definitely worth a study if you haven’t already peeked at some of their solutions). We are of course seeing quiet some progress in developing software equivalents to telco core (i.e., Telco Cloud in above picture) functionalities, e.g., evolved packet core (EPC) functions, policy and charging rules function (PCRF), …. These solutions are available from the usual supplier suspects (e.g., Cisco, Ericsson, Huawei, and Nokia) as well as from (relative) new bets, such as for example Affirmed Networks and Mavenir (side note: if you are not the usual supplier suspect and have developed cloud-based telco functionalities drop me a note … particular if such work in a public or hybrid cloud model with for example Azure or AWS).

We will have software eating its way out to the edge of our telco networks. That is assuming it proves to make economical and operational sense (and maybe even anyway;-). As computing requirements, driven by softwarization of telco-land, goes “through the roof” across all network layers, edge computing centers will be deployed (or classical 2G BSC or 3G RNC sites will be re-purposed for the “lucky” operators with a more dis-aggregated network typologies).

Telcos (should) have very strong desires for platform-like automation as we know it from platform businesses cloud-native implementations. For a telco though, the question is whether they can achieve cloud-native automation principles throughout all their network layers and thus possibly allow for end-2-end (E2E) automation principles as known in a cloud-native world (which scope wise is more limited than the full telco stack). This assumes that an E2E automation goal makes economical and operational sense compared to domain-oriented automation (with domains not per see matching one to one the traditional telco network layers). While it is tempting to get all enthusiastic & winded-up about the role of artificial intelligence (AI) in telco (or any other) automation framework, it always make sense to take an ice cold shower and read up on non-AI based automation schemes as we have them in a cloud-native cloud environment before jumping into the rabbit hole. I also think that we should be very careful architecturally to spread intelligent agents all over our telco architecture and telco stack. AI will have an important mission in pro-active customer experience solutions and anomaly detection. The devil may be in how we close the loop of an intelligent agent’s output and a input to our automation framework.

To summarize what’s coming for the Telco sector;

  • Increased softwarization (or virtualization) moving from traditional platform layers out towards the edge.
  • Increased leveraging of cloud models (e.g., private, public, hybrid) following the path of softwarization.
  • Strive towards cloud-native operations including the obvious benefits from (non-AI based) automation that the cloud-native framework brings.
  • We will see a lot of focus on developing automation principles across the telco stack to the extend such will be different from cloud-native principles (note: expect there will be some at least for non-Greenfield implementations but also in general as the telco stack is not idem ditto a traditional platform stack). This may be hampered by lack of architectural standardization alignment across our industry. There is a risk that we will push for AI-based automation without exploring fully what non-AI based schemes may bring.
  • Inevitable the industry will spend much more efforts on developing cognitive-based pro-active customer experience solutions as well as expanding anomaly detection across the full telco stack. This will help in dealing with design complexities although might also be hampered by mis-alignment on standardization. Not to mention that AI should never become an excuse to not simplify designs and architectures.
  • Plus anything clever that I have not thought about or forgot to mention 🙂

So yes … softwarization, cloudification and aggressive (non-AI based) automation, known from platform-centric businesses, will be coming (in fact has arrived to an extend) for Telcos … over time and earlier for the few new brave Telco Greenfields …

Artificial intelligence based solutions will have a mission in pro-active customer experience (e.g., cellwizeuhana, …), zero-touch predictive maintenance, self-restoration & healing, and for advanced anomaly detection solutions (e.g., see Anodot as a leading example here). All are critical requirements in the new (and obviously in the old as well) telco world is being eaten by software. Self-learning “conscious” (defined in a relative narrow technical sense) anomaly detection solutions across the telco stack is in my opinion a must to deal with today’s and the future’s highly complex software architectures and systems.

I am also speculating whether intelligent agents (e.g., microagents reacting to an events) may make the telco layers less reliant on top-down control and orchestration (… I am also getting goosebumps by that idea … so maybe this is not good … hmmm … or I am cold … but then again orchestration is for non-trusting control “freaks”). Such a reactive microagent (or microservice) could take away the typical challenges with stack orchestration (e.g., blocking, waiting, …), decentralize control across the telco stack.

And no … we will not become Ubers … although there might be Ubers that will try to become us … The future will show …

Acknowledgement.

I also greatly acknowledge my wife Eva Varadi for her support, patience and understanding during the creative process of writing this Blog. Also many of my Deutsche Telekom AG, T-Mobile NL & Industry colleagues in general have in countless of ways contributed to my thinking and ideas leading to this little Blog. Thank you!

Further reading

Mike Isaac“Super Pumped – The Battle for Uber”, 2019, W.W. Norton & Company. A good read and what starts to look like a rule of a Silicon Valley startup behavior (the very worst and of course some of the best). Irrespective of the impression this book leaves with me, I am also deeply impressed (maybe even more after reading the book;-) what Uber’s engineers have been pulling off over the last couple of years.

Muchneeded.com“Uber by the Numbers: Users & Drivers Statistics, Demographics, and Fun Facts”, 2018. The age of the Uber statistics presented varies a lot. It’s a nice overall summary but for most recent stats please check against financial reports or directly from Uber’s own website.

Graham Rapier“Uber lost $5.2 billion in 3 months. Here’s where all that money went”, 2019, Business Insider. As often is the case with web articles, it is worth actually reading the article. Out of the $5.2 billion, $3.9 Billion was due to stock-based compensation. Still a loss of $1.3 billion is nevertheless impressive as well. In 2018 the loss was $1.8 billion and $4.5 billion in 2017.

Chris Anderson“Free – The Future of a Radical Price”, (2009), Hyperion eBook. This is one of the coolest books I have read on the topic of freemium, sharing economy and platform-based business models. A real revelations and indeed a confirmation that if you get something for free, you are likely not a customer but a product. A must read to understand the work around us. In this setting it is also worth reading “What is a Free Customer Worth?” by Sunil Gupta & Carl F. Mela (HBR, 2008).

Sangeet Paul Choudary“Platform Scale”, (2015), Platform Thinking Labs Pte. Ltd. A must read for anyone thinking of developing a platform based business. Contains very good detailed end-2-end platform design recommendations. If you are interested in knowing the most important aspects of Platform business models and don’t have time for more academic deep dive, this is most likely the best book to read.

Laure Claire Reillier & Benout Reillier“Platform Strategy”, (2017), Routledge Taylor & Francis Group. Very systematic treatment of platform economics and all strategic aspects of a platform business. It contains a fairly comprehensive overview of academic works related to platform business models and economics (that is if you want to go deeper than for example Choudary’s excellent “Platform Scale” above).

European Commission Report on “Study on passenger transport by taxi, hire car with driver and ridesharing in the EU”, (2016), European Commission.

Michal Gromek“Business Models 2.0 – Freemium & Platform based business models“, (2017), Slideshare.net.

Greg Satell“Don’t Believe Everything You Hear About Platform Businesses”, (2018), Inc.. A good critique of the hype around platform business models.

Jean-Charles Rochet & Jean Tirole“Platform Competition in Two-sided Markets” (2003), Journal of the European Economic Association, 1, 990. Rochet & Tirole formalizes the economics of two-sided markets. The math is fairly benign but requires a mathematical background. Beside the math their paper contains some good descriptions of platform economics.

Eitan Muller“Delimiting disruption: Why Uber is disruptive, but Airbnb is not”, (2019), International Journal of Research in Marketing. Great account (backed up with data) for the disruptive potential of platform business models going beyond (and rightly so) Clayton Christensen Disruptive Theory.

Todd W. Schneider“Taxi and Ridehailing Usage in New York City”, a cool site that provides historical and up-to-date taxi and ride hailing usage data for New York and Chicago. This gives very interesting insights into the competitive dynamics of Uber / Ride hailing platform businesses vs the classical taxi business. It also shows that while ride hailing businesses have disrupted the taxi business in totality, being a driver for a ride hailing platform is not that great either (and as Uber continues to operate at impressive losses maybe also not for Uber either at least in their current structure).

Uber Engineering is in general a great resource for platform / stack architecture, system design, machine learning, big data & forecasting solutions for a business model relying on real-time transactions. While I personally find the Uber architecture or system design too complex it is nevertheless an impressive solution that Uber has developed. There are many noteworthy blog posts to be found on the Uber Engineering site. Here is a couple of foundational ones (both from 2016 so please be aware that lots may have changed since then) “The Uber Engineering Tech Stack, Part I: The Foundation” (Lucie Lozinski, 2016) and “The Uber Engineering Tech Stack, Part II: The Edge and Beyond” (Lucie Lozinski, 2016) . I also found “Uber’s Big Data Platform: 100+ Petabytes with Minute Latency” post (by Reza Shiftehfar, 2018) very interesting in describing the historical development and considerations Uber went through in their big data platform as their business grew and scale became a challenge in their designs. This is really a learning resource.

Wireless One“Rakuten: Japan’s new #4 is going all cloud”, 2019. Having had the privilege to visit Rakuten in Japan and listen to their chief-visionary Tareq Amin (CTO) they clearly start from being a platform-centric business (i.e., Asia’s Amazon.com) with the ambition to become a new breed of telco levering their platform technologies (and platform business model thinking) all the way out to the edge of the mobile base station antenna. While I love that Tareq Amin actually has gone and taken his vision from powerpoint to reality, I also think that Rakuten benefits (particular many of the advertised economical benefits) from being more a Greenfield telco than an established telco with a long history and legacy. In this respect it is humbling that their biggest stumbling block or challenge for launching their services is site rollout (yes touchy-feel infrastructure & real estate is a b*tch!). See also “Rakuten taking limited orders for services on its delayed Japan mobile network” (October, 2019).

Justin Garrison & Chris Nova“Cloud Native Infrastructure”, 2018, O’Reilly and Kief Morris“Infrastructure as Code”, 2016, O’Reilly. I am usually using both these books as my reference books when it comes to cloud native topics and refreshing my knowledge (and hopefully a bit of understanding).

Marshall W. Van AlstyneGeoffrey G. Parker and Sangeet Paul Choudary“Pipelines, Platforms and the New Rules of Strategy”, 2016, Harvard Business Review (April Issue).

Murat Uenlue“The Complete Guide to the Revolutionary Platform Business Model”, 2017. Good read. Provides a great overview of platform business models and attempts systematically categorize platform businesses (e.g., Communications Platform, Social Platform, Search Platform, Open OS Platforms, Service Platforms, Asset Sharing Platforms, Payment Platforms, etc….).

5G Economics – The Numbers (Appendix X).

5G essense

100% COVERAGE.

100% 5G coverage is not going to happen with 30 – 300 GHz millimeter-wave frequencies alone.

The “NGMN 5G white paper” , which I will in the subsequent parts refer to as the 5G vision paper, require the 5G coverage to be 100%.

At 100% cellular coverage it becomes somewhat academic whether we talk about population coverage or geographical (area) coverage. The best way to make sure you cover 100% of population is covering 100% of the geography. Of course if you cover 100% of the geography, you are “reasonably” ensured to cover 100% of the population.

While it is theoretically possible to cover 100% (or very near to) of population without covering 100% of the geography, it might be instructive to think why 100% geographical coverage could be a useful target in 5G;

  1. Network-augmented driving and support for varous degrees of autonomous driving would require all roads to be covered (however small).
  2. Internet of Things (IoT) Sensors and Actuators are likely going to be of use also in rural areas (e.g., agriculture, forestation, security, waterways, railways, traffic lights, speed-detectors, villages..) and would require a network to connect to.
  3. Given many users personal area IoT networks (e.g., fitness & health monitors, location detection, smart-devices in general) ubiquitous becomes essential.
  4. Internet of flying things (e.g., drones) are also likely to benefit from 100% area and aerial coverage.

However, many countries remain lacking in comprehensive geographical coverage. Here is an overview of the situation in EU28 (as of 2015);

broadband coverage in eu28

For EU28 countries, 14% of all house holds in 2015 still had no LTE coverage. This was approx.30+ million households or equivalent to 70+ million citizens without LTE coverage. The 14% might seem benign. However, it covers a Rural neglect of 64% of households not having LTE coverage. One of the core reasons for the lack of rural (population and household) coverage is mainly an economic one. Due to the relative low number of population covered per rural site and compounded by affordability issues for the rural population, overall rural sites tend to have low or no profitability. Network sharing can however improve the rural site profitability as site-related costs are shared.

From an area coverage perspective, the 64% of rural households in EU28 not having LTE coverage is likely to amount to a sizable lack of LTE coverage area. This rural proportion of areas and households are also very likely by far the least profitable to cover for any operator possibly even with very progressive network sharing arrangements.

Fixed broadband, Fiber to the Premises (FTTP) and DOCSIS3.0, lacks further behind that of mobile LTE-based broadband. Maybe not surprisingly from an business economic perspective, in rural areas fixed broadband is largely unavailable across EU28.

The chart below illustrates the variation in lack of broadband coverage across LTE, Fiber to the Premises (FTTP) and DOCSIS3.0 (i.e., Cable) from a total country perspective (i.e., rural areas included in average).

delta to 100% hh coverage

We observe that most countries have very far to go on fixed broadband provisioning (i.e., FTTP and DOCSIS3.0) and even on LTE coverage lacks complete coverage. The rural coverage view (not shown here) would be substantially worse than the above Total view.

The 5G ambition is to cover 100% of all population and households. Due to the demographics of how rural households (and populations) are spread, it is also likely that fairly large geographical areas would need to be covered in order to come true on the 100% ambition.

It would appear that bridging this lack of broadband coverage would be best served by a cellular-based technology. Given the fairly low population density in such areas relative higher average service quality (i.e., broadband) could be delivered as long as the cell range is optimized and sufficient spectrum at a relative low carrier frequency (< 1 GHz) would be available. It should be remembered that the super-high 5G 1 – 10 Gbps performance cannot be expected in rural areas. Due to the lower carrier frequency range need to provide economic rural coverage both advanced antenna systems and very large bandwidth (e.g., such as found in the mm-frequency range)  would not be available to those areas. Thus limiting the capacity and peak performance possible even with 5G.

I would suspect that irrespective of the 100% ambition, telecom providers would be challenged by the economics of cellular deployment and traffic distribution. Rural areas really sucks in profitability, even in fairly aggressive sharing scenarios. Although multi-party (more than 2) sharing might be a way to minimize the profitability burden on deep rural coverage.

ugly_tail_thumb.png

The above chart shows the relationship between traffic distribution and sites. As a rule of thumb 50% of revenue is typically generated by 10% of all sites (i.e., in a normal legacy mobile network) and approx. 50% of (rural) sites share roughly 10% of the revenue. Note: in emerging markets the distribution is somewhat steeper as less comprehensive rural coverage typically exist. (Source: The ABC of Network Sharing – The Fundamentals.).

Irrespective of my relative pessimism of the wider coverage utility and economics of millimeter-wave (mm-wave) based coverage, there shall be no doubt that mm-wave coverage will be essential for smaller and smallest cell coverage where due to density of users or applications will require extreme (in comparison to today’s demand) data speeds and capacities. Millimeter-wave coverage-based architectures offer very attractive / advanced antenna solutions that further will allow for increased spectral efficiency and throughput. Also the possibility of using mm-wave point to multipoint connectivity as last mile replacement for fiber appears very attractive in rural and sub-urban clutters (and possible beyond if the cost of the electronics drop according the expeced huge increase in demand for such). This last point however is in my opinion independent of 5G as Facebook with their Terragraph development have shown (i.e., 60 GHz WiGig-based system). A great account for mm-wave wireless communications systems  can be found in T.S. Rappaport et al.’s book “Millimeter Wave Wireless Communications” which not only comprises the benefits of mm-wave systems but also provides an account for the challenges. It should be noted that this topic is still a very active (and interesting) research area that is relative far away from having reached maturity.

In order to provide 100% 5G coverage for the mass market of people & things, we need to engage the traditional cellular frequency bands from 600 MHz to 3 GHz.

1 – 10 Gbps PEAK DATA RATE PER USER.

Getting a Giga bit per second speed is going to require a lot of frequency bandwidth, highly advanced antenna systems and lots of additional cells. And that is likely going to lead to a (very) costly 5G deployment. Irrespective of the anticipated reduced unit cost or relative cost per Byte or bit-per-second.

At 1 Gbps it would take approx. 16 seconds to download a 2 GB SD movie. It would take less than a minute for the HD version (i.e., at 10 Gbps it just gets better;-). Say you have a 16GB smartphone, you loose maybe up to 20+% for the OS, leaving around 13GB for things to download. With 1Gbps it would take less than 2 minutes to fill up your smartphones storage (assuming you haven’t run out of credit on your data plan or reached your data ceiling before then … of course unless you happen to be a customer of T-Mobile US in which case you can binge on = you have no problems!).

The biggest share of broadband usage comes from video streaming which takes up 60% to 80% of all volumetric traffic pending country (i.e., LTE terminal penetration dependent). Providing higher speed to your customer than is required by the applied video streaming technology and smartphone or tablet display being used, seems somewhat futile to aim for. The Table below provides an overview of streaming standards, their optimal speeds and typical viewing distance for optimal experience;

video-resolution-vs-bandwitdh-requirements_thumb.png

Source: 5G Economics – An Introduction (Chapter 1).

So … 1Gbps could be cool … if we deliver 32K video to our customers end device, i.e., 750 – 1600 Mbps optimal data rate. Though it is hard to see customers benefiting from this performance boost given current smartphone or tablet display sizes. The screen size really have to be ridiculously large to truly benefit from this kind of resolution. Of course Star Trek-like full emersion (i.e., holodeck) scenarios would arguably require a lot (=understatement) bandwidth and even more (=beyond understatement) computing power … though such would scenario appears unlikely to be coming out of cellular devices (even in Star Trek).

1 Gbps fixed broadband plans have started to sell across Europe. Typically on Fiber networks although also on DOCSIS3.1 (10Gbps DS/1 Gbps US) networks as well in a few places. It will only be a matter of time before we see 10 Gbps fixed broadband plans being offered to consumers. Irrespective of compelling use cases might be lacking it might at least give you the bragging rights of having the biggest.

From European Commissions “Europe’s Digital Progress Report 2016”,  22 % of European homes subscribe to fast broadband access of at least 30 Mbps. An estimated 8% of European households subscribe to broadband plans of at least 100 Mbps. It is worth noticing that this is not a problem with coverage as according with the EC’s “Digital Progress Report” around 70% of all homes are covered with at least 30 Mbps and ca. 50% are covered with speeds exceeding 100 Mbps.

The chart below illustrates the broadband speed coverage in EU28;

broadband speed hh coverage.png

Even if 1Gbps fixed broadband plans are being offered, still majority of European homes are at speeds below the 100 Mbps. Possible suggesting that affordability and household economics plays a role as well as the basic perceived need for speed might not (yet?) be much beyond 30 Mbps?

Most aggregation and core transport networks are designed, planned, built and operated on a assumption of dominantly customer demand of lower than 100 Mbps packages. As 1Gbps and 10 Gbps gets commercial traction, substantial upgrades are require in aggregation, core transport and last but not least possible also on an access level (to design shorter paths). It is highly likely distances between access, aggregation and core transport elements are too long to support these much higher data rates leading to very substantial redesigns and physical work to support this push to substantial higher throughputs.

Most telecommunications companies will require very substantial investments in their existing transport networks all the way from access to aggregation through the optical core switching networks, out into the world wide web of internet to support 1Gbps to 10 Gbps. Optical switching cards needs to be substantially upgraded, legacy IP/MPLS architectures might no longer work very well (i.e., scale & complexity issue).

Most analysts today believe that incumbent fixed & mobile broadband telecommunications companies with a reasonable modernized transport network are best positioned for 5G compared to mobile-only operators or fixed-mobile incumbents with an aging transport infrastructure.

What about the state of LTE speeds across Europe? OpenSignal recurrently reports on the State of LTE, the following summarizes LTE speeds in Mbps as of June 2017 for EU28 (with the exception of a few countries not included in the OpenSignal dataset);

opensignal state of lte 2017

The OpenSignal measurements are based on more than half a million devices, almost 20 billion measurements over the period of the 3 first month of 2017.

The 5G speed ambition is by todays standards 10 to 30+ times away from present 2016/2017 household fixed broadband demand or the reality of provided LTE speeds.

Let us look at cellular spectral efficiency to be expected from 5G. Using the well known framework;

cellular capacity fundamentals

In essence, I can provide very high data rates in bits per second by providing a lot of frequency bandwidth B, use the most spectrally efficient technologies maximizing η, and/or add as many cells N that my economics allow for.

In the following I rely largely on Jonathan Rodriquez great book on “Fundamentals of 5G Mobile Networks” as a source of inspiration.

The average spectral efficiency is expected to be coming out in the order of 10 Mbps/MHz/cell using advanced receiver architectures, multi-antenna, multi-cell transmission and corporation. So pretty much all the high tech goodies we have in the tool box is being put to use of squeezing out as many bits per spectral Hz available and in a sustainable matter. Under very ideal Signal to Noise Ratio conditions, massive antenna arrays of up to 64 antenna elements (i.e., an optimum) seems to indicate that 50+ Mbps/MHz/Cell might be feasible in peak.

So for a spectral efficiency of 10 Mbps/MHz/cell and a demanded 1 Gbps data rate we would need 100 MHz frequency bandwidth per cell (i.e., using the above formula). Under very ideal conditions and relative large antenna arrays this might lead to a spectral requirement of only 20 MHz at 50 Mbps/MHz/Cell. Obviously, for 10 Gbps data rate we would require 1,000 MHz frequency bandwidth (1 GHz!) per cell at an average spectral efficiency of 10 Mbps/MHz/cell.

The spectral efficiency assumed for 5G heavily depends on successful deployment of many-antenna segment arrays (e.g., Massive MiMo, beam-forming antennas, …). Such fairly complex antenna deployment scenarios work best at higher frequencies, typically above 2GHz. Also such antenna systems works better at TDD than FDD with some margin on spectral efficiency. These advanced antenna solutions works perfectly  in the millimeter wave range (i.e., ca. 30 – 300 GHz) where the antenna segments are much smaller and antennas can be made fairly (very) compact (note: resonance frequency of the antenna proportional to half the wavelength with is inverse proportional to the carrier frequency and thus higher frequencies need smaller material dimension to operate).

Below 2 GHz higher-order MiMo becomes increasingly impractical and the spectral efficiency regress to the limitation of a simple single-path antenna. Substantially lower than what can be achieved at much high frequencies with for example massive-MiMo.

So for the 1Gbps to 10 Gbps data rates to work out we have the following relative simple rationale;

  • High data rates require a lot of frequency bandwidth (>100 MHz to several GHz per channel).
  • Lots of frequency bandwidth are increasingly easier to find at high and very high carrier frequencies (i.e., why millimeter wave frequency band between 30 – 300 GHz is so appealing).
  • High and very high carrier frequencies results in small, smaller and smallest cells with very high bits per second per unit area (i.e., the area is very small!).
  • High and very high carrier frequency allows me to get the most out of higher order MiMo antennas (i.e., with lots of antenna elements),
  • Due to fairly limited cell range, I boost my overall capacity by adding many smallest cells (i.e., at the highest frequencies).

We need to watch out for the small cell densification which tends not to scale very well economically. The scaling becomes a particular problem when we need hundreds of thousands of such small cells as it is expected in most 5G deployment scenarios (i.e., particular driven by the x1000 traffic increase). The advanced antenna systems required (including the computation resources needed) to max out on spectral efficiency are likely going to be one of the major causes of breaking the economical scaling. Although there are many other CapEx and OpEx scaling factors to be concerned about for small cell deployment at scale.

Further, for mass market 5G coverage, as opposed to hot traffic zones or indoor solutions, lower carrier frequencies are needed. These will tend to be in the usual cellular range we know from our legacy cellular communications systems today (e.g., 600 MHz – 2.1 GHz). It should not be expected that 5G spectral efficiency will gain much above what is already possible with LTE and LTE-advanced at this legacy cellular frequency range. Sheer bandwidth accumulation (multi-frequency carrier aggregation) and increased site density is for the lower frequency range a more likely 5G path. Of course mass market 5G customers will benefit from faster reaction times (i.e., lower latencies), higher availability, more advanced & higher performing services arising from the very substantial changes expected in transport networks and data centers with the introduction of 5G.

Last but not least to this story … 80% and above of all mobile broadband customers usage, data as well as voice, happens in very few cells (e.g., 3!) … representing their Home and Work.

most traffic in very few cells

Source: Slideshare presentation by Dr. Kim “Capacity planning in mobile data networks experiencing exponential growth in demand.”

As most of the mobile cellular traffic happen at the home and at work (i.e., thus in most cases indoor) there are many ways to support such traffic without being concerned about the limitation of cell ranges.

The giga bit per second cellular service is NOT a service for the mass market, at least not in its macro-cellular form.

≤ 1 ms IN ROUND-TRIP DELAY.

A total round-trip delay of 1 or less millisecond is very much attuned to niche service. But a niche service that nevertheless could be very costly for all to implement.

I am not going to address this topic too much here. It has to a great extend been addressed almost to ad nauseam in 5G Economics – An Introduction (Chapter 1) and 5G Economics – The Tactile Internet (Chapter 2). I think this particular aspect of 5G is being over-hyped in comparison to how important it ultimately will turn out to be from a return on investment perspective.

Speed of light travels ca. 300 km per millisecond (ms) in vacuum and approx. 210 km per ms in fiber (some material dependency here). Lately engineers have gotten really excited about the speed of light not being fast enough and have made a lot of heavy thinking abou edge this and that (e.g., computing, cloud, cloudlets, CDNs,, etc…). This said it is certainly true that most modern data centers have not been build taking too much into account that speed of light might become insufficient. And should there really be a great business case of sub-millisecond total (i.e., including the application layer) roundtrip time scales edge computing resources would be required a lot closer to customers than what is the case today.

It is common to use delay, round-trip time or round-trip delay, or latency as meaning the same thing. Though it is always cool to make sure people really talk about the same thing by confirming that it is indeed a round-trip rather than single path. Also to be clear it is worthwhile to check that all people around the table talk about delay at the same place in the OSI stack or  network path or whatever reference point agreed to be used.

In the context of  the 5G vision paper it is emphasized that specified round-trip time is based on the application layer (i.e., OSI model) as reference point. It is certainly the most meaningful measure of user experience. This is defined as the End-2-End (E2E) Latency metric and measure the complete delay traversing the OSI stack from physical layer all the way up through network layer to the top application layer, down again, between source and destination including acknowledgement of a successful data packet delivery.

The 5G system shall provide 10 ms E2E latency in general and 1 ms E2E latency for use cases requiring extremely low latency.

The 5G vision paper states “Note these latency targets assume the application layer processing time is negligible to the delay introduced by transport and switching.” (Section 4.1.3 page 26 in “NGMN 5G White paper”).

In my opinion it is a very substantial mouthful to assume that the Application Layer (actually what is above the Network Layer) will not contribute significantly to the overall latency. Certainly for many applications residing outside the operators network borders, in the world wide web, we can expect a very substantial delay (i.e., even in comparison with 10 ms). Again this aspect was also addressed in my two first chapters.

Very substantial investments are likely needed to meet E2E delays envisioned in 5G. In fact the cost of improving latencies gets prohibitively more expensive as the target is lowered. The overall cost of design for 10 ms would be a lot less costly than designing for 1 ms or lower. The network design challenge if 1 millisecond or below is required, is that it might not matter that this is only a “service” needed in very special situations, overall the network would have to be designed for the strictest denominator.

Moreover, if remedies needs to be found to mitigate likely delays above the Network Layer, distance and insufficient speed of light might be the least of worries to get this ambition nailed (even at the 10 ms target). Of course if all applications are moved inside operator’s networked premises with simpler transport paths (and yes shorter effective distances) and distributed across a hierarchical cloud (edge, frontend, backend, etc..), the assumption of negligible delay in layers above the Network Layer might become much more likely. However, it does sound a lot like America Online walled garden fast forward to the past kind of paradigm.

So with 1 ms E2E delay … yeah yeah … “play it again Sam” … relevant applications clearly need to be inside network boundary and being optimized for processing speed or silly & simple (i.e., negligible delay above the Network Layer), no queuing delay (to the extend of being in-efficiency?), near-instantaneous transmission (i.e., negligible transmission delay) and distances likely below tenth of km (i.e., very short propagation delay).

When the speed of light is too slow there are few economic options to solve that challenge.

≥ 10,000 Gbps / Km2 DATA DENSITY.

The data density is maybe not the most sensible measure around. If taken too serious could lead to hyper-ultra dense smallest network deployments.

This has always been a fun one in my opinion. It can be a meaningful design metric or completely meaningless.

There is of course nothing particular challenging in getting a very high throughput density if an area is small enough. If I have a cellular range of few tens of meters, say 20 meters, then my cell area is smaller than 1/1000 of a km2. If I have 620 MHz bandwidth aggregated between 28 GHz and 39 GHz (i.e., both in the millimeter wave band) with a 10 Mbps/MHz/Cell, I could support 6,200 Gbps/km2. That’s almost 3 Petabyte in an hour or 10 years of 24/7 binge watching of HD videos. Note given my spectral efficiency is based on an average value, it is likely that I could achieve substantially more bandwidth density and in peaks closer to the 10,000 Gbps/km2 … easily.

Pretty Awesome Wow!

The basic; a Terabit equals 1024 Gigabits (but I tend to ignore that last 24 … sorry I am not).

With a traffic density of ca. 10,000 Gbps per km2, one would expect to have between 1,000 (@ 10 Gbps peak) to 10,000 (@ 1 Gbps peak) concurrent users per square km.

At 10 Mbps/MHz/Cell one would expect to have a 1,000 Cell-GHz/km2. Assume that we would have 1 GHz bandwidth (i.e., somewhere in the 30 – 300 GHz mm-wave range), one would need 1,000 cells per km2. On average with a cell range of about 20 meters (smaller to smallest … I guess what Nokia would call an Hyper-Ultra-Dense Network;-). Thus each cell would minimum have between 1 to 10 concurrent users.

Just as a reminder! 1 minutes at 1 Gbps corresponds to 7.5 GB. A bit more than what you need for a 80 minute HD (i.e., 720pp) full movie stream … in 1 minutes. So with your (almost) personal smallest cell what about the remaining 59 minutes? Seems somewhat wasteful at least until kingdom come (alas maybe sooner than that).

It would appear that the very high 5G data density target could result in very in-efficient networks from a utilization perspective.

≥ 1 MN / Km2 DEVICE DENSITY.

One million 5G devices per square kilometer appears to be far far out in a future where one would expect us to be talking about 7G or even higher Gs.

1 Million devices seems like a lot and certainly per km2. It is 1 device per square meter on average. A 20 meter cell-range smallest cell would contain ca. 1,200 devices.

To give this number perspective lets compare it with one of my favorite South-East Asian cities. The city with one of the highest population densities around, Manila (Philippines). Manila has more than 40 thousand people per square km. Thus in Manila this would mean that we would have about 24 devices per person or 100+ per household per km2. Overall, in Manila we would then expect approx. 40 million devices spread across the city (i.e., Manila has ca. 1.8 Million inhabitants over an area of 43 km2. Philippines has a population of approx. 100 Million).

Just for the curious, it is possible to find other more populated areas in the world. However, these highly dense areas tends to be over relative smaller surface areas, often much smaller than a square kilometer and with relative few people. For example Fadiouth Island in Dakar have a surface area of 0.15 km2 and 9,000 inhabitants making it one of the most pop densest areas in the world (i.e., 60,000 pop per km2).

I hope I made my case! A million devices per km2 is a big number.

Let us look at it from a forecasting perspective. Just to see whether we are possibly getting close to this 5G ambition number.

IHS forecasts 30.5 Billion installed devices by 2020, IDC is also believes it to be around 30 Billion by 2020. Machina Research is less bullish and projects 27 Billion by 2025 (IHS expects that number to be 75.4 Billion) but this forecast is from 2013. Irrespective, we are obviously in the league of very big numbers. By the way 5G IoT if at all considered is only a tiny fraction of the overall projected IoT numbers (e.g., Machine Research expects 10 Million 5G IoT connections by 2024 …that is extremely small numbers in comparison to the overall IoT projections).

A consensus number for 2020 appears to be 30±5 Billion IoT devices with lower numbers based on 2015 forecasts and higher numbers typically from 2016.

To break this number down to something that could be more meaningful than just being Big and impressive, let just establish a couple of worldish numbers that can help us with this;

  • 2020 population expected to be around 7.8 Billion compared to 2016 7.4 Billion.
  • Global pop per HH is ~3.5 (average number!) which might be marginally lower in 2020. Urban populations tend to have less pop per households ca. 3.0. Urban populations in so-called developed countries are having a pop per HH of ca. 2.4.
  • ca. 55% of world population lives in Urban areas. This will be higher by 2020.
  • Less than 20% of world population lives in developed countries (based on HDI). This is a 2016 estimate and will be higher by 2020.
  • World surface area is 510 Million km2 (including water).
  • of which ca. 150 million km2 is land area
  • of which ca. 75 million km2 is habitable.
  • of which 3% is an upper limit estimate of earth surface area covered by urban development, i.e., 15.3 Million km2.
  • of which approx. 1.7 Million km2 comprises developed regions urban areas.
  • ca. 37% of all land-based area is agricultural land.

Using 30 Billion IoT devices by 2020 is equivalent to;

  • ca. 4 IoT per world population.
  • ca. 14 IoT per world households.
  • ca. 200 IoT per km2 of all land-based surface area.
  • ca. 2,000 IoT per km2 of all urban developed surface area.

If we limit IoT’s in 2020 to developed countries, which wrongly or rightly exclude China, India and larger parts of Latin America, we get the following by 2020;

  • ca. 20 IoT per developed country population.
  • ca. 50 IoT per developed country households.
  • ca. 18,000 IoT per km2 developed country urbanized areas.

Given that it would make sense to include larger areas and population of both China, India and Latin America, the above developed country numbers are bound to be (a lot) lower per Pop, HH and km2. If we include agricultural land the number of IoTs will go down per km2.

So far far away from a Million IoT per km2.

What about parking spaces, for sure IoT will add up when we consider parking spaces!? … Right? Well in Europe you will find that most big cities will have between 50 to 200 (public) parking spaces per square kilometer (e.g., ca. 67 per km2 for Berlin and 160 per km2 in Greater Copenhagen). Aha not really making up to the Million IoT per km2 … what about cars?

In EU28 there are approx. 256 Million passenger cars (2015 data) over a population of ca. 510 Million pops (or ca. 213 million households). So a bit more than 1 passenger car per household on EU28 average. In Eu28 approx. 75+% lives in urban area which comprises ca. 150 thousand square kilometers (i.e., 3.8% of EU28’s 4 Million km2). So one would expect little more (if not a little less) than 1,300 passenger cars per km2. You may say … aha but it is not fair … you don’t include motor vehicles that are used for work … well that is an exercise for you (too convince yourself why that doesn’t really matter too much and with my royal rounding up numbers maybe is already accounted for). Also consider that many EU28 major cities with good public transportation are having significantly less cars per household or population than the average would allude to.

Surely, public street light will make it through? Nope! Typical bigger modern developed country city will have on average approx. 85 street lights per km2, although it varies from 0 to 1,000+. Light bulbs per residential household (from a 2012 study of the US) ranges from 50 to 80+. In developed countries we have roughly 1,000 households per km2 and thus we would expect between 50 thousand to 80+ thousand lightbulbs per km2. Shops and business would add some additions to this number.

With a cumulated annual growth rate of ca. 22% it would take 20 years (from 2020) to reach a Million IoT devices per km2 if we will have 20 thousand per km2 by 2020. With a 30% CAGR it would still take 15 years (from 2020) to reach a Million IoT per km2.

The current IoT projections of 30 Billion IoT devices in operation by 2020 does not appear to be unrealistic when broken down on a household or population level in developed areas (even less ambitious on a worldwide level). The 18,000 IoT per km2 of developed urban surface area by 2020 does appear somewhat ambitious. However, if we would include agricultural land the number would become possible a more reasonable.

If you include street crossings, traffic radars, city-based video monitoring (e.g., London has approx. 300 per km2, Hong Kong ca. 200 per km2), city-based traffic sensors, environmental sensors, etc.. you are going to get to sizable numbers.

However, 18,000 per km2 in urban areas appears somewhat of a challenge. Getting to 1 Million per km2 … hmmm … we will see around 2035 to 2040 (I have added an internet reminder for a check-in by 2035).

Maybe the 1 Million Devices per km2 ambition is not one of the most important 5G design criteria’s for the short term (i.e., next 10 – 20 years).

Oh and most IoT forecasts from the period 2015 – 2016 does not really include 5G IoT devices in particular. The chart below illustrates Machina Research IoT forecast for 2024 (from August 2015). In a more recent forecast from 2016, Machine Research predict that by 2024 there would be ca. 10 million 5G IoT connections or 0.04% of the total number of forecasted connections;

iot connections 2024

The winner is … IoTs using WiFi or other short range communications protocols. Obviously, the cynic in me (mea culpa) would say that a mm-wave based 5G connections can also be characterized as short range … so there might be a very interesting replacement market there for 5G IoT … maybe? 😉

Expectations to 5G-based IoT does not appear to be very impressive at least over the next 10 years and possible beyond.

The un-importance of 5G IoT should not be a great surprise given most 5G deployment scenarios are focused on millimeter-wave smallest 5G cell coverage which is not good for comprehensive coverage of  IoT devices not being limited to those very special 5G coverage situations being thought about today.

Only operators focusing on comprehensive 5G coverage re-purposing lower carrier frequency bands (i.e., 1 GHz and lower) can possible expect to gain a reasonable (as opposed to niche) 5G IoT business. T-Mobile US with their 600 MHz  5G strategy might very well be uniquely positions for taking a large share of future proof IoT business across USA. Though they are also pretty uniquely position for NB-IoT with their comprehensive 700MHz LTE coverage.

For 5G IoT to be meaningful (at scale) the conventional macro-cellular networks needs to be in play for 5G coverage .,, certainly 100% 5G coverage will be a requirement. Although, even with 5G there maybe 100s of Billion of non-5G IoT devices that require coverage and management.

≤ 500 km/h SERVICE SUPPORT.

Sure why not?  but why not faster than that? At hyperloop or commercial passenger airplane speeds for example?

Before we get all excited about Gbps speeds at 500 km/h, it should be clear that the 5G vision paper only proposed speeds between 10 Mbps up-to 50 Mbps (actually it is allowed to regress down to 50 kilo bits per second). With 200 Mbps for broadcast like services.

So in general, this is a pretty reasonable requirement. Maybe with the 200 Mbps for broadcasting services being somewhat head scratching unless the vehicle is one big 16K screen. Although the users proximity to such a screen does not guaranty an ideal 16K viewing experience to say the least.

What moves so fast?

The fastest train today is tracking at ca. 435 km/h (Shanghai Maglev, China).

Typical cruising airspeed for a long-distance commercial passenger aircraft is approx. 900 km/h. So we might not be able to provide the best 5G experience in commercial passenger aircrafts … unless we solve that with an in-plane communications system rather than trying to provide Gbps speed by external coverage means.

Why take a plane when you can jump on the local Hyperloop? The proposed Hyperloop should track at an average speed of around 970 km/h (faster or similar speeds as commercial passengers aircrafts), with a top speed of 1,200 km/h. So if you happen to be in between LA and San Francisco in 2020+ you might not be able to get the best 5G service possible … what a bummer! This is clearly an area where the vision did not look far enough.

Providing services to moving things at a relative fast speed does require a reasonable good coverage. Whether it being train track, hyperloop tunnel or ground to air coverage of commercial passenger aircraft, new coverage solutions would need to be deployed. Or alternative in-vehicular coverage solutions providing a perception of 5G experience might be an alternative that could turn out to be more economical.

The speed requirement is a very reasonable one particular for train coverage.

50% TOTAL NETWORK ENERGY REDUCTION.

If 5G development could come true on this ambition we talk about 10 Billion US Dollars (for the cellular industry). Equivalent to a percentage point on the margin.

There are two aspects of energy efficiency in a cellular based communication system.

  • User equipment that will benefit from longer intervals without charging and thus improve customers experience and overall save energy from less frequently charges.
  • Network infrastructure energy consumption savings will directly positively impact a telecom operators Ebitda.

Energy efficient Smartphones

The first aspect of user equipment is addressed by the 5G vision paper under “4.3 Device Requirements”  sub-section “4.3.3 Device Power Efficiency”; Battery life shall be significantly increased: at least 3 days for a smartphone, and up tp 15 years for a low-cost MTC device.” (note: MTC = Machine Type Communications).

Apple’s iPhone 7 battery life (on a full charge) is around 6 hours of constant use with 7 Plus beating that with ca. 3 hours (i.e., total 9 hours). So 3 days will go a long way.

From a recent 2016 survey from Ask Your Target Market on smartphone consumers requirements to battery lifetime and charging times;

  • 64% of smartphone owners said they are at least somewhat satisfied with their phone’s battery life.
  • 92% of smartphone owners said they consider battery life to be an important factor when considering a new smartphone purchase.
  • 66% said they would even pay a bit more for a cell phone that has a longer battery life.

Looking at the mobile smartphone & tablet non-voice consumption it is also clear why battery lifetime and not in-important the charging time matters;

smartphone usage time per day

Source: eMarketer, April 2016. While 2016 and 2017 are eMarketer forecasts (why dotted line and red circle!) these do appear well in line with other more recent measurements.

Non-voice smartphone & tablet based usage is expected by now to exceed 4 hours (240 minutes) per day on average for US Adults.

That longer battery life-times are needed among smartphone consumers is clear from sales figures and anticipated sales growth of smartphone power-banks (or battery chargers) boosting the life-time with several more hours.

It is however unclear whether the 3 extra days of a 5G smartphone battery life-time is supposed to be under active usage conditions or just in idle mode. Obviously in order to matter materially to the consumer one would expect this vision to apply to active usage (i.e., 4+ hours a day at 100s of Mbps – 1Gbps operations).

Energy efficient network infrastructure.

The 5G vision paper defines energy efficiency as number of bits that can be transmitted over the telecom infrastructure per Joule of Energy.

The total energy cost, i.e., operational expense (OpEx), of telecommunications network can be considerable. Despite our mobile access technologies having become more energy efficient with each generation, the total OpEx of energy attributed to the network infrastructure has increased over the last 10 years in general. The growth in telco infrastructure related energy consumption has been driven by the consumer demand for broadband services in mobile and fixed including incredible increase in data center computing and storage requirements.

In general power consumption OpEx share of total technology cost amounts to 8% to 15% (i.e., for Telcos without heavy reliance of diesel). The general assumption is that with regular modernization, energy efficiency gain in newer electronics can keep growth in energy consumption to a minimum compensating for increased broadband and computing demand.

Note: Technology Opex (including NT & IT) on average lays between 18% to 25% of total corporate Telco Opex. Out of the Technology Opex between 8% to 15% (max) can typically be attributed to telco infrastructure energy consumption. The access & aggregation contribution to the energy cost typically would towards 80% plus. Data centers are expected to increasingly contribute to the power consumption and cost as well. Deep diving into the access equipment power consumption, ca. 60% can be attributed to rectifiers and amplifiers, 15% by the DC power system & miscellaneous and another 25% by cooling.

5G vision paper is very bullish in their requirement to reduce the total energy and its associated cost; it is stated “5G should support a 1,000 times traffic increase in the next 10 years timeframe, with an energy consumption by the whole network of only half that typically consumed by today’s networks. This leads to the requirement of an energy efficiency of x2,000 in the next 10 years timeframe.” (sub-section “4.6.2 Energy Efficiency” NGMN 5G White Paper).

This requirement would mean that in a pure 5G world (i.e., all traffic on 5G), the power consumption arising from the cellular network would be 50% of what is consumed todayIn 2016 terms the Mobile-based Opex saving would be in the order of 5 Billion US$ to 10+ Billion US$ annually. This would be equivalent to 0.5% to 1.1% margin improvement globally (note: using GSMA 2016 Revenue & Growth data and Pyramid Research forecast). If energy price would increase over the next 10 years the saving / benefits would of course be proportionally larger.

As we have seen in the above, it is reasonable to expect a very considerable increase in cell density as the broadband traffic demand increases from peak bandwidth (i.e., 1 – 10 Gbps) and traffic density (i.e., 1 Tbps per km2) expectations.

Depending on the demanded traffic density, spectrum and carrier frequency available for 5G between 100 to 1,000 small cell sites per km2 could be required over the next 10 years. This cell site increase will be required in addition to existing macro-cellular network infrastructure.

Today (in 2017) an operator in EU28-sized country may have between ca. 3,500 to 35,000 cell sites with approx. 50% covering rural areas. Many analysts are expecting that for medium sized countries (e.g., with 3,500 – 10,000 macro cellular sites), operators would eventually have up-to 100,000 small cells under management in addition to their existing macro-cellular sites. Most of those 5G small cells and many of the 5G macro-sites we will have over the next 10 years, are also going to have advanced massive MiMo antenna systems with many active antenna elements per installed base antenna requiring substantial computing to gain maximum performance.

It appears with today’s knowledge extremely challenging (to put it mildly) to envision a 5G network consuming 50% of today’s total energy consumption.

It is highly likely that the 5G radio node electronics in a small cell environment (and maybe also in a macro cellular environment?) will consume less Joules per delivery bit (per second) due to technology advances and less transmitted power required (i.e., its a small or smallest cell). However, this power efficiency technology and network cellular architecture gain can very easily be destroyed by the massive additional demand of small, smaller and smallest cells combined with highly sophisticated antenna systems consuming additional energy for their compute operations to make such systems work. Furthermore, we will see operators increasingly providing sophisticated data center resources network operations as well as for the customers they serve. If the speed of light is insufficient for some services or country geographies, additional edge data centers will be introduced, also leading to an increased energy consumption not present in todays telecom networks. Increased computing and storage demand will also make the absolute efficiency requirement highly challenging.

Will 5G be able to deliver bits (per second) more efficiently … Yes!

Will 5G be able to reduce the overall power consumption of todays telecom networks with 50% … highly unlikely.

In my opinion the industry will have done a pretty good technology job if we can keep the existing energy cost at the level of today (or even allowing for unit price increases over the next 10 years).

The Total power reduction of our telecommunications networks will be one of the most important 5G development tasks as the industry cannot afford a new technology that results in waste amount of incremental absolute cost. Great relative cost doesn’t matter if it results in above and beyond total cost.

≥ 99.999% NETWORK AVAILABILITY & DATA CONNECTION RELIABILITY.

A network availability of 5Ns across all individual network elements and over time correspond to less than a second a day downtime anywhere in the network. Few telecom networks are designed for that today.

5 Nines (5N) is a great aspiration for services and network infrastructures. It also tends to be fairly costly and likely to raise the level of network complexity. Although in the 5G world of heterogeneous networks … well its is already complicated.

5N Network Availability.

From a network and/or service availability perspective it means that over the cause of the day, your service should not experience more than 0.86 seconds of downtime. Across a year the total downtime should not be more than 5 minutes and 16 seconds.

The way 5N Network Availability is define is “The network is available for the targeted communications in 99.999% of the locations  where the network is deployed and 99.999% of the time”. (from “4.4.4 Resilience and High Availability”, NGMN 5G White Paper).

Thus in a 100,000 cell network only 1 cell is allowed experience a downtime and for no longer than less than a second a day.

It should be noted that there are not many networks today that come even close to this kind of requirement. Certainly in countries with frequent long power outages and limited ancillary backup (i.e., battery and/or diesel) this could be a very costly design requirement. Networks relying on weather-sensitive microwave radios for backhaul or for mm-wave frequencies 5G coverage would be required to design in a very substantial amount of redundancy to keep such high geographical & time availability requirements

In general designing a cellular access network for this kind of 5N availability could be fairly to very costly (i.e., Capex could easily run up in several percentage points of Revenue).

One way out from a design perspective is to rely on hierarchical coverage. Thus, for example if a small cell environment is un-available (=down!) the macro-cellular network (or overlay network) continues the service although at a lower service level (i.e., lower or much lower speed compared to the primary service). As also suggested in the vision paper making use of self-healing network features and other real-time measures are expected to further increase the network infrastructure availability. This is also what one may define as Network Resilience.

Nevertheless, the “NGMN 5G White Paper” allows for operators to define the level of network availability appropriate from their own perspective (and budgets I assume).

5N Data Packet Transmission Reliability.

The 5G vision paper, defines Reliability as “… amount of sent data packets successfully delivered to a given destination, within the time constraint required by the targeted service, divided by the total number of sent data packets.”. (“4.4.5 Reliability” in “NGMN 5G White Paper”).

It should be noted that the 5N specification in particular addresses specific use cases or services of which such a reliability is required, e.g., mission critical communications and ultra-low latency service. The 5G allows for a very wide range of reliable data connection. Whether the 5N Reliability requirement will lead to substantial investments or can be managed within the overall 5G design and architectural framework, might depend on the amount of traffic requiring 5Ns.

The 5N data packet transmission reliability target would impose stricter network design. Whether this requirement would result in substantial incremental investment and cost is likely dependent on the current state of existing network infrastructure and its fundamental design.


5G Economics – The Tactile Internet (Chapter 2)

If you have read Michael Lewis book “Flash Boys”, I will have absolutely no problem convincing you that a few milliseconds improvement in transport time (i.e., already below 20 ms) of a valuable signal (e.g., containing financial information) can be of tremendous value. It is all about optimizing transport distances, super efficient & extremely fast computing and of course ultra-high availability. The ultra-low transport and process latencies is the backbone (together with the algorithms obviously) of the high frequency trading industry that takes a market share of between 30% (EU) and 50% (US) of the total equity trading volume.

In a recent study by The Boston Consulting Group (BCG) “Uncovering Real Mobile Data Usage and Drivers of Customer Satisfaction” (Nov. 2015) study it was found that latency had a significant impact on customer video viewing satisfaction. For latencies between 75 – 100 milliseconds 72% of users reported being satisfied. The user experience satisfaction level jumped to 83% when latency was below 50 milliseconds. We have most likely all experienced and been aggravated by long call setup times (> couple of seconds) forcing us to look at the screen to confirm that a call setup (dialing) is actually in progress.

Latency and reactiveness or responsiveness matters tremendously to the customers experience and whether it is a bad, good or excellent one.

The Tactile Internet idea is an integral part of the “NGMN 5G Vision” and part of what is characterized as Extreme Real-Time Communications. It has further been worked out in detail in the ITU-T Technology Watch Report  “The Tactile Internet” from August 2014.

The word Tactile” means perceptible by touch. It closely relates to the ambition of creating a haptic experience. Where haptic means a sense of touch. Although we will learn that the Tactile Internet vision is more than a “touchy-feeling” network vision, the idea of haptic feedback in real-time (~ sub-millisecond to low millisecond regime) is very important to the idea of a Tactile Network experience (e.g., remote surgery).

The Tactile Internet is characterized by

  • Ultra-low latency; 1 ms and below latency (as in round-trip-time / round-trip delay).
  • Ultra-high availability; 99.999% availability.
  • Ultra-secure end-2-end communications.
  • Persistent very high bandwidths capability; 1 Gbps and above.

The Tactile Internet is one of the corner stones of 5G. It promises ultra-low end-2-end latencies in the order of 1 millisecond at Giga bits per second speeds and with five 9’s of availability (translating into a 500 ms per day average un-availability).

Interestingly, network predictability and variation in latency have not been receiving too much focus within the Tactile Internet work. Clearly, a high degree of predictability as well as low jitter (or latency variation), could be very desirable property of a tactile network. Possibly even more so than absolute latency in its own right. A right sized round-trip-time with imposed managed latency, meaning a controlled variation of latency, is very essential to the 5G Tactile Internet experience.

It’s 5G on speed and steroids at the same time.

elephant in the room

Let us talk about the elephant in the room.

We can understand Tactile latency requirements in the following way;

An Action including (possible) local Processing, followed by some Transport and Remote Processing of data representing the Action, results in a Re-action again including (possible) local Processing. According with Tactile Internet Vision, the time of this whole even from Action to Re-action has to have run its cause within 1 millisecond or one thousand of a second. In many use cases this process is looped as the Re-action feeds back, resulting in another action. Note in the illustration below, Action and Re-action could take place on the same device (or locality) or could be physically separated. The processes might represent cloud-based computations or manipulations of data or data manipulations local to the device of the user as well as remote devices. It needs to be considered that the latency time scale for one direction is not at all given to be the same in the other direction (even for transport).

tactile internet 1

The simplest example is the mouse click on a internet link or URL (i.e., the Action) resulting a translation of the URL to an IP address and the loading of the resulting content on your screen (i.e., part of the process) with the final page presented on the your device display (i.e., Re-action). From the moment the URL is mouse-clicked until the content is fully presented should take no longer than 1 ms.

tactile internet 2

A more complex use case might be remote surgery. In which a surgical robot is in one location and the surgeon operator is at another location manipulating the robot through an operation. This is illustrated in the above picture. Clearly, for a remote surgical procedure to be safe (i.e., within the margins of risk of not having the possibility of any medical assisted surgery) we would require a very reliable connection (99.999% availability), sufficient bandwidth to ensure adequate video resolution as required by the remote surgeon controlling the robot, as little as possible latency allowing the feel of instantaneous (or predictable) reaction to the actions of the controller (i.e., the surgeons) and of course as little variation in the latency (i.e., jitter) allowing system or human correction of the latency (i.e., high degree of network predictability).

The first Complete Trans-Atlantic Robotic Surgery happened in 2001. Surgeons in New York (USA) remotely operated on a patient in Strasbourg, France. Some 7,000 km away or equivalent to 70 ms in round-trip-time (i.e., 14,000 km in total) for light in fiber. The total procedural delay from hand motion (action) to remote surgical response (reaction) showed up on their video screen took 155 milliseconds. From trials on pigs any delay longer than 330 ms was thought to be associated with an unacceptable degree of risk for the patient. This system then did not offer any haptic feedback to the remote surgeon. This remains the case for most (if not all) remote robotic surgical systems in option today as the latency in most remote surgical scenarios render haptic feedback less than useful. An excellent account for robotic surgery systems (including the economics) can be found at this web site “All About Robotic Surgery”. According to experienced surgeons at 175 ms (and below) a remote robotic operation is perceived (by the surgeon) as imperceptible.

It should be clear that apart from offering long-distance surgical possibilities, robotic surgical systems offers many other benefits (less invasive, higher precision, faster patient recovery, lower overall operational risks, …). In fact most robotic surgeries are done with surgeon and robot being in close proximity.

Another example of coping with lag or latency is a Predator drone pilot. The plane is a so-called unmanned combat aerial vehicle and comes at a price of ca. 4 Million US$ (in 2010) per piece. Although this aerial platform can perform missions autonomously  it will typically have two pilots on the ground monitoring and possible controlling it. The typical operational latency for the Predator can be as much as 2,000 milliseconds. For takeoff and landing, where this latency is most critical, typically the control is handed to to a local crew (either in Nevada or in the country of its mission). The Predator cruise speed is between 130 and 165 km per hour. Thus within the 2 seconds lag the plane will have move approximately 100 meters (i.e., obviously critical in landing & take off scenarios). Nevertheless, a very high degree of autonomy has been build into the Predator platform that also compensates for the very large latency between plane and mission control.

Back to the Tactile Internet latency requirements;

In LTE today, the minimum latency (internal to the network) is around 12 ms without re-transmission and with pre-allocated resources. However, the normal experienced latency (again internal to the network) would be more in the order of 20 ms including 10% likelihood of retransmission and assuming scheduling (which would be normal). However, this excludes any content fetching, processing, presentation on the end-user device and the transport path beyond the operators network (i.e., somewhere in the www). Transmission outside the operator network typically between 10 and 20 ms on-top of the internal latency. The fetching, processing and presentation of content can easily add hundreds of milliseconds to the experience. Below illustrations provides a high level view of the various latency components to be considered in LTE with the transport related latencies providing the floor level to be expected;

latency in networks

In 5G the vision is to achieve a factor 20 better end-2-end (within the operators own network) round-trip-time compared to LTE; thus 1 millisecond.


So … what happens in 1 millisecond?

Light will have travelled ca. 200 km in fiber or 300 km in free-space. A car driving (or the fastest baseball flying) 160 km per hour will have moved 4 cm. A steel ball falling to the ground (on Earth) would have moved 5 micro meter (that’s 5 millionth of a meter). In a 1Gbps data stream, 1 ms correspond to ca. 125 Kilo Bytes worth of data. A human nerve impulse last just 1 ms (i.e., in a 100 millivolt pulse).


It should be clear that the 1 ms poses some very dramatic limitations;

  • The useful distance over which a tactile applications would work (if 1 ms would really be the requirements that is!) will be short ( likely a lot less than 100 km for fiber-based transport)
  • The air-interface (& number of control plane messages required) needs to reduce dramatically from milliseconds down to microseconds, i.e., factor 20 would require no more than 100 microseconds limiting the useful cell range).
  • Compute & processing requirements, in terms of latency, for UE (incl. screen, drivers, local modem, …), Base Station and Core would require a substantial overhaul (likely limiting level of tactile sophistication).
  • Require own controlled network infrastructure (at least a lot easier to manage latency within), avoiding any communication path leaving own network (walled garden is back with a vengeance?).
  • Network is the sole responsible for latency and can be made arbitrarily small (by distance and access).

Very small cells, very close to compute & processing resources, would be most likely candidates for fulfilling the tactile internet requirements. 

Thus instead of moving functionality and compute up and towards the cloud data center we (might) have an opposing force that requires close proximity to the end-users application. Thus, the great promise of cloud-based economical efficiency is likely going to be dented in this scenario by requiring many more smaller data centers and maybe even micro-data centers moving closer to the access edge (i.e., cell site, aggregation site, …). Not surprisingly, Edge Cloud, Edge Data Center, Edge X is really the new Black …The curse of the edge!?

Looking at several network and compute design considerations a tactile application would require no more than 50 km (i.e., 100 km round-trip) effective round-trip distance or 0.5 ms fiber transport (including switching & routing) round-trip-time. Leaving another 0.5 ms for air-interface (in a cellular/wireless scenario), computing & processing. Furthermore, the very high degree of imposed availability (i.e., 99.999%) might likewise favor proximity between the Tactile Application and any remote Processing-Computing. Obviously,

So in all likelihood we need processing-computing as near as possible to the tactile application (at least if one believes in the 1 ms and about target).

One of the most epic (“in the Dutch coffee shop after a couple of hours category”) promises in “The Tactile Internet” vision paper is the following;

“Tomorrow, using advanced tele-diagnostic tools, it could be available anywhere, anytime; allowing remote physical examination even by palpation (examination by touch). The physician will be able to command the motion of a tele-robot at the patient’s location and receive not only audio-visual information but also critical haptic feedback.(page 6, section 3.5).

All true, if you limited the tele-robot and patient to a distance of no more than 50 km (and likely less!) from the remote medical doctor. In this setup and definition of the Tactile Internet, having a top eye surgeon placed in Delhi would not be able to operate child (near blindness) in a remote village in Madhya Pradesh (India) approx. 800+ km away. Note India has the largest blind population in the world (also by proportion) with 75% of cases avoidable by medical intervention. At best, these specifications allow the doctor not to be in the same room with the patient.

Markus Rank et al did systematic research on the perception of delay in haptic tele-presence systems (Presence, October 2010, MIT Press) and found haptic delay detection thresholds between  30 and 55 ms. Thus haptic feedback did not appear to be sensitive to delays below 30 ms, fairly close to the lowest reported threshold of 20 ms. This combined with experienced tele-robotic surgeons assessing that below 175 ms the remote procedure starts to be perceived as imperceptible, might indicate that the 1 ms, at least for this particular use case, is extremely limiting.

The extreme case would be to have the tactile-related computing done at the radio base station assuming that the tactile use case could be restricted to the covered cell and users supported by that cell. I name this the micro-DC (or micro-cloud or more like what some might call the cloudlet concept) idea. This would be totally back to the older days with lots of compute done at the cell site (and likely kill any traditional legacy cloud-based efficiency thinking … love to use legacy and cloud in same sentence). This would limit the round-trip-time to air-interface latency and compute/processing at the base station and the device supporting the tactile application.

It is normal to talk about the round-trip-time between an action and the subsequent reaction. It is also the time it takes a data or signal to travel from a specific source to a specific destination and back again (i.e., round trip). In case of light in fiber, a 1 millisecond limit on the round-trip-time would imply that the maximum distance that can be travelled (in the fiber) between source to destination and back to the source is 200 km. Limiting the destination to be no more than 100 km away from the source. In case of substantial processing overhead (e.g., computation) the distance between source and destination requires even less than 100 km to allow for the 1 ms target.

THE HUMAN SENSES AND THE TACTILE INTERNET.

The “touchy-feely” aspect, or human sensing in general, is clearly an inspiration to the authors of “The Tactile Internet” vision as can be seen from the following quote;

“We experience interaction with a technical system as intuitive and natural only if the feedback of the system is adapted to our human reaction time. Consequently, the requirements for technical systems enabling real-time interactions depend on the participating human senses.” (page 2, Section 1).

The following human-reaction times illustration shown below is included in “The Tactile Internet” vision paper. Although it originates from Fettweis and Alamouti’s paper titled “5G: Personal Mobile Internet beyond What Cellular Did to Telephony“. It should be noted that the description of the Table is order of magnitude of human reaction times; thus, 10 ms might also be 100 ms or 1 ms and so forth and therefor, as we shall see, it would be difficult to a given reaction time wrong within such a range.human senses

The important point here is that the human perception or senses impact very significantly the user’s experience with a given application or use case.

The responsiveness of a given system or design is incredible important for how well a service or product will be perceived by the user. The responsiveness can be defined as a relative measure against our own sense or perception of time. The measure of responsiveness is clearly not unique but depends on what senses are being used as well as the user engaged.The human mind is not fond of waiting and waiting too long causes distraction, irritation and ultimate anger after which the customer is in all likelihood lost. A very good account of considering the human mind and it senses in design specifications (and of course development) can be found in Jeff Johnson’s 2010 book “Designing with the Mind in Mind”.

The understanding of human senses and the neurophysiological reactions to those senses are important for assessing a given design criteria’s impact on the user experience. For example, designing for 1 ms or lower system reaction times when the relevant neurophysiological timescale is measured in 10s or 100s of milliseconds is likely not resulting in any noticeable (and monetizable) improvement in customer experience. Of course there can be many very good non-human reasons for wanting low or very low latencies.

While you might get the impression, from the above table above from Fettweis et al and countless Tactile Internet and 5G publications referring back to this data, that those neurophysiological reactions are natural constants, it is unfortunately not the case. Modality matters hugely. There are fairly great variations in reactions time within the same neurophysiological response category depending on the individual human under test but often also depending on the underlying experimental setup. In some instances the reaction time deduced would be fairly useless as a design criteria for anything as the detection happens unconsciously and still require the relevant part of the brain to make sense of the event.

We have, based on vision, the surgeon controlling a remote surgical robot stating that anything below 175 ms latency is imperceptible. There is research showing that haptic feedback delay below 30 ms appears to be un-detectable.

John Carmack, CTO of Oculus VR Inc, based on in particular vision (in a fairly dynamic environment) that  “.. when absolute delays are below approximately 20 milliseconds they are generally imperceptible.” particular as it relates to 3D systems and VR/AR user experience which is a lot more dynamic than watching content loading. Moreover, according to some recent user experience research specific to website response time indicates that anything below 100 ms wil be perceived as instantaneous. At 1 second users will sense the delay but would be perceived as seamless. If a web page loads in more than 2 seconds user satisfaction levels drops dramatically and a user would typically bounce.

Based on IAAF (International Athletic Association Federation) rules, an athlete is deemed to have had a false start if that athlete moves sooner than 100 milliseconds after the start signal. The neurophysiological process relevant here is the neuromuscular reaction to the sound heard (i.e., the big bang of the pistol) by the athlete. Research carried out by Paavo V. Komi et al has shown that the reaction time of a prepared (i.e., waiting for the bang!) athlete can be as low as 80 ms. This particular use case relates to the auditory reaction times and the subsequent physiological reaction. P.V. Komi et al also found a great variation in the neuromuscular reaction time to the sound (even far below the 80 ms!).

Neuromuscular reactions to unprepared events typically typically measures in several hundreds of milliseconds (up-to 700 ms) being somewhat faster if driven by auditory senses rather than vision. Note that reflex time scales are approximately 10 times faster or in the order of 80 – 100 ms.

The international Telecommunications Union (ITU) Recommendation G.114, defines for voice applications an upper acceptable one-way (i.e., its you talking you don’t want to be talked back to by yourself) delay of 150 ms. Delays below this limit would provide an acceptable degree of voice user experience in the sense that most users would not hear the delay. It should be understood that a great variation in voice delay sensitivity exist across humans. Voice conversations would be perceived as instantaneous by most below the 100 ms (thought the auditory perception would also depend on the intensity/volume of the voice being listened to).

Finally, let’s discuss human vision. Fettweis et al in my opinion mixes up several psychophysical concepts of vision and TV specifications. Alluding to 10 millisecond is the visual “reaction” time (whatever that now really means). More accurately they describe the phenomena of flicker fusion threshold which describes intermittent light stimulus (or flicker) is perceived as completely steady to an average viewer. This phenomena relates to persistence of vision where the visual system perceives multiple discrete images as a single image (both flicker and persistence of vision are well described in both by Wikipedia and in detail by Yhong-Lin Lu el al “Visual Psychophysics”). There, are other reasons why defining flicker fusion and persistence of vision as a human reaction reaction mechanism is unfortunate.

The 10 ms for vision reaction time, shown in the table above, is at the lowest limit of what researchers (see references 14, 15, 16 ..) find to be the early stages of vision can possible detect (i.e., as opposed to pure guessing ). Mary C. Potter of M.I.T.’s Dept. of Brain & Cognitive Sciences, seminal work on human perception in general and visual perception in particular shows that the human vision is capable very rapidly to make sense of pictures, and objects therein, on the timescale of 10 milliseconds (i.e., 13 ms actually is the lowest reported by Potter). From these studies it is also found that preparedness (i.e., knowing what to look for) helps the detection process although the overall detection results did not differ substantially from knowing the object of interest after the pictures were shown. Note that the setting of these visual reaction time experiments all happens in a controlled laboratory setting with the subject primed to being attentive (e.g., focus on screen with fixation cross for a given period, followed by blank screen for another shorter period, and then a sequence of pictures each presented for a (very) short time, followed again by a blank screen and finally a object name and the yes-no question whether the object was observed in the sequence of pictures). Often these experiments also includes a certain degree of training before the actual experiment  took place. The relevant memory of the target object, In any case and unless re-enforced, will rapidly dissipates. in fact the shorter the viewing time, the quicker it will disappear … which might be a very healthy coping mechanism.

To call this visual reaction time of 10+ ms typical is in my opinion a bit of a stretch. It is typical for that particular experimental setup and very nicely provides important insights into the visual systems capabilities.

One of the more silly things used to demonstrate the importance of ultra-low latencies have been to time delay the video signal send to a wearer’s goggles and then throw a ball at him in the physical world … obviously, the subject will not catch the ball (might as well as thrown it at the back of his head instead). In the Tactile Internet vision paper it the following is stated; “But if a human is expecting speed, such as when manually controlling a visual scene and issuing commands that anticipate rapid response, 1-millisecond reaction time is required(on page 3). And for the record spinning a basketball on your finger has more to do with physics than neurophysiology and human reaction times.

In more realistic settings it would appear that the (prepared) average reaction time of vision is around or below 40 ms. With this in mind, a baseball moving (when thrown by a power pitcher) at 160 km per hour (or ca. 4+ cm per ms) would take a approx. 415 ms to reach the batter (using an effective distance of 18.44 meters). Thus the batter has around 415 ms to visually process the ball coming and hit it at the right time. Given the latency involved in processing vision the ball would be at least 40 cm (@ 10 ms) closer to the batter than his latent visionary impression would imply. Assuming that the neuromuscular reaction time is around 100±20 ms, the batter would need to compensate not only for that but also for his vision process time in order to hit the ball. Based on batting statistics, clearly the brain does compensate for its internal latencies pretty well. In the paper  “Human time perception and its illusions” D.M. Eaglerman that the visual system and the brain (note: visual system is an integral part of the brain) is highly adaptable in recalibrating its time perception below the sub-second level.

It is important to realize that in literature on human reaction times, there is a very wide range of numbers for supposedly similar reaction use cases and certainly a great deal of apparent contradictions (though the experimental frameworks often easily accounts for this).

reaction times

The supporting data for the numbers shown in the above figure can be found via the hyperlink in the above text or in the references below.

Thus, in my opinion, also supported largely by empirical data, a good latency E2E design target for a Tactile network serving human needs, would be between 20 milliseconds and 10 milliseconds. With the latency budget covering the end user device (e.g., tablet, VR/AR goggles, IOT, …), air-interface, transport and processing (i.e., any computing, retrieval/storage, protocol handling, …). It would be unlikely to cover any connectivity out of the operator”s network unless such a connection is manageable from latency and jitter perspective though distance would count against such a strategy.

This would actually be quiet agreeable from a network perspective as the distance to data centers would be far more reasonable and likely reduce the aggressive need for many edge data centers using the below 10 ms target promoted in the Tactile Internet vision paper.

latency budget

There is however one thing that we are assuming in all the above. It is assumed that the user’s local latency can be managed as well and made almost arbitrarily small (i.e., much below 1 ms). Hardly very reasonable even in the short run for human-relevant communications ecosystems (displays, goggles, drivers, etc..) as we shall see below.

For a gaming environment we would look at something like the below illustration;

local latency should be considered

Lets ignore the use case of local games (i.e., where the player only relies on his local computing environment) and focus on games that rely on a remote gaming architecture. This could either be relying on a  client-server based architecture or cloud gaming architecture (e.g., typical SaaS setup). In general the the client-server based setup requires more performance of the users local environment (e.g., equipment) but also allows for more advanced latency compensating strategies enhancing the user perception of instantaneous game reactions. In the cloud game architecture, all game related computing including rendering/encoding (i.e., image synthesis) and video output generation happens in the cloud. The requirements to the end users infrastructure is modest in the cloud gaming setup. However, applying latency reduction strategies becomes much more challenging as such would require much more of the local computing environment that the cloud game architecture tries to get away from. In general the network transport related latency would be the same provide the dedicated game servers and the cloud gaming infrastructure would reside within the same premises. In Choy et al’s 2012 paper “The Brewing Storm in Cloud Gaming: A Measurement Study on Cloud to End-User Latency” , it is shown, through large scale measurements, that current commercial cloud infrastructure architecture is unable to deliver the latency performance for an acceptable (massive) multi-user experience. Partly simply due to such cloud data centers are too far away from the end user. Moreover, the traditional commercial cloud computing infrastructure is simply not optimized for online gaming requiring augmentation of stronger computing resources including GPUs and fast memory designs. Choy et al do propose to distribute the current cloud infrastructure targeting a shorter distance between end user and the relevant cloud game infrastructure. Similar to what is already happening today with content distribution networks (CDNs) being distributed more aggressively in metropolitan areas and thus closer to the end user.

A comprehensive treatment on latencies, or response time scales, in games and how these relates to user experience can be found in Kjetil Raaen’s Ph.D. thesis “Response time in games: Requirements and improvements” as well as in the comprehensive relevant literature list found in this thesis.

From the many studies (as found in Raaen’s work, the work of Mark Claypool and much cited 2002 study by Pantel et al) on gaming experience, including massive multi-user online game experience, shows that players starts to notice delay of about 100 ms of which ca. 20 ms comes from play-out and processing delay. Thus, quiet a far cry from the 1 millisecond. From the work, and not that surprising, sensitivity to gaming latency depends on the type of game played (see the work of Claypool) and how experienced a gamer is with the particular game (e.g., Pantel er al). It should also be noted that in a VR environment, you would want to the image that arrives at your visual system to be in synch with your heads movement and the directions of your vision. If there is a timing difference (or lag) between the direction of your vision and the image presented to your visual system, the user experience becomes rapidly poor causing discomfort by disorientation and confusion (possible leading to a physical reaction such as throwing up). It is also worth noting that in VR there is a substantially latency component simple from the image rendering (e.g., 60 MHz frame rate provides a new frame on average every 16.7 millisecond). Obviously chunking up the display frame rate will reduce the rendering related latency. However, several latency compensation strategies (to compensate for you head and eye movements) have been developed to cope with VR latency (e.g., time warping and prediction schemes).

Anyway, if you would be of the impression that VR is just about showing moving images on the inside of some awesome goggles … hmmm do think again and keep dreaming of 1 millisecond end-2end network centric VR delivery solutions (at least for the networks we have today). Of course 1 ms target is possible really a Proxima-Centauri shot as opposed to a just moonshot.

With a target of no more than 20 milliseconds lag or latency and taking into account the likely reaction time of the users VR system (future system!), that likely leaves no more (and likely less) than 10 milliseconds for transport and any remote server processing. Still this could allow for a data center to be 500 km (5 ms round.trip time in fiber) away from the user and allow another 5 ms for data center processing and possible routing delay along the way.

One might very well be concerned about the present Tactile Internet vision and it’s focus on network centric solutions to the very low latency target of 1 millisecond. The current vision and approach would force (fixed and mobile) network operators to add a considerable amount of data centers in order to get the physical transport time down below the 1 millisecond. This in turn drives the latest trend in telecommunication, the so-called edge data center or edge cloud. In the ultimate limit, such edge data centers (however small) might be placed at cell site locations or fixed network local exchanges or distribution cabinets.

Furthermore, the 1 millisecond as a goal might very well have very little return on user experience (UX) and substantial cost impact for telecom operators. A diligent research through academic literature and wealth of practical UX experiments indicates that this indeed might be the case.

Such a severe and restrictive target as the 1 millisecond is, it severely narrows the Tactile Internet to scenarios where sensing, acting, communication and processing happens in very close proximity of each other. In addition the restrictions to system design it imposes, further limits its relevance in my opinion. The danger is, with the expressed Tactile vision, that too little academic and industrious thinking goes into latency compensating strategies using the latest advances in machine learning, virtual reality development and computational neuroscience (to name a few areas of obvious relevance). Further network reliability and managed latency, in the sense of controlling the variation of the latency, might be of far bigger importance than latency itself below a certain limit.

So if 1 ms is no use to most men and beasts … why bother with this?

While very low latency system architectures might be of little relevance to human senses, it is of course very likely (as it is also pointed out in the Tactile Internet Vision paper) that industrial use cases could benefit from such specifications of latency, reliability and security.

For example in machine-to-machine or things-to-things communications between sensors, actuators, databases, and applications very short reaction times in the order of sub-milliseconds to low milliseconds could be relevant.

We will look at this next.

THE TACTILE INTERNET USE CASES & BUSINESS MODELS.

An open mind would hope that most of what we do strives to out perform human senses, improve how we deal with our environment and situations that are far beyond mere mortal capabilities. Alas I might have read too many Isaac Asimov novels as a kid and young adult.

In particular where 5G has its present emphasis of ultra-high frequencies (i.e., ultra small cells), ultra-wide spectral bandwidth (i.e., lots of Gbps) together with the current vision of the Tactile Internet (ultra-low latencies, ultra-high reliability and ultra-high security), seem to be screaming for being applied to Industrial facilities, logistic warehouses, campus solutions, stadiums, shopping malls, tele-, edge-cloud, networked robotics, etc… In other words, wherever we have a happy mix of sensors, actuators, processors, storage, databases and software based solutions  across a relative confined area, 5G and the Tactile Internet vision appears to be a possible fit and opportunity.

In the following it is important to remember;

  • 1 ms round-trip time ~ 100 km (in fiber) to 150 km (in free space) in 1-way distance from the relevant action if only transport distance mattered to the latency budget.
  • Considering the total latency budget for a 1 ms Tactile application the transport distance is likely to be no more than 20 – 50 km or less (i.e., right at the RAN edge).

One of my absolute current favorite robotics use case that comes somewhat close to a 5G Tactile Internet vision, done with 4G technology, is the example of Ocado’s warehouse automation in UK. Ocado is the world’s largest online-only grocery retailer with ca. 50 thousand lines of goods, delivering more than 200,000 orders a week to customers around the United Kingdom. The 4G network build (by Cambridge Consultants) to support Ocado’s automation is based on LTE at unlicensed 5GHz band allowing Ocado to control 1,000 robots per base station. Each robot communicates with the Base Station and backend control systems every 100 ms on average as they traverses ca. 30 km journey across the warehouse 1,250 square meters. A total of 20 LTE base stations each with an effective range of 4 – 6 meters cover the warehouse area. The LTE technology was essential in order to bring latency down to an acceptable level by fine tuning LTE to perform under its lowest possible latency (<10 ms).

5G will bring lower latency, compared to an even optimized LTE system, that in a similar setup as the above described for Ocado, could further increase the performance. Obviously very high network reliability promised by 5G of such a logistic system needs to be very high to reduce the risk of disruption and subsequent customer dissatisfaction of late (or no) delivery as well as the exposure to grocery stock turning bad.

This all done within the confines of a warehouse building.

ROBOTICS AND TACTILE CONDITIONS

First of all lets limit the Robotics discussion to use cases related to networked robots. After all if the robot doesn’t need a network (pretty cool) it pretty much a singleton and not so relevant for the Tactile Internet discussion. In the following I am using the word Cloud in a fairly loose way and means any form of computing center resources either dedicated or virtualized. The cloud could reside near the networked robotic systems as well as far away depending on the overall system requirements to timing and delay (e.g., that might also depend on the level of robotic autonomy).

Getting networked robots to work well we need to solve a host of technical challenges, such as

  • Latency.
  • Jitter (i.e., variation of latency).
  • Connection reliability.
  • Network congestion.
  • Robot-2-Robot communications.
  • Robot-2-ROS (i.e., general robotics operations system).
  • Computing architecture: distributed, centralized, elastic computing, etc…
  • System stability.
  • Range.
  • Power budget (e.g., power limitations, re-charging).
  • Redundancy.
  • Sensor & actuator fusion (e.g., consolidate & align data from distributed sources for example sensor-actuator network).
  • Context.
  • Autonomy vs human control.
  • Machine learning / machine intelligence.
  • Safety (e.g., human and non-human).
  • Security (e.g., against cyber threats).
  • User Interface.
  • System Architecture.
  • etc…

The network connection-part of the networked robotics system can be either wireless, wired, or a combination of wired & wireless. Connectivity could be either to a local computing cloud or data center, to an external cloud (on the internet) or a combination of internal computing for control and management for applications requiring very low-latency very-low jitter communications and external cloud for backup and latency-jitter uncritical applications and use cases.

For connection types we have Wired (e.g., LAN), Wireless (e.g., WLAN) and Cellular  (e.g., LTE, 5G). There are (at least) three levels of connectivity we need to consider; inter-robot communications, robot-to-cloud communications (or operations and control systems residing in Frontend-Cloud or computing center), and possible Frontend-Cloud to Backend-Cloud (e..g, for backup, storage and latency-insensitive operations and control systems). Obviously, there might not be a need for a split in Frontend and Backend Clouds and pending on the use case requirements could be one and the same. Robots can be either stationary or mobile with a need for inter-robot communications or simply robot-cloud communications.

Various networked robot connectivity architectures are illustrated below;

networked robotics

ACKNOWLEDGEMENT

I greatly acknowledge my wife Eva Varadi for her support, patience and understanding during the creative process of creating this Blog.

.WORTHY 5G & RELATED READS.

  1. “NGMN 5G White Paper” by R.El Hattachi & J. Erfanian (NGMN Alliance, February 2015).
  2. “The Tactile Internet” by ITU-T (August 2014). Note: in this Blog this paper is also referred to as the Tactile Internet Vision.
  3. “5G: Personal Mobile Internet beyond What Cellular Did to Telephony” by G. Fettweis & S. Alamouti, (Communications Magazine, IEEE , vol. 52, no. 2, pp. 140-145, February 2014).
  4. “The Tactile Internet: Vision, Recent Progress, and Open Challenges” by Martin Maier, Mahfuzulhoq Chowdhury, Bhaskar Prasad Rimal, and Dung Pham Van (IEEE Communications Magazine, May 2016).
  5. “John Carmack’s delivers some home truths on latency” by John Carmack, CTO Oculus VR.
  6. “All About Robotic Surgery” by The Official Medical Robotics News Center.
  7. “The surgeon who operates from 400km away” by BBC Future (2014).
  8. “The Case for VM-Based Cloudlets in Mobile Computing” by Mahadev Satyanarayanan et al. (Pervasive Computing 2009).
  9. “Perception of Delay in Haptic Telepresence Systems” by Markus Rank et al. (pp 389, Presence: Vol. 19, Number 5).
  10. “Neuroscience Exploring the Brain” by Mark F. Bear et al. (Fourth Edition, 2016 Wolters Kluwer).
  11. “Neurophysiology: A Conceptual Approach” by Roger Carpenter & Benjamin Reddi (Fifth Edition, 2013 CRC Press). Definitely a very worthy read by anyone who want to understand the underlying principles of sensory functions and basic neural mechanisms.
  12. “Designing with the Mind in Mind” by Jeff Johnson (2010, Morgan Kaufmann). Lots of cool information of how to design a meaningful user interface and of basic user expirence principles worth thinking about.
  13. “Vision How it works and what can go wrong” by John E. Dowling et al. (2016, The MIT Press).
  14. “Visual Psychophysics From Laboratory to Theory” by Yhong-Lin Lu and Barbera Dosher (2014, MIT Press).
  15. “The Time Delay in Human Vision” by D.A. Wardle (The Physics Teacher, Vol. 36, Oct. 1998).
  16. “What do we perceive in a glance of a real-world scene?” by Li Fei-Fei et al. (Journal of Vision (2007) 7(1); 10, 1-29).
  17. “Detecting meaning in RSVP at 13 ms per picture” by Mary C. Potter et al. (Attention, Perception, & Psychophysics, 76(2): 270–279).
  18. “Banana or fruit? Detection and recognition across categorical levels in RSVP” by Mary C. Potter & Carl Erick Hagmann (Psychonomic Bulletin & Review, 22(2), 578-585.).
  19. “Human time perception and its illusions” by David M. Eaglerman (Current Opinion in Neurobiology, Volume 18, Issue 2, Pages 131-136).
  20. “How Much Faster is Fast Enough? User Perception of Latency & Latency Improvements in Direct and Indirect Touch” by J. Deber, R. Jota, C. Forlines and D. Wigdor (CHI 2015, April 18 – 23, 2015, Seoul, Republic of Korea).
  21. “Response time in games: Requirements and improvements” by Kjetil Raaen (Ph.D., 2016, Department of Informatics, The Faculty of Mathematics and Natural Sciences, University of Oslo).
  22. “Latency and player actions in online games” by Mark Claypool & Kajal Claypool (Nov. 2006, Vol. 49, No. 11 Communications of the ACM).
  23. “The Brewing Storm in Cloud Gaming: A Measurement Study on Cloud to End-User Latency” by Sharon Choy et al. (2012, 11th Annual Workshop on Network and Systems Support for Games (NetGames), 1–6).
  24. “On the impact of delay on real-time multiplayer games” by Lothar Pantel and Lars C. Wolf (Proceedings of the 12th International Workshop on Network and Operating Systems Support for Digital Audio and Video, NOSSDAV ’02, New York, NY, USA, pp. 23–29. ACM.).
  25. “Oculus Rift’s time warping feature will make VR easier on your stomach” from ExtremeTech Grant Brunner on Oculus Rift Timewarping. Pretty good video included on the subject.
  26. “World first in radio design” by Cambridge Consultants. Describing the work Cambridge Consultants did with Ocado (UK-based) to design the worlds most automated technologically advanced warehouse based on 4G connected robotics. Please do see the video enclosed in page.
  27. “Ocado: next-generation warehouse automation” by Cambridge Consultants.
  28. “Ocado has a plan to replace humans with robots” by Business Insider UK (May 2015). Note that Ocado has filed more than 73 different patent applications across 32 distinct innovations.
  29. “The Robotic Grocery Store of the Future Is Here” by MIT Technology Review (December 201
  30. “Cloud Robotics: Architecture, Challenges and Applications.” by Guoqiang Hu et al (IEEE Network, May/June 2012).

5G Economics – An Introduction (Chapter 1)

After 3G came 4G. After 4G comes 5G. After 5G comes 6G. The Shrivatsa of Technology.

This blog (over the next months a series of Blogs dedicated to 5G), “5G Economics – An Introduction”, has been a very long undertaking. In the making since 2014. Adding and then deleting as I change my opinion and then changed it again. The NGNM Alliance “NGMN 5G White Paper” (here after the NGMN whitepaper) by Rachid El Hattachi & Javan Erfanian has been both a source of great visionary inspiration as well as a source of great worry when it comes to the economical viability of their vision. Some of the 5G ideas and aspirations are truly moonshot in nature and would make the Singularity University very proud.

So what is the 5G Vision?

“5G is an end-to-end ecosystem to enable a fully mobile and connected society. It empowers value creation towards customers and partners, through existing and emerging use cases, delivered with consistent experience, and enabled by sustainable business models.” (NGMN 5G Vision, NGMN 5G whitepaper).

The NGMN 5G vision is not only limited to enhancement of the radio/air interface (although it is the biggest cost & customer experience factor). 5G seeks to capture the complete end-2-end telecommunications system architecture and its performance specifications. This is an important difference from past focus on primarily air interface improvements (e.g., 3G, HSPA, LTE, LTE-adv) and relative modest evolutionary changes to the core network architectural improvements (PS CN, EPC). In particular, the 5G vision provides architectural guidance on the structural separation of hardware and software. Furthermore, it utilizes the latest development in software defined telecommunications functionality enabled by cloudification and virtualization concepts known from modern state-of-the art data centers. The NGMN 5G vision most likely have accepted more innovation risk than in the past as well as being substantially more ambitious in both its specifications and the associated benefits.

“To boldly go where no man has gone before”

In the following, I encourage the reader to always keep in the back of your mind; “It is far easier to criticize somebody’s vision, than it is to come with the vision yourself”. I have tons of respect for the hard and intense development work, that so far have been channeled into making the original 5G vision into a deployable technology that will contribute meaningfully to customer experience and the telecommunications industry.

For much of the expressed concerns in this blog and in other critiques, it is not that those concerns have not been considered in the NGMN whitepaper and 5G vision, but more that those points are not getting much attention.

The cellular “singularity”, 5G that is, is supposed to hit us by 2020. In only four years. Americans and maybe others, taking names & definitions fairly lightly, might already have “5G” ( a l’Americaine) in a couple of years before the real thing will be around.

The 5G Vision is a source of great inspiration. The 5G vision will (and is) requiring a lot of innovation efforts, research & development to actually deliver on what for most parts are very challenging improvements over LTE.

My own main points of concern are in particular towards the following areas;

  • Obsession with very high sustainable connection throughputs (> 1 Gbps).
  • Extremely low latencies (1 ms and below).
  • Too little (to none) focus on controlling latency variation (e.g., jitter), which might be of even greater importance than very low latency (<<10 ms) in its own right. I term this network predictability.
  • Too strong focus on frequencies above 3 GHz in general and in particular the millimeter wave range of 30 GHz to 300 GHz.
  • Backhaul & backbone transport transformation needed to support the 5G quantum leap in performance has been largely ignored.
  • Relative weak on fixed – mobile convergence.

Not so much whether some of the above points are important or not .. they are of course important. Rather it is a question of whether the prioritization and focus is right. A question of channeling more efforts into very important (IMO) key 5G success factors, e.g., transport, convergence and designing 5G for the best user experience (and infinitely faster throughput per user is not the answer) ensuring the technology to be relevant for all customers and not only the ones who happens to be within coverage of a smallest cell.

Not surprisingly the 5G vision is a very mobile system centric. There is too little attention to fixed-mobile convergence and the transport solutions (backhaul & backbone) that will enable the very high air-interface throughputs to be carried through the telecoms network. This is also not very surprising as most mobile folks, historically did not have to worry too much about transport at least in mature advanced markets (i.e., the solutions needed was there without innovation an R&D efforts).

However, this is a problem. The required transport upgrade to support the 5G promises is likely to be very costly. The technology economics and affordability aspects of what is proposed is still very much work in progress. It is speculated that new business models and use cases will be enabled by 5G. So far little has been done in quantifying those opportunities and see whether those can justify some of the incremental cost that surely operators will incur as the deploy 5G.

CELLULAR CAPACITY … IT WORKS FOR 5G TOO!

To create more cellular capacity measured in throughput is easy or can be made so with a bit of approximations. “All” we need is an amount of frequency bandwidth Hz, an air-interface technology that allow us to efficiently carry a certain amount of information in bits per second per unit bandwidth per capacity unit (i.e., we call this spectral efficiency) and a number of capacity units or multipliers which for a cellular network is the radio cell. The most challenging parameter in this game is the spectral efficiency as it is governed by the laws of physics with a hard limit (actually silly me … bandwidth and capacity units are obviously as well), while a much greater degree of freedom governs the amount of bandwidth and of course the number of cells.

capacity fundamentals 

Spectral efficiency is given by the so-called Shannon’s Law (for the studious inclined I recommend to study his 1948 paper “A Mathematical Theory of Communications”). The consensus is that we are very close to the Shannon Limit in terms of spectral efficiency (in terms of bits per second per Hz) of the cellular air-interface itself. Thus we are dealing with diminishing returns of what can be gained by further improving error correction, coding and single-input single-output (SISO) antenna technology.

I could throw more bandwidth at the capacity problem (i.e., the reason for the infatuation with the millimeter wave frequency range as there really is a lot available up there at 30+ GHz) and of course build a lot more cell sites or capacity multipliers (i.e., definitely not very economical unless it results in a net positive margin). Of course I could (and most likely will if I had a lot of money) do both.

I could also try to be smart about the spectral efficiency and Shannon’s law. If I could reduce the need for or even avoid building more capacity multipliers or cell sites, by increasing my antenna system complexity it is likely resulting in very favorable economics. It turns out that multiple antennas acts as a multiplier (simplistic put) for the spectral efficiency compared to a simple single (or legacy) antenna system. Thus, the way to improve the spectral efficiency inevitable leads us to substantially more complex antenna technologies (e.g., higher order MiMo, massive MiMo, etc…).

Building new cell sites or capacity multiplier should always be the last resort as it is most likely the least economical option available to boost capacity.

Thus we should be committing increasingly more bandwidth (i.e., 100s – 1000s of Mhz and beyond) assuming it is available (i.e, if not we are back to adding antenna complexity and more cell sites). The need for very large bandwidths, in comparison with what is deployed in today’s cellular systems, automatically forces the choices into high frequency ranges, i.e., >3 GHz and into the millimeter wave range of above 30 GHz. The higher frequency band leads in inevitably to limited coverage and a high to massive demand for small cell deployment.

Yes! It’s a catch 22 if there ever was one. The higher carrier frequency increases the likelihood of more available bandwidth. higher carrier frequency also results in a reduced the size of our advanced complex antenna system (which is good). Both boost capacity to no end. However, my coverage area where I have engineered the capacity boost reduces approx. with the square of the carrier frequency.

Clearly, ubiquitous 5G coverage at those high frequencies (i.e., >3 GHz) would be a very silly endeavor (to put it nicely) and very un-economical.

5G, as long as the main frequency deployed is in the high or very high frequency regime, would remain a niche technology. Irrelevant to a large proportion of customers and use cases.

5G needs to be macro cellular focused to become relevant for all customers and economically beneficial to most use cases.

THE CURIOUS CASE OF LATENCY.

The first time I heard about the 5G 1 ms latency target (communicated with a straight face and lots of passion) was to ROFL. Not a really mature reaction (mea culpa) and agreed, many might have had the same reaction when J.F. Kennedy announced to put a man on the moon and safely back on Earth within 10 years. So my apologies for having had a good laugh (likely not the last to laugh though in this matter).

In Europe, the average LTE latency is around 41±9 milliseconds including pinging an external (to the network) server but does not for example include the additional time it takes to load a web page or start a video stream. The (super) low latency (1 ms and below) poses other challenges but at least relevant to the air-interface and a reasonable justification to work on a new air-interface (apart from studying channel models in the higher frequency regime). The best latency, internal to the mobile network itself, you can hope to get out of “normal” LTE as it is commercially deployed is slightly below 20 ms (without considering re-transmission). For pre-allocated LTE this can further be reduced towards the 10 ms (without considering re-transmission which adds at least 8 ms). In 1 ms light travels ca. 200 km (in optical fiber). To support use cases requiring 1 ms End-2-End latency, all transport & processing would have to be kept inside the operators network. Clearly, the physical transport path to the location, where processing of the transported data would occur, would need to be very short to guaranty 1 ms. The relative 5G latency improvement over LTE would need to be (much) better than 10 (LTE pre-allocated) to 20 times (scheduled “normal” LTE), ignoring re-transmission (which would only make the challenge bigger.

An example. Say that 5G standardization folks gets the latency down to 0.5 ms (vs the ~ 20 – 10 ms today), the 5G processing node (i.e., Data Center) cannot be more than 50 km away from the 5G-radio cell (i..e, it takes light ca. 0.5 ms travel 100 km in fiber). This latency (budget) challenge has led the Telco industry to talk about the need for so-called edge computing and the need for edge data centers to provide the 5G promise of very low latencies. Remember this is opposing the past Telco trend of increasing centralization of computing & data processing resources. Moreover, it is bound to lead to incremental cost. Thus, show me the revenues.

There is no doubt that small, smaller and smallest 5G cells will be essential for providing the very lowest latencies and the smallness is coming for “free” given the very high frequencies planned for 5G. The cell environment of a small cell is more ideal than a macro-cellular harsh environment. Thus minimizing the likelihood of re-transmission events. And distances are shorter which helps as well.

I believe that converged telecommunications operators, are in a better position (particular compared to mobile only operations) to leverage existing fixed infrastructure for a 5G architecture relying on edge data centers to provide very low latencies. However, this will not come for free and without incremental costs.

How much faster is fast enough from a customer experience perspective? According with John Carmack, CTO of Oculus Rift, “.. when absolute delays are below approximately 20 milliseconds they are generally imperceptible.” particular as it relates to 3D systems and VR/AR user experience which is a lot more dynamic than watching content loading. According to recent research specific to website response time indicates that anything below 100 ms wil be perceived as instantaneous. At 1 second users will sense the delay but would be perceived as seamless. If a web page loads in more than 2 seconds user satisfaction levels drops dramatically and a user would typically bounce. Please do note that most of this response or download time overhead has very little to do with connection throughput, but to do with a host of other design and configuration issues. Cranking up the bandwidth will not per se solve poor browsing performance.

End-2-End latency in the order of 20 ms are very important for a solid high quality VR user experience. However, to meet this kind of performance figure the VR content needs to be within the confines for the operator’s own network boundaries.

End-2-End (E2E) latencies of less than 100 ms would in general be perceived as instantaneous for normal internet consumption (e.g., social media, browsing, …). However that this still implies that operators will have to focus on developing internal to their network’s latencies far below the over-all 100 ms target and that due to externalities might try to get content inside their networks (and into their own data centers).

A 10-ms latency target, while much less moonshot, would be a far more economical target to strive for and might avoid substantial incremental cost of edge computing center deployments. It also resonates well with the 20 ms mentioned above, required for a great VR experience (leaving some computing and process overhead).

The 1-ms vision could be kept for use cases involving very short distances, highly ideal radio environment and with compute pretty much sitting on top of the whatever needs this performance, e.g., industrial plants, logistic / warehousing, …

Finally, the targeted extreme 5G speeds will require very substantial bandwidths. Such large bandwidths are readily available in the high frequency ranges (i.e., >3 GHz). The high frequency domain makes a lot of 5G technology challenges easier to cope with. Thus cell ranges will be (very) limited in comparison to macro cellular ones, e.g., Barclays Equity Research projects 10x times more cells will be required for 5G (10x!). 5G coverage will not match that of the macro cellular (LTE) network. In which case 5G will remain niche. With a lot less relevance to consumers. Obviously, 5G will have to jump the speed divide (a very substantial divide) to the macro cellular network to become relevant to the mass market. Little thinking appears to be spend on this challenge currently.     

what we are waiting for

THE VERY FINE ART OF DETECTING MYTH & BALONEY.

Carl Sagan, in his great article  The Fine Art of Baloney Detection, states that one should “Try not to get overly attached to a hypothesis just because it’s yours.”. Although Carl Sagan starts out discussing the nature of religious belief and the expectations of an afterlife, much of his “Baloney Detection Kit” applies equally well to science & technology. In particular towards our expert expectations towards consumerism and its most likely demand. After all, isn’t Technology in some respects our new modern day religion?

Some might have the impression that expectations towards 5G, is the equivalent of a belief in an afterlife or maybe more accurately resurrection of the Telco business model to its past glory. It is almost like a cosmic event, where after entropy death, the big bang gives birth to new, and supposedly unique (& exclusive) to our Telco industry, revenue streams that will make  all alright (again). There clearly is some hype involved in current expectations towards 5G, although the term still has to enter the Gartner hype cycle report (maybe 2017 will be the year?).

The cynic (mea culpa) might say that it is in-evitable that there will be a 5G after 4G (that came after 3G (that came after 2G)). We also would expect 5G to be (a lot) better than 4G (that was better than 3G, etc..).

so …

who cares

Well … Better for who? … Better for Telcos? Better for Suppliers? Better revenues? Their Shareholders? Better for our Consumers? Better for our Society? Better for (engineering) job security? … Better for Everyone and Everything? Wow! Right? … What does better mean?

  • Better speed … Yes! … Actually the 5G vision gives me insanely better speeds than LTE does today.
  • Better latency … Internal to the operator’s own network Yes! … Not per default noticeable for most consumer use cases relying on the externalities of the internet.
  • Better coverage … well if operators can afford to provide 100% 5G coverage then certainly Yes! Consumers would benefit even at a persistent 50 Mbps level.
  • Better availability …I don’t really think that Network Availability is a problem for the general consumer where there is coverage (at least not in mature markets, Myanmar absolutely … but that’s an infrastructure problem rather than a cellular standard one!) … Whether 100% availability is noticeable or not will depend a lot on the starting point.
  • Better (in the sense of more) revenues … Work in Progress!
  • Better margins … Only if incremental 5G cost to incremental 5G revenue is positive.
  • etc…

Recently William Webb published a book titled “The 5G Myth: And why consistent connectivity is a better future” (reminder: a myth is a belief or set of beliefs, often unproven or false, that have accrued around a person, phenomenon, or institution). William Web argues;

  • 5G vision is flawed and not the huge advance in global connectivity as advertised.
  • The data rates promised by 5G will not be sufficiently valued by the users.
  • The envisioned 5G capacity demand will not be needed.
  • Most operators can simply not afford the cost required to realize 5G.
  • Technology advances are in-sufficient to realize the 5G vision.
  • Consistent connectivity is the more important aim of a 5G technology.

I recommend all to read William Webb’s well written and even better argued book. It is one for the first more official critiques of the 5G Vision. Some of the points certainly should have us pause and maybe even re-evaluate 5G priorities. If anything, it helps to sharpen 5G arguments.

Despite William Webb”s critique of 5G, one need to realize that a powerful technology vision of what 5G could be, even if very moonshot, does leapfrog innovation, needed to take a given technology too a substantially higher level, than what might otherwise be the case. If the 5G whitepaper by Rachid El Hattachi & Javan Erfanian had “just” been about better & consistent coverage, we would not have had the same technology progress independent of whether the ultimate 5G end game is completely reachable or not. Moreover, to be fair to the NGMN whitepaper, it is not that the whitepaper does not consider consistent connectivity, it very much does. It is more a matter of where lies the main attention of the industry at this moment. That attention is not on consistent connectivity but much more on niche use cases (i.e., ultra high bandwidth at ultra low latencies).

Rest assured, over the next 10 to 15 years we will see whether William Webb will end up in the same category as other very smart in the know people getting their technology predictions proven wrong (e.g., IBM Chairman Thomas Watson’s famous 1943 quote that “… there is a world market for maybe five computers.” and NO! despite claims of the contrary Bill Gates never said “640K of memory should be enough for anybody.”).

Another, very worthy 5G analysis, also from 2016, is the Barclays Equity Research “5G – A new Dawn”  (September 2016) paper. The Barclays 5G analysis concludes ;

  • Mobile operator’s will need 10x more sites over the next 5 to 10 years driven by 5G demand.
  • There will be a strong demand for 5G high capacity service.
  • The upfront cost for 5G will be very substantial.
  • The cost of data capacity (i.e., Euro per GB) will fall approx. a factor 13 between LTE and 5G (note: this is “a bit” of a economic problem when capacity is supposed to increase a factor 50).
  • Sub-scale Telcos, including mobile-only operations, may not be able to afford 5G (note: this point, if true, should make the industry very alert towards regulatory actions).
  • Having a modernized super-scalable fixed broadband transport network likely to be a 5G King Maker (note: Its going to be great to be an incumbent again).

To the casual observer, it might appear that Barclays is in strong opposition to William Webb’s 5G view. However, maybe that is not completely so.

If it is true, that only very few Telco’s, primarily modernized incumbent fixed-mobile Telco’s, can afford to build 5G networks, one might argue that the 5G Vision is “somewhat” flawed economically. The root cause for this assumed economical flaw (according with Barclays, although they do not point out it is a flaw!) clearly is the very high 5G speeds, assumed to be demanded by the user. Resulting in massive increase in network densification and need for radically modernized & re-engineered transport networks to cope with this kind of demand.

Barclays assessments are fairly consistent with the illustration shown below of the likely technology cost impact, showing the challenges a 5G deployment might have;

5G cost impact

Some of the possible operational cost improvements in IT, Platforms and Core shown in the above illustration arises from the natural evolving architectural simplifications and automation strategies expected to be in place by the time of the 5G launch. However, the expected huge increase in small cells are the root cause of most of the capital and operational cost pressures expected to arise with 5G. Depending on the original state of the telecommunications infrastructure (e.g., cloudification, virtualization,…), degree of transport modernization (e.g., fiberization), and business model (e.g., degree of digital transformation), the 5G economical impact can be relative modest (albeit momentarily painful) to brutal (i.e., little chance of financial return on investment). As discussed in the Barclays “5G – A new dawn” paper.

Furthermore, if the relative cost of delivering a 5G Byte is 13 – 14 times lower than an LTE Byte, and the 5G capacity demand is 50 times higher than LTE, the economics doesn’t work out very well. So if I can produce a 5G Byte at 1/14th of an LTE Byte, but my 5G Byte demand is 50x higher than in LTE, I could (simplistically) end up with more than 3x more absolute cost for 5G. That’s really Ugly! Although if Barclays are correct in the factor 10 higher number of 5G sites, then a (relevant) cost increase of factor 3 doesn’t seem completely unrealistic. Of course Barclays could be wrong! Unfortunately, an assessment of the incremental revenue potential has yet to be provided. If the price for a 5G Byte could be in excess of a factor 3 of an LTE Byte … all would be cool!

If there is something to be worried about, I would worry much more about the Barclays 5G analysis than the challenges of William Webb (although certainly somehow intertwined).

What is the 5G market potential in terms of connections?

At this moment very few 5G market uptake forecasts have yet made it out in the open. However, taking the Strategy Analytics August 2016 5G FC of ca. 690 million global 5G connections by year 2025 we can get an impression of how 5G uptake might look like;

mobile uptake projections

Caution! Above global mobile connection forecast is likely to change many time as we approaches commercial launch and get much better impression of the 5G launch strategies of the various important players in the Telco Industry. In my own opinion, if 5G will be launched primarily in the mm-wave bands around and above 30 GHz, I would not expect to see a very aggressive 5G uptake. Possible a lot less than the above (with the danger of putting myself in the category of badly wrong forecasts of the future). If 5G would be deployed as an overlay to existing macro-cellular networks … hmmm who knows! maybe above would be a very pessimistic view of 5G uptake?

THE 5G PROMISES (WHAT OTHERS MIGHT CALL A VISION).

Let’s start with the 5G technology vision as being presented by NGMN and GSMA.

GSMA (Groupe Speciale Mobile Association) 2014 paper entitled ‘Understanding 5G: Perspective on future technology advancements in mobile’ have identified 8 main requirements; 

1.    1 to 10 Gbps actual speed per connection at a max. of 10 millisecond E2E latency.

Note 1: This is foreseen in the NGMN whitepaper only to be supported in dense urban areas including indoor environments.

Note 2: Throughput figures are as experienced by the user in at least 95% of locations for 95% of the time.

Note 3: In 1 ms speed the of light travels ca. 200 km in optical fiber.

2.    A Minimum of 50 Mbps per connection everywhere.

Note 1: this should be consistent user experience outdoor as well as indoor across a given cell including at the cell edge.

Note 2: Another sub-target under this promise was ultra-low cost Networks where throughput might be as low as 10 Mbps.

3.    1,000 x bandwidth per unit area.

Note: notice the term per unit area & think mm-wave frequencies; very small cells, & 100s of MHz frequency bandwidth. This goal is not challenging in my opinion.

4.    1 millisecond E2E round trip delay (tactile internet).

Note: The “NGMN 5G White Paper” does have most 5G use cases at 10 ms allowing for some slack for air-interface latency and reasonable distanced transport to core and/or aggregation points.

5.    Massive device scale with 10 – 100 x number of today’s connected devices.

Note: Actually, if one believes in the 1 Million Internet of Things connections per km2 target this should be aimed close to 1,000+ x rather than the 100 x for an urban cell site comparison.

6.    Perception of 99.999% service availability.

Note: ca. 5 minutes of service unavailability per year. If counted on active usage hours this would be less than 2.5 minutes per year per customer or less than 1/2 second per day per customer.

7.    Perception of 100% coverage.

Note: In 2015 report from European Commission, “Broadband Coverage in Europe 2015”, for EU28, 86% of households had access to LTE overall. However, only 36% of EU28 rural households had access to LTE in 2015.

8.    90% energy reduction of current network-related energy consumption.

Note: Approx. 1% of a European Mobile Operator’s total Opex.

9.    Up-to 10 years battery life for low-power Internet of Things 5G devices. 

The 5G whitepaper also discusses new business models and business opportunities for the Telco industry. However, there is little clarity on what would be the relevant 5G business targets. In other words, what would 5G as a technology bring, in additional Revenues, in Churn reduction, Capex & Opex (absolute) Efficiencies, etc…

More concrete and tangible economical requirements are badly required in the 5G discussion. Without it, is difficult to see how Technology can ensure that the 5G system that will be developed is also will be relevant for the business challenges in 2020 and beyond.

Today an average European Mobile operator spends approx. 40 Euro in Total Cost of Ownership (TCO) per customer per anno on network technology (and slightly less on average per connection). Assuming a capital annualization rate of 5 years and about 15% of its Opex relates to Technology (excluding personnel cost).

The 40 Euro TCO per customer per anno sustains today an average LTE EU28 customer experience of 31±9 Mbps downlink speed @ 41±9 ms (i.e., based on OpenSignal database with data as of 23 December 2016). Of course this also provides for 3G/HSPA network sustenance and what remains of the 2G network.

Thus, we might have a 5G TCO ceiling at least without additional revenue. The maximum 5G technology cost per average speed (in downlink) of 1 – 10 Gbps @ 10 ms should not be more than 40 Euro TCO per customer per anno (i.e, and preferably a lot less at the time we eventually will launch 5G in 2020).


Thus, our mantra when developing the 5G system should be:

5G should not add additional absolute cost burden to the Telecom P&L.

and also begs the question of proposing some economical requirements to partner up with the technology goals.


5G ECONOMIC REQUIREMENTS (TO BE CONSIDERED).

  • 5G should provide new revenue opportunities in excess of 20% of access based revenue (e.g., Europe mobile access based revenue streams by 2021 expected to be in the order of 160±20 Billion Euro; thus the 5G target for Europe should be to add an opportunity of ca. 30±5 Billion in new non-access based revenues).
  • 5G should not add to Technology  TCO while delivering up-to 10 Gbps @ 10 ms (with a floor level of 1 Gbps) in urban areas.
  • 5G focus on delivering macro-cellular customer experience at minimum 50 Mbps @ maximum 10 ms.
  • 5G should target 20% reduction of Technology TCO while delivering up-to 10 Gbps @ 10 ms (min. 1 Gbps).
  • 5G should keep pursuing better spectral efficiency (i.e., Mbps/MHz/cell) not only through means antennas designs, e.g., n-order MiMo and Massive-MiMo, that are largely independent of the air-interface (i.e., works as well with LTE).
  • Target at least 20% 5G device penetration within first 2 years of commercial launch (note: only after 20% penetration does the technology efficiency become noticeable).

In order not to increment the total technology TCO, we would at the very least need to avoid adding additional physical assets or infrastructure to the existing network infrastructure. Unless such addition provide a net removal of other physical assets and thus associated cost. This is in the current high frequency, and resulting demand for huge amount of small cells, going to be very challenging but would be less so by focusing more on macro cellular exploitation of 5G.

Thus, there need to be a goal to also overlay 5G on our existing macro-cellular network. Rather than primarily focus on small, smaller and smallest cells. Similar to what have been done for LT and was a much more challenge with UMTS (i.e., due to optimum cellular grid mismatch between the 2G voice-based and the 3G more data-centric higher frequency network).

What is the cost reference that should be kept in mind?

As shown below, the pre-5G technology cost is largely driven by access cost related to the number of deployed sites in a given network and the backhaul transmission.

technology cost pre-5G

Adding more sites, macro-cellular or a high number of small cells, will increase Opex and add not only a higher momentary Capex demand, but also burden future cash requirements. Unless equivalent cost can removed by the 5G addition.

Obviously, if adding additional physical assets leads to verifiable incremental margin, then accepting incremental technology cost might be perfectly okay (let”s avoid being radical financial controllers).

Though its always wise to remember;

Cost committed is a certainty, incremental revenue is not.

NAUGHTY … IMAGINE A 5G MACRO CELLULAR NETWORK (OHH JE!).

From the NGMN whitepaper, it is clear that 5G is supposed to be served everywhere (albeit at very different quality levels) and not only in dense urban areas. Given the economical constraints (considered very lightly in the NGMN whitepaper) it is obvious that 5G would be available across operators existing macro-cellular networks and thus also in the existing macro cellular spectrum regime. Not that this gets a lot of attention.

In the following, I am proposing a 5G macro cellular overlay network providing a 1 Gbps persistent connection enabled by massive MiMo antenna systems. This though experiment is somewhat at odds with the NGMN whitepaper where their 50 Mbps promise might be more appropriate. Due to the relative high frequency range in this example, massive MiMo might still be practical as a deployment option.

If you follow all the 5G news, particular on 5G trials in US and Europe, you easily could get the impression that mm-wave frequencies (e.g., 30 GHz up-to 300 GHz) are the new black.

There is the notion that;

“Extremely high frequencies means extremely fast 5G speeds”

which is baloney! It is the extremely large bandwidth, readily available in the extremely high frequency bands, that make for extremely fast 5G (and LTE of course) speeds.

We can have GHz bandwidths instead of MHz (i.e, 1,000x) to play with! … How extremely cool is that not? We totally can suck at fundamental spectral efficiency and still get out extremely high throughputs for the consumers data consumption.

While this mm-wave frequency range is very cool, from an engineering perspective and for sure academically as well, it is also extremely non-matching our existing macro-cellular infrastructure with its 700 to 2.6 GHz working frequency range. Most mobile networks in Europe have been build on a 900 or 1800 MHz fundamental grid, with fill in from UMTS 2100 MHz coverage and capacity requirements.

Being a bit of a party pooper, I asked whether it wouldn’t be cool (maybe not to the extreme … but still) to deploy 5G as an overlay on our existing (macro) cellular network? Would it not be economically more relevant to boost the customer experience across our macro-cellular networks, that actually serves our customers today? As opposed to augment the existing LTE network with ultra hot zones of extreme speeds and possible also an extreme number of small cells.

If 5G would remain an above 3 GHz technology, it would be largely irrelevant to the mass market and most use cases.

A 5G MACRO CELLULAR THOUGHT EXAMPLE.

So let’s be (a bit) naughty and assume we can free up 20MHz @ 1800 MHz. After all, mobile operators tend to have a lot of this particular spectrum anyway. They might also re-purpose 3G/LTE 2.1 GHz spectrum (possibly easier than 1800 MHz pending overall LTE demand).

In the following, I am ignoring that whatever benefits I get out of deploying higher-order MiMo or massive MiMo (mMiMo) antenna systems, will work (almost) equally well for LTE as it will for 5G (all other things being equal).

Remember we are after

  • A lot more speed. At least 1 Gbps sustainable user throughput (in the downlink).
  • Ultra-responsiveness with latencies from 10 ms and down (E2E).
  • No worse 5G coverage than with LTE (at same frequency).

Of course if you happen to be a NGMN whitepaper purist, you will now tell me that I my ambition should only be to provide sustainable 50 Mbps per user connection. It is nevertheless an interesting thought exercise to explore whether residential areas could be served, by the existing macro cellular network, with a much higher consistent throughput than 50 Mbps that might ultimately be covered by LTE rather than needing to go to 5G. Anywhere both Rachid El Hattachi and Jarvan Erfenian knew well enough to hedge their 5G speed vision against the reality of economics and statistical fluctuation.

and I really don’t care about the 1,000x (LTE) bandwidth per unit area promise!

Why? The 1,000x promise It is fairly trivial promise. To achieve it, I simply need a high enough frequency and a large enough bandwidth (and those two as pointed out goes nicely hand in hand). Take a 100 meter 5G-cell range versus a 1 km LTE-cell range. The 5G-cell is 100 times smaller in coverage area and with 10x more 5G spectral bandwidth than for LTE (e.g., 200 MHz 5G vs 20 MHz LTE), I would have the factor 1,000 in throughput bandwidth per unit area. This without having to assume mMiMo that I could also choose to use for LTE with pretty much same effect.

Detour to the cool world of Academia: University of Bristol published recently (March 2016) a 5G spectral efficiency of ca. 80 Mbps/MHz in a 20 MHz channel. This is about 12 times higher than state of art LTE spectral efficiency. Their base station antenna system was based on so-called massive MiMo (mMiMo) with 128 antenna elements, supporting 12 users in the cell as approx. 1.6 Gbps (i.e., 20 MHz x 80 Mbps/MHz). The proof of concept system operated 3.5 GHz and in TDD mode (note: mMiMo does not scale as well for FDD and pose in general more challenges in terms of spectral efficiency). National Instruments provides a very nice overview of 5G MMiMo systems in their whitepaper “5G Massive MiMo Testbed: From Theory to Reality”.

A picture of the antenna system is shown below;

LundMassiveMIMO_20160208165350

Figure above: One of the World’s First Real-Time massive MIMO Testbeds–Created at Lund University. Source: “5G Massive MiMo (mMiMo) Testbed: From Theory to Reality” (June 2016).

For a good read and background on advanced MiMo antenna systems I recommend Chockalingam & Sundar Rajan’s book on “Large MiMo Systems” (Cambridge University Press, 2014). Though there are many excellent accounts of simple MiMo, higher-order MiMo, massive MiMo, Multi-user MiMo antenna systems and the fundamentals thereof.

Back to naughty (i.e., my 5G macro cellular network);

So let’s just assume that the above mMiMO system, for our 5G macro-cellular network,

  • Ignoring that such systems originally were designed and works best for TDD based systems.
  • and keeping in mind that FDD mMiMo performance tends to be lower than TDD all else being equal.

will, in due time, be available for 5G with a channel of at least 20 MHz @ 1800MHz. And at a form factor that can be integrated well with existing macro cellular design without incremental TCO.

This is a very (VERY!) big assumption. Requirements of substantially more antenna space for massive MiMo systems, at normal cellular frequency ranges, are likely to result. Structural integrity of site designs would have to be checked and possibly be re-enforced to allow for the advanced antenna system, contributing to both additional capital cost and possible incremental tower/site lease.

So we have (in theory) a 5G macro-cellular overlay network with at least cell speeds of 1+Gbps, which is ca. 10 – 20 times that of today’s LTE networks cell performance (not utilizing massive MiMo!). If I have more 5G spectrum available, the performance would increase linearly (and a bit) accordingly.

The observant reader will know that I have largely ignored the following challenges of massive MiMo (see also Larsson et al’s “Massive MiMo for Next Generation Wireless Systems” 2014 paper);

  1. mMiMo designed for TDD, but works at some performance penalty for FDD.
  2. mMiMo will really be deployable at low total cost of ownership (i.e., it is not enough that the antenna system itself is low cost!).
  3. mMiMo performance leap frog comes at the price of high computational complexity (e.g., should be factored into the deployment cost).
  4. mMiMo relies on distributed processing algorithms which at this scale is relative un-exploited territory (i.e., should be factored into the deployment cost).

But wait a minute! I might (naively) theorize away additional operational cost of the active electronics and antenna systems on the 5G cell site (overlaid on legacy already present!). I might further assume that the Capex of the 5G radio & antenna system can be financed within the regular modernization budget (assuming such a budget exists). But … But surely our access and core transport networks have not been scaled for a factor 10 – 20 (and possibly a lot more than that) in crease in throughput per active customer?

No it has not! Really Not!

Though some modernized converged Telcos might be a lot better positioned for thefixed broadband transformation required to sustain the 5G speed promise.

For most mobile operators, it is highly likely that substantial re-design and investments of transport networks will have to be made in order to support the 5G target performance increase above and beyond LTE.

Definitely a lot more on this topic in a subsequent Blog.

ON THE 5G PROMISES.

Lets briefly examine the 8 above 5G promises or visionary statements and how these impact the underlying economics. As this is an introductory chapter, the deeper dive and analysis will be referred to subsequent chapters.

NEED FOR SPEED.

PROMISE 1: From 1 to 10 Gbps in actual experienced 5G speed per connected device (at a max. of 10 ms round-trip time).

PROMISE 2: Minimum of 50 Mbps per user connection everywhere (at a max. of 10 ms round-trip time).

PROMISE 3: Thousand times more bandwidth per unit area (compared to LTE).

Before anything else, it would be appropriate to ask a couple of questions;

“Do I need this speed?” (The expert answer if you are living inside the Telecom bubble is obvious! Yes Yes Yes ….Customer will not know they need it until they have it! …).

“that kind of sustainable speed for what?” (Telekom bubble answer would be! Lots of useful things! … much better video experience, 4K, 8K, 32K –> fully emerged holographic VR experience … Lots!)

“am I willing to pay extra for this vast improvement in my experience?” (Telekom bubble answer would be … ahem … that’s really a business model question and lets just have marketing deal with that later).

What is true however is:

My objective measurable 5G customer experience, assuming the speed-coverage-reliability promise is delivered, will quantum leap to un-imaginable levels (in terms of objectively measured performance increase).

Maybe more importantly, will the 5G customer experience from the very high speed and very low latency really be noticeable to the customer? (i.e, the subjective or perceived customer experience dimension).

Let’s ponder on this!

In Europe end of 2016, the urban LTE speed and latency user experience per connection would of course depend on which network the customer would be (not all being equal);

lte performance 2016

In 2016 on average in Europe an urban LTE user, experienced a DL speed of 31±9 Mbps, UL speed of 9±2 Mbps and latency around 41±9 milliseconds. Keep in mind that OpenSignal is likely to be closer to the real user’s smartphone OTT experience, as it pings a server external to the MNOs network. It should also be noted that although the OpenSignal measure might be closer to the real customer experience, it still does not provide the full experience from for example page load or video stream initialization and start.

The 31 Mbps urban LTE user experience throughput provides for a very good video streaming experience at 1080p (e.g., full high definition video) even on a large TV screen. Even a 4K video stream (15 – 32 Mbps) might work well, provided the connection stability is good and that you have the screen to appreciate the higher resolution (i.e., a lot bigger than your 5” iPhone 7 Plus). You are unlikely to see the slightest difference on your mobile device between the 1080p (9 Mbps) and 480p (1.0 – 2.3 Mbps) unless you are healthy young and/or with a high visual acuity which is usually reserved for the healthy & young.

With 5G, the DL speed is targeted to be at least 1 Gbps and could be as high as 10 Gbps, all delivered within a round trip delay of maximum 10 milliseconds.

5G target by launch (in 2020) is to deliver at least 30+ times more real experienced bandwidth (in the DL) compared to what an average LTE user would experience in Europe 2016. The end-2-end round trip delay, or responsiveness, of 5G is aimed to be at least 4 times better than the average experienced responsiveness of LTE in 2016. The actual experience gain between LTE and 3G has been between 5 – 10 times in DL speed, approx. 3 –5 times in UL and between 2 to 3 times in latency (i.e., pinging the same server exterior to the mobile network operator).

According with Sandvine’s 2015 report on “Global Internet Phenomena Report for APAC & Europe”, in Europe approx. 46% of the downstream fixed peak aggregate traffic comes from real-time entertainment services (e.g., video & audio streamed or buffered content such as Netflix, YouTube and IPTV in general). The same report also identifies that for Mobile (in Europe) approx. 36% of the mobile peak aggregate traffic comes from real-time entertainment. It is likely that the real share of real-time entertainment is higher, as video content embedded in social media might not be counted in the category but rather in Social Media. Particular for mobile, this would bring up the share with between 10% to 15% (more in line with what is actually measured inside mobile networks). Real-time entertainment and real-time services in general is the single most important and impacting traffic category for both fixed and mobile networks.

Video viewing experience … more throughput is maybe not better, more could be useless.

Video consumption is a very important component of real-time entertainment. It amounts to more than 90% of the bandwidth consumption in the category. The Table below provides an overview of video formats, number of pixels, and their network throughput requirements. The tabulated screen size is what is required (at a reasonable viewing distance) to detect the benefit of a given video format in comparison with the previous. So in order to really appreciate 4K UHD (ultra high definition) over 1080p FHD (full high definition), you would as a rule of thumb need double the screen size (note there are also other ways to improved the perceived viewing experience). Also for comparison, the Table below includes data for mobile devices, which obviously have a higher screen resolution in terms of pixels per inch (PPI) or dots per inch (DPI). Apart from 4K (~8 MP) and to some extend  8K (~33 MP), the 16K (~132 MP) and 32K (~528 MP) are still very yet exotic standards with limited mass market appeal (at least as of now).

video resolution vs bandwitdh requirements

We should keep in mind that there are limits to the human vision with the young and healthy having a substantial better visual acuity than what can be regarded as normal 20/20 vision. Most magazines are printed at 300 DPI and most modern smartphone displays seek to design for 300 DPI (or PPI) or more. Even Steve Jobs has addressed this topic;

steve-jobs-300-ppi-human-limit

However, it is fair to point out that  this assumed human vision limitation is debatable (and have been debated a lot). There is little consensus on this, maybe with the exception that the ultimate limit (at a distance of 4 inch or 10 cm) is 876 DPI or approx. 300 DPI (at 11.5 inch / 30 cm).

Anyway, what really matters is the customers experience and what they perceive while using their device (e.g., smartphone, tablet, laptop, TV, etc…).

So lets do the visual acuity math for smartphone like displays;

viewing distance vs display size

We see (from the above chart) that for an iPhone 6/7 Plus (5.5” display) any viewing distance above approx. 50 cm, a normal eye (i.e., 20/20 vision) would become insensitive to video formats better than 480p (1 – 2.3 Mbps). In my case, my typical viewing distance is ca. 30+ cm and I might get some benefits from 720p (2.3 – 4.5 Mbps) as opposed to 480p. Sadly my sight is worse than the norm of 20/20 (i.e., old! and let’s just leave it at that!) and thus I remain insensitive to the resolution improvements 720p would provide. If you have a device with at or below 4” display (e.g., iPhone 5 & 4) the viewing distance where normal eyes become insensitive is ca. 30+ cm.

All in all, it would appear that unless cellular user equipment, and the way these are being used, changes very fundamentally the 480p to 720p range might be more than sufficient.

If this is true, it also implies that a cellular 5G user on a reliable good network connection would need no more than 4 – 5 Mbps to get an optimum viewing (and streaming) experience (i.e., 720p resolution).

The 5 Mbps streaming speed, for optimal viewing experience, is very far away from our 5G 1-Gbps promise (x200 times less)!

Assuming instead of streaming we want to download movies, assuming we lots of memory available on our device … hmmm … then a typical 480p movie could be download in ca. 10 – 20 seconds at 1Gbps, a 720p movie between 30 and 40 seconds, and a 1080p would take 40 to 50 seconds (and likely a waste due to limitations to your vision).

However with a 5G promise of super reliable ubiquitous coverage, I really should not need to download and store content locally on storage that might be pretty limited.

Downloads to cellular devices or home storage media appears somewhat archaic. But would benefit from the promised 5G speeds.

I could share my 5G-Gbps with other users in my surrounding. A typical Western European household in 2020 (i.e., about the time when 5G will launch) would have 2.17 inhabitants (2.45 in Central Eastern Europe), watching individual / different real-time content would require multiples of the bandwidth of the optimum video resolution. I could have multiple video streams running in parallel, to likely the many display devices that will be present in the consumer’s home, etc… Still even at fairly high video streaming codecs, a consumer would be far away from consuming the 1-Gbps (imagine if it was 10 Gbps!).

Okay … so video consumption, independent of mobile or fixed devices, does not seem to warrant anywhere near the 1 – 10 Gbps per connection.

Surely EU Commission wants it!

EU Member States have their specific broadband coverage objectives – namely: ‘Universal Broadband Coverage with speeds at least 30 Mbps by 2020’ (i.e, will be met by LTE!) and ‘Broadband Coverage of 50% of households with speeds at least 100 Mbps by 2020 (also likely to be met with LTE and fixed broadband means’.

The European Commission’s “Broadband Coverage in Europe 2015” reports that 49.2% of EU28 Households (HH) have access to 100 Mbps (i.e., 50.8% of all HH have access to less than 100 Mbps) or more and 68.2% to broadband speeds above 30 Mbps (i.e., 32.8% of all HH with access to less than 30 Mbps). No more than 20.9% of HH within EU28 have FTTP (e.g., DE 6.6%, UK UK 1.4%, FR 15.5%, DK 57%).

The EU28 average is pretty good and in line with the target. However, on an individual member state level, there are big differences. Also within each of the EU member states great geographic variation is observed in broadband coverage.

Interesting, the 5G promises to per user connection speed (1 – 10 Gbps), coverage (user perceived 100%) and reliability (user perceived 100%) is far more ambitious that the broadband coverage objectives of the EU member states.

So maybe indeed we could make the EU Commission and Member States happy with the 5G Throughput promise. (this point should not be underestimated).

Web browsing experience … more throughput and all will be okay myth!

So … Surely, the Gbps speeds can help provide a much faster web browsing / surfing experience than what is experienced today for LTE and for the fixed broadband? (if there ever was a real Myth!).

In other words the higher the bandwidth, the better the user’s web surfing experience should become.

While bandwidth (of course) is a factor in customers browsing experience, it is but a factor out of several that also governs the customers real & perceived internet experience; e.g., DNS Lookups (this can really mess up user experience), TCP, SSL/TLS negotiation, HTTP(S) requests, VPN, RTT/Latency, etc…

An excellent account of these various effects is given by Jim Getty’s “Traditional AQM is not enough” (i.e., AQM: Active Queue Management). Measurements (see Jim Getty’s blog) strongly indicates that at a given relative modest bandwidth (>6+ Mbps) there is no longer any noticeable difference in page load time. In my opinion there are a lot of low hanging fruits in network optimization that provides large relative improvements in customer experience than network speed alone..

Thus one might carefully conclude that, above a given throughput threshold it is unlikely that more throughput would have a significant effect on the consumers browsing experience.

More work needs to be done in order to better understand the experience threshold after which more connection bandwidth has diminishing returns on the customer’s browsing experience. However, it would appear that 1-Gbps 5G connection speed would be far above that threshold. An average web page in 2016 was 2.2 MB which from an LTE speed perspective would take 568 ms to load fully provided connection speed was the only limitation (which is not the case). For 5G the same page would download within 18 ms assuming that connection speed was the only limitation.

Downloading content (e.g., FTTP). 

Now we surely are talking. If I wanted to download the whole Library of the US Congress (I like digital books!), I am surely in need for speed!?

The US Congress have estimated that the whole print collection (i.e., 26 million books) adds up to 208 terabytes.Thus assuming I have 208+ TB of storage, I could within 20+ (at 1 Gbps) to 2+ (at 20 Gbps) days download the complete library of the US Congress.

In fact, at 1 Gbps would allow me to download 15+ books per second (assuming 1 book is on average 3oo pages and formatted at 600 DPI TIFF which is equivalent to ca. 8 Mega Byte).

So clearly, for massive file sharing (music, videos, games, books, documents, etc…), the 5G speed promise is pretty cool.

Though, it does assume that consumers would continue to see a value in storing information locally on their personally devices or storage medias. The idea remains archaic, but I guess there will always be renaissance folks around.

What about 50 Mbps everywhere (at a 10 ms latency level)?

Firstly, providing a customers with a maximum latency of 10 ms with LTE is extremely challenging. It would be highly unlikely to be achieved within existing LTE networks, particular if transmission retrials are considered. From OpenSignal December 2016 measurements shown in the chart below, for urban areas across Europe, the LTE latency is on average around 41±9 milliseconds. Considering the LTE latency variation we are still 3 – 4 times away from the 5G promise. The country average would be higher than this. Clearly this is one of the reasons why the NGMN whitepaper proposes a new air-interface. As well as some heavy optimization and redesigns in general across our Telco networks.

urban lte latency 2016

The urban LTE persistent experience level is very reasonable but remains lower than the 5G promise of 50 Mbps, as can be seen from the chart below;

urban lte dl speed

The LTE challenge however is not the customer experience level in urban areas but on average across a given geography or country. Here LTE performs substantially worse (also on throughput) than what the NGMN whitepaper’s ambition is. Let us have a look at the current LTE experience level in terms of LTE coverage and in terms of (average) speed.

LTE household coverage

Based on European Commission “Broadband Coverage in Europe 2015” we observe that on average the total LTE household coverage is pretty good on an EU28 level. However, the rural households are in general underserved with LTE. Many of the EU28 countries still lack LTE consistent coverage in rural areas. As lower frequencies (e.g., 700 – 900 MHz) becomes available and can be overlaid on the existing rural networks, often based on 900 MHz grid, LTE rural coverage can be improved greatly. This economically should be synchronized with the normal modernization cycles. However, with the current state of LTE (and rural network deployments) it might be challenging to reach a persistent level of 50 Mbps per connection everywhere. Furthermore, the maximum 10 millisecond latency target is highly unlikely to be feasible with LTE.

In my opinion, 5G would be important in order to uplift the persistent throughput experience to at least 50 Mbps everywhere (including cell edge). A target that would be very challenging to reach with LTE in the network topologies deployed in most countries (i.e., particular outside urban/dense urban areas).

The customer experience value to the general consumer of a maximum 10 millisecond latency is in my opinion difficult to assess. At a 20 ms response time would most experiences appear instantaneous. The LTE performance of ca. 40 ms E2E external server response time, should satisfy most customer experience use case requirements beside maybe VR/AR.

Nevertheless, if the 10 ms 5G latency target can be designed into the 5G standard without negative economical consequences then that might be very fine as well.

Another aspect that should be considered is the additional 5G market potential of providing a persistent 50 Mbps service (at a good enough & low variance latency). Approximately 70% of EU28 households have at least a 30 Mbps broadband speed coverage. If we look at EU28 households with at least 50 Mbps that drops to around 55% household coverage. With the 100% (perceived)coverage & reliability target of 5G as well as 50 Mbps everywhere, one might ponder the 30% to 45% potential of households that are likely underserved in term of reliable good quality broadband. Pending the economics, 5G might be able to deliver good enough service at a substantial lower cost compared more fixed centric means.

Finally, following our expose on video streaming quality, clearly a 50 Mbps persistent 5G connectivity would be more than sufficient to deliver a good viewing experience. Latency would be less of an issue in the viewing experience as longs as the variation in the latency can be kept reasonable low.


Acknowledgement

I greatly acknowledge my wife Eva Varadi for her support, patience and understanding during the creative process of creating this Blog.


WORTHY 5G & RELATED READS.

  1. “NGMN 5G White Paper” by R.El Hattachi & J. Erfanian (NGMN Alliance, February 2015).
  2. “Understanding 5G: Perspectives on future technological advancement in mobile” by D. Warran & C. Dewar (GSMA Intelligence December 2014).
  3. “Fundamentals of 5G Mobile Networks” by J. Rodriguez (Wiley 2015).
  4.  “The 5G Myth: And why consistent connectivity is a better future” by William Webb (2016).
  5. “Software Networks: Virtualization, SDN, 5G and Security”by G. Pujolle (Wile 2015).
  6. “Large MiMo Systems” by A. Chockalingam & B. Sundar Rajan (Cambridge University Press 2014).
  7. “Millimeter Wave Wireless Communications” by T.S. Rappaport, R.W. Heath Jr., R.C. Daniels, J.N. Murdock (Prentis Hall 2015).
  8. “The Limits of Human Vision” by Michael F. Deering (Sun Microsystems).
  9. “Quad HD vs 1080p vs 720p comparison: here’s what’s the difference” by Victor H. (May 2014).
  10. “Broadband Coverage in Europe 2015: Mapping progress towards the coverage objectives of the Digital Agenda” by European Commission, DG Communications Networks, Content and Technology (2016).