Mobile Data-centric Price Plans – An illustration of the De-composed.

Advertisements

How much money would it take for you to give up internet? …for the rest of your life? … and maybe much more important; How much do you want to pay for internet? The following cool video URL “Would you give up the Internet for 1 Million Dollars” hints towards both of those questions and an interesting paradox!

The perception of value is orders of magnitude higher than the willingness to pay, i.e.,

“I would NOT give up Internet for life for a Million+ US Dollars … oh … BUT… I don’t want to pay more than a couple of bucks for it either” (actually for a mature postpaid-rich market the chances are that over your expected life-time you will pay between 30 to 40 thousand US$ for mobile internet & voice & some messaging).

Price plans are fascinating! … Particular the recent data-centric price plans bundling in legacy services such as voice and SMS.

Needles to say that a consumer today often needs an advanced degree in science to really understand the price plans they are being presented. A high degree of trust is involved in choosing a given plan. The consumer usually takes what has been recommended by the shop expert (who most likely doesn’t have an advanced science degree either). This shop expert furthermore might (or might not) get a commission (i.e., a bonus) selling you a particular plan and thus in such a case hardly is the poster child of objectiveness.

How does the pricing experts come to the prices that they offer to the consumer? Are those plans internally consistent … or  maybe not?

It becomes particular interesting to study data-centric price plans that try to re-balance Mobile Voice and SMS.

How is 4G (i.e., in Europe also called LTE) being charged versus “normal” data offerings in the market? Do the mobile consumer pay more for Quality? Or maybe less?

What is the real price of mobile data? … Clearly, it is not the price we pay for a data-centric price plan.

A Data-centric Tale of a Country called United & a Telecom Company called Anything Anywhere!

As an example of mobile data pricing and in particular of data-centric mobile pricing with Voice and SMS included, I looked at a Western European Market (let’s call it United) and a mobile operator called Anything Anywhere. Anything Anywhere (AA) is known for its comprehensive & leading-edge 4G network as well as several innovative product ideas around mobile broadband data.

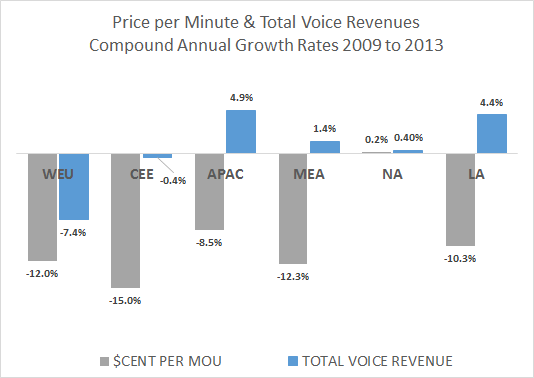
In my chosen Western European country United, voice revenues have rapidly declined over the last 5 years. Between 2009 to 2014 mobile voice revenues lost more than 36% compared to an overall revenue loss of “only” 14%. This corresponds to a compounded annual growth rate of minus 6.3% over the period. For an in depth analysis of the incredible mobile voice revenue losses the mobile industry have incurred in recent years see my blog “The unbearable lightness of mobile voice”.

Did this market experience a massive uptake in prepaid customers? No! Not at all … The prepaid share of the customer base went from ca. 60% in 2009 to ca. 45% in 2014. So in other words the Postpaid base over the period had grown with 15% and in 2014 was around 55%. This should usually have been a cause for great joy and incredible boost in revenues. United is also a market that has largely managed not to capitalize economically on substantial market consolidation.

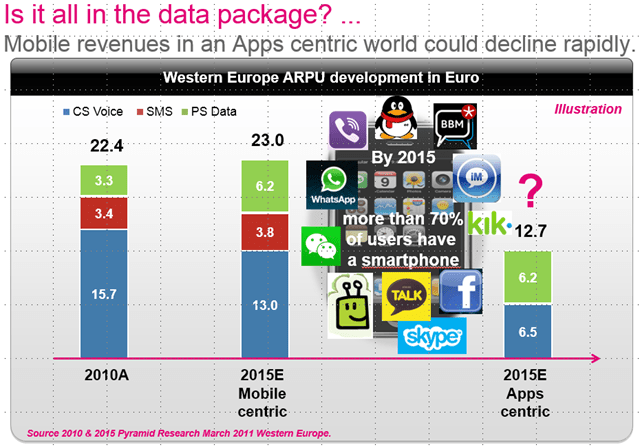
As it is with many other mobile markets, engaging & embracing the mobile broadband data journey has been followed by a sharp decline in the overall share of voice revenue from ca. 70% in 2009 to ca. 50% in 2014. An ugly trend when the total mobile revenue declines as well.

The Smartphone penetration in United as of Q1 2014 was ca. 71% with 32% iOS-based devices. Compare this to 2009 where the smartphone penetration was ca. 21% with iOS making out around 75+%.

Our Mobile Operator AA has the following price plan structure (note: all information is taken directly from AA’s web site and can be found back if you guess which company it applies to);

  • Data-centric price plans with unlimited Voice and SMS.
  • Differentiated speed plans, i.e., 4G (average speed advertised to 12 – 15 Mbps) vs. Double Speed 4G (average speed advertised to 24 – 30 Mbps).
  • Offer plans that apply Europe Union-wide.
  • Option to pay less for handsets upfront but more per month (i.e., particular attractive for expensive handsets such as iPhone or Samsung Galaxy top-range models).
  • Default offering is 24 month although a shorter period is possible as well.
  • Offer SIM-only data-centric with unlimited voice & SMS.
  • Offer Data-only SIM-only plans.
  • Further you will get access to extensive “WiFi Underground”. Are allowed tethering and VoIP including Voice-calling over WiFi.

So here is an example of AA’s data-centric pricing for various data allowances. In this illustration I have chosen to add an iPhone 6 Plus (why? well I do love that phone as it largely replaces my iPad outside my home!) with 128GB storage. This choice have no impact on the fixed and variable parts of the respective price plans. For SIM-Only plans in the data below, I have added the (Apple) retail price of the iPhone 6 Plus (light grey bars). This is to make the comparison somewhat more comparable. It should of course be clear that in the SIM-only plans, the consumer is not obliged to buy a new device.

tco 24 month

  • Figure above: illustrates the total consumer cost or total price paid over the period (in local currency) of different data plans for our leading Western European Mobile Operator AA. The first 9 plans shown above includes a iPhone 6 Plus with 128GB memory. The last 5 are SIM only plans with the last 2 being Data-only SIM-only plans. The abbreviations are the following PPM: Pay per Month (but little upfront for terminal), PUF: Pay UpFront (for terminal) and less per month, SIMO: SIM-Only plan, SIMDO: SIM Data-Only plan, xxGB: The xx amount of Giga Bytes offered in Plan, 2x indicates double 4G speed of “normal” and 1x indicates “normal” speed, 1st UL indicates unlimited voice in plan, 2nd UL indicates unlimited SMS in plan, EU indicates that the plan also applies to countries in EU without extra charges. So PPM20GB2xULULEU defines a Pay per Month plan (i.e., the handset is pay over the contract period and thus leads to higher monthly charges) with 20 GB allowance at Double (4G) Speed with Unlimited Voice and Unlimited SMS valid across EU. In this plan you would pay 100 (in local currency) for a iPhone 6 Plus with 128 GB. Note the local Apple Shop retail price of an iPhone 6 Plus with 128 GB is around 789 in local currency (of which ca. 132 is VAT) for this particular country. Note: for the SIM-only plans (i.e., SIMO & SIMDO) I have added the Apple retail price of a iPhone 6 Plus 128GB. It furthermore should be pointed out that the fixed service fee and the data consumption price does not vary with choice of handset.

If I decide that I really want that iPhone 6 Plus and I do not want to pay the high price (even with discounts) that some price plans offers. AA offers me a 20GB 4G data-plan, pay 100 upfront for the iPhone 6 Plus (with 128 GB memory) and for the next 24 month 63.99 (i.e., as this feels much cheaper than paying 64) per month. After 24 month my total cost of the 20 GB would be 1,636. I could thus save 230 over the 24 month if I wanted to pay 470 (+370 compared to previous plan & – 319 compared to Apple retail price) for the iPhone. In this lower cost plan my monthly cost of the 20 GB would be 38.99 or 25 (40%!) less on a monthly basis.

The Analysis show that a “Pay-less-upfront-and-more-per-month” subscriber would end up after the 24 month having paid at least ca. 761 for the iPhone 6 Plus (with 128GB). We will see later, that the total price paid for the iPhone 6 Plus however is likely to be approximately 792 or slightly above today’s retail price (based on Apple’s pricing).

The Price of a Byte and all that Jazz

So how does the above data-price plans look like in terms of Price-per-Giga-Byte?

Although in most cases not be very clear to the consumer, the data-centric price plan is structured around the price of the primary data allowance (i.e., the variable part) and non-data related bundled services included in the plan (i.e., the fixed service part representing non-data items).

There will be a variable price reflecting the data-centric price-plans data allowance and a “Fixed” Service Fee that capture the price of bundled services such as voice and SMS. Based on total price of the data-centric price plan, it will often appear that the higher the allowance the cheaper does your unit-data “consumption” (or allowance) become. Indicating that volume discounts have been factored into the price-plan. In other words, the higher the data allowance the lower the price per GB allowance.

This is often flawed logic and simply an artefact of the bundled non-data related services being priced into the plan. However, to get to that level of understanding requires a bit of analysis that most of us certainly don’t do before a purchase.

  • Figure above: Illustrates the unit-price of a Giga Byte (GB) versus AA’s various data-centric price plans. Note the price plans can be decomposed into a variable data-usage attributable price (per GB) and a fixed service fee that accounts for non-data services blended into the price. The Data Consumption per GB is the variable data-usage dependable part of the Price Plan and the Total price per GB is the full price normalized to the plans data consumption allowance.

So with the above we have argued that the total data-centric price can be written as a fixed and a variable part;

As will be described in more detail below, the data-centric price is structured in what can be characterized as a “Fixed Service Fee”  and a variable “Data Consumption Price that depends on a given price-plan’s data allowance (i.e., GB is Giga Byte). The “Data Consumption Price is variable in nature and while it might be a complex (i.e. in terms of complexity) function of data allowance it typically be of the form with the exponent (i.e., Beta) being 1 or close to 1. In other words the Data Consumptive price is a linear (or approximately so) function of the data allowance. In case is larger than 1, data pricing gets progressively more expensive with increasing allowance (i.e., penalizing high consumption or as I believe right-costing high consumption). For lower than 1, data gets progressively cheaper with increasing data allowances corresponding to volume discounts with the danger of mismatching the data pricing with the cost of delivering the data.

The “Fixed Service Fee” depends on all the non-data related goodies that are added to the data-centric price plan, such as (a) unlimited voice, (b) unlimited SMS, (c) Price plan applies Europe-wide (i.e., EU-Option), (d) handset subsidy recovery fee, (e) maybe a customer management fee, etc..

For most price data-centric plan, If the data-centric price divided by the allowance would be plotted against the allowance in a Log-Log format would result in a fairly straight-line.

Nothing really surprising given the pricing math involved! It is instructive to see what actually happens when we take a data-centric price and divide by the corresponding data allowance;

For very large data allowances the price-centric per GB would asymptotically converge to , i.e., the unit cost of a GB. As is usually a lot smaller than , we see that there is another limit, where the allowance is relative low, where we would see the data-centric pricing per GB slope (in a Log-Log plot) become linear in the data allowance. Typically for allowances from 0.1 GB up towards 50 GB, non-linear slope of approximately -0.7±0.1 is observed and thus in between the linear and the constant pricing regime.

We can also observe that If the total price, of a data-centric price plan associated with a given data allowance (i.e., GB), is used to derive a price-per-GB, one would conclude that most mobile operators provide the consumer with volume discounts as they adapt higher data allowance plans. The GB gets progressively cheaper for higher usage plans. As most data-centric price plans are in the range where is (a lot) smaller than , it will appear that the unit price of data declines as the data allowance increases. However in most cases it is likely an artefact of the Fixed Service Fee that reflects non-data related services which unless a data-only bundle can be a very substantial part of the data-centric price plan.

It is clear that data-allowance normalizing the totality of a data-centric price plan, particular when non-data services have been blended into the plan, will not reveal the real price of data. If used for assessing, for example, data profitability or other mobile data related financial KPIs this approach might be of very little use.

  • Figure above: illustrates the basic characteristics of a data-centric price plan normalized by the data allowance. The data for this example reflects the AA’s data-centric price plans 2x4G Speed with bundled unlimited Voice & SMS as well as applying EU-wide. We see that the Beta value corresponds to a Volume Discount (at values lower than 1) or a Volume Penalty (at values higher than 1).

Oh yeah! … The really “funny” part of most data-price plan analysis (including my own past ones!) are they are more likely to reflect the Fixed Service Part (independent of the Data allowance) of the Data-centric price plan than the actual unit price of mobile data.

What to expect from AA’s data-centric price plans?

so in a rational world of data-centric pricing (assuming such exist) what should we expect of Anything Anywhere’s price plans as advertised online;

  • The (embedded) price for unlimited voice would be the same irrespective of the data plan’s allowed data usage (i.e., unlimited Voice does not depend on data plan).
  • The (embedded) price for unlimited SMS would be the same irrespective of the data plan’s allowed data usage (i.e., unlimited SMS does not depend on data plan).
  • You would pay more for having your plan extended to apply across Europe Union compared to not having this option.
  • You would (actually you should) expect to pay more per Mega Byte for the Double Speed option as compared to the Single Speed Option.
  • If you decide to “finance” your handset purchase (i.e., pay less upfront option) within a data plan you should expect to pay more on a monthly basis.
  • Given a data plan has a whole range of associated handsets priced From Free (i.e., included in plan without extra upfront charge) to high-end high-priced Smartphones, such as iPhone 6 Plus 128 GB, you would not expect that handset related cost would have been priced into the data plan. Or if it is, it must be the lowest common denominator for the whole range of offered handsets at a given price plan.
  • Where the discussion becomes really interesting is how your data consumption should be priced; (1) You pay more per unit of data consumption as you consume more data on a monthly basis, (2) You pay the same per unit irrespective of your consumption or (3) You should have a volume discount making your units cheaper the more you consume.

of course the above is if and only if the price plans have been developed in reasonable self-consistent manner.

  • Figure above: Illustrates AA’s various data-centric price plans (taken from their web site). Note that PPM represents low upfront (terminal) cost for the consumer and higher monthly cost and PUF represent paying upfront for the handset and thus having lower monthly costs as a consequence. The Operator AA allows the consumer in the PPM Plan to choose for an iPhone 6 Plus 128GB (priced at 100 to 160) or an IPhone 6 Plus 64GB option (at a lower price of course).

First note that Price Plans (with more than 2 data points) tend to be linear with the Data Usage allowance.

The Fixed Service Fee – The Art of Re-Capture Lost legacy Value?

In the following I define the Fixed Service Fee as the part of the total data-centric price plan that is independent of a given plan’s data allowance. The logic is that this part would contain all non-data related cost such as Unlimited Voice, Unlimited SMS, EU-Option, etc..

From AA’s voice plan (for 250 Minutes @ 10 per Month & 750 Minutes @ 15 per Month) with unlimited SMS (& no data) it can be inferred that

  • Price of Unlimited SMS can be no higher than 7.5. This however is likely also include general customer maintenance cost.

Monthly customer maintenance cost (cost of billing, storage, customer care & systems support, etc.) might be deduced from the SIM-Only Data-Only package and would be

  • Price of Monthly Customer Maintenance could be in the order of 5, which would imply that the Unlimited SMS price would be 2.5. Note the market average Postpaid SMS ARPU in 2014 was ca., 8.40 (based on Pyramid Research data). The market average number of postpaid SMS per month was ca. 273 SMS.

From AA’s SIM-only plan we get that the fixed portion of providing service (i.e., customer maintenance, unlimited Voice & SMS usage) is 14 and thus

  • Price of Unlimited Voice should be approximately 6.5. Note the market average Postpaid Voice ARPU was ca. 12 (based on Pyramid Research data). The market average voice usage per month was ca. 337 minutes. Further from the available limited voice price plans it can be deduced that unlimited voice must be higher than 1,000 Minutes or more than 3 times the national postpaid average.

The fixed part of the data-centric pricing difference between the data-centric SIM-only plan and similar data-centric plan including a handset (i.e., all services are the same except for the addition of the handset) could be regarded as a minimum handset financing cost allowing the operator to recover some of the handset subsidy

  • Equipment subsidy recovery cost of 7 (i.e., over a 24 month period this amounts to 168 which is likely to recover the average handset subsidy). Note is the customer chooses to pay little upfront for the handset, the customer would have to pay 26 extra per month in he fixed service fee. Thus low upfront cost result in another 624 over the 24 month contract period. Interestingly is that with the initial 7 for handset subsidy recovery in the basic fixed service fee a customer would have paid 792 in handset recovery over 24 month period the contract applies to (a bit more than the iPhone 6 Plus 128GB retail price).

The price for allowing the data-centric price-plan to apply Europe Union Wide is

  • The EU-Option (i.e., plan applicable within EU) appears to be priced at ca. 5 (caution: 2x4G vis-a-vis 1x4G could have been priced into this delta as well).

For EU-option price it should be noted here that the two plans that are being compared differs not only in the EU-option. The plan without the EU option is a data plan with “normal” 4G speed, while the EU-option plan supports double 4G speeds. So in theory the additional EU-option charge of 5 could also include a surcharge for the additional speed.

Why an operator would add the double speed to the fixed Service Fee price part is “bit” strange. The 2x4G speed price-plan option clearly is a variable trigger for cost (and value to the customer’s data usage). Thus should be introduced in the the variable part (i.e., the Giga-Byte dependent part) of the data-centric price plan.

It is assumed that indeed the derived difference can be attributed to the EU-option, i.e., the double speed has not been include in the monthly Fixed Service Fee.

In summary we get AA’s data-centric price plan’s monthly Fixed Service Fee de-composition as follows;

  • Figure above: shows the composition of the monthly fixed service fee as part of AA’s data-centric plans. Of course in a SIM-only scenario the consumer would not have the Handset Recovery Fee inserted in the price plan.

So irrespective of the data allowance a (postpaid) customer would pay between 26 to 52 per month depending on whether handset financing is chosen (i.e., Low upfront payment on the expense of higher monthly cost).

Mobile data usage still has to happen!

The price of Mobile Data Allowance.

The variable data-price in the studied date-centric price plans are summarized in the table below as well as the figure;

Price-plan

4G Speed

Price per GB

Pay Less Upfront More per Month

Double

0.61±0.03

Pay Upfront & Less per Month

Double

0.67±0.05

SIM-Only

Single

1.47±0.08

SIM-Only Data Only

Single

2 (only 2 data points)

The first thing that obviously should make you Stop in Wonder is that Single 4G Speed Giga Byte is more than Twice the price of a Double 4G Speed Giga Byte In need for speed … well that will give you a pretty good deal with AA’s price 2x4G plans.

Second thing to notice is that it would appear to be a really bad deal (with respect to the price-per-byte) to be a SIM-Only Data-Only customer.

The Data-Only pays 2 per GB. Almost 3 times more than if you would choose a subscription with a device, double speed, double unlimited and EU-wide applicable price plan.

Agreed! In absolute terms the SIM-only Data-only cost a lot less per month (9 less than the 20GB pay device upfront) and it is possible to run away after 12 months (versus the 24 month plans). One rationale for charging extra per Byte for a SIM-only Data-only plan could be that the SIM card might be used in Tablet or Data-card/Dongle products that typically does consume most if not all of a given plans allowance. For normal devices and high allowance plans on average the consumption can be quiet a lot lower than the actual allowance. Particular over a 24 month period.

You might argue that this is all about how the data-centric price plans have been de-composed in a fixed service fee (supposedly the non-data dependent component) and a data consumptive price. However, even when considering the full price of a given price plan is the Single-4G-Speed more expensive per Byte than Double-4G-Speed.

You may also argue that I am comparing apples and oranges (or even bananas pending taste) as the Double-4G-Speed plans include a devices and a price-plan that applies EU-wide versus the SIM-only plan that includes the customers own device and a price-plan that only works in United. All true of course … Why that should be more expensive to opt out of is a bit beyond me and why this should have an inflationary impact on the price-per-Byte … well a bit of a mystery as well.

At least there is no (statistical) difference in the variable price of a Giga Byte whether the customer chooses to pay of her device over the 24 month contract period or pay (most of) it upfront.

For AA it doesn’t seem to be of concern! …. As 88% would come back for more (according with their web site).

Obviously this whole analysis above make the big assumption that the data-centric price plans are somewhat rationally derived … this might not be the case!

and it assumes that rationally & transparently derived price plans are the best for the consumer …

and it assumes what is good for the consumer is also good for the company …

Is AA different in this respect to that of other Operators around the world …

No! AA is not different from any other incumbent operator coming from a mobile voice centric domain!

Acknowledgement

I greatly acknowledge my wife Eva Varadi for her support, patience and understanding during the creative process of creating this Blog.

Postscript – The way I like to look at (rational … what ever that means) data-centric pricing.

Firstly, it would appear that AA’s pricing philosophy follows the industry standard of pricing mobile services and in particular mobile data-centric services by the data volume allowance. Non-data services are added to the data-centric price plan and in all effect make up for the most part of the price-plan even at relative higher data allowances;

  • Figure above: illustrates the typical approach to price plan design in the Telecom’s industry. Note while not per se wrong it often overweight’s the volume element of pricing and often results in sub-optimizing the Quality and Product aspects . Source: Dr. Kim K Larsen’s Mind Share contribution at Informa’s LTE World Summit May 2012; “Right pricing LTE and mobile broadband in general (a Technologist’ Observations)”.

Unlimited Voice and SMS in AA’s standard data-centric plans clearly should mitigate possible loss or migration away from old fashion voice (i.e., circuit switched) and SMS. However both the estimated allowances for unlimited voice (6.5) and SMS (2.5) appear to be a lot lower than their classical standalone ARPUs for the postpaid category. This certainly could explain that this market (as many others in Western Europe) have lost massive amount of voice revenues over the last 5 years. In other words re-capturing or re-balancing legacy service revenues into data-centric plans still have some way to go in order to be truly effective (if at all possible which is highly questionable at this time and age).

As a Technologist, I am particular interested in how the technology cost and benefits are being considered in data-centric price plans.

The big challenge for the pricing expert who focus too much on volume is that the same volume can result from vastly different network qualities and speed. The customers handset will drive the experience of quality and certainly consumption. By that differences in network load and thus technology cost. A customer with a iPhone 6 Plus is likely to load the mobile data network more (and thus incur higher cost) than a customer with a normal screen smartphone of 1 or 2 generations removed from iPhone 6 Plus. It is even conceivable that a user with iPhone 6 Plus will load the network more than a customer with a normal iPhone 6 (independent of the iOS). This is very very different for Voice and SMS volumetric considerations in legacy price plans, where handset had little (or no) impact on network load relative to the usage.

For data-centric price plans to be consistent with the technology cost incurred one should consider;

  • Higher “guarantied” Quality, typically speed or latency, should be priced higher per Byte than lower quality plans (or at the very least not lower).
  • Higher Volumetric Allowances should be priced per Byte higher than Lower Volumetric Allowance (or at the very least not lower).
  • Offering unlimited Voice & SMS in data-centric plans (as well as other bundled goodies) should be carefully re-balanced to re-capture some of lost legacy revenues.

That AA’s data-centric plans for double speed appears to be cheaper than their plans at a lower data delivery quality level is not consistent with costing. Of course, AA cannot really guaranty that the customer will get double 4G speed everywhere and as such it may not be fair to charge substantially more than for single speed. However, this is of course not what appear to happen here.

AA’s lowest data unit price (in per Giga Byte) is around 0.6 – 0.7 (or 0.06 – 0.07 Cent per Mega Byte). That price is very low and in all likelihood lower than their actual production cost of a GB or MB.

However, one may argue that as long as the Total Service Revenue gained by a data-centric price plan recover the production cost, as well as providing a healthy margin then whether the applied data unit-price is designed to recover the data production cost is maybe less of an issue.

In other words, data profitability may not matter as much as overall profitability. This said it remains in my opinion in-excusable for a mobile operator not to understand its main (data) cost drivers and ensure it is recovered in their overall pricing strategies.

Surely! You may say? … “Surely Mobile Operators know their cost structure and respective cost drivers and their price plans reflects this knowledge?”

It is my observation that most price plans (data-centric or not) are developed primarily in response to competition (which of course is an important pricing element as well) rather than firmly anchored in Cost, Value & Profit considerations. Do Operators really & deeply know their own cost structure and cost drivers? … Ahhh … In my opinion few really appear to do!

The Unbearable Lightness of Mobile Voice.

Advertisements
  • Mobile data adaption can be (and usually is) very un-healthy for the mobile voice revenues.
  • A Mega Byte of Mobile Voice is 6 times more expensive than a Mega Byte of Mobile Data (i.e., global average) 
  • If customers would pay the Mobile Data Price for Mobile Voice, 50% of Global Mobile Revenue would Evaporate (based on 2013 data).
  • Classical Mobile Voice is not Dead! Global Mobile Voice Usage grew with more than 50% over the last 5 years. Though Global Voice Revenue remained largely constant (over 2009 – 2013). 
  • Mobile Voice Revenues declined in most Western European & Central Eastern European countries.
  • Voice Revenue in Emerging Mobile-Data Markets (i.e., Latin America, Africa and APAC) showed positive growth although decelerating.
  • Mobile Applications providing high-quality (often High Definition) mobile Voice over IP should be expected to dent the classical mobile voice revenues (as Apps have impacted SMS usage & revenue).
  • Most Western & Central Eastern European markets shows an increasing decline in price elasticity of mobile voice demand. Even some markets (regions) had their voice demand decline as the voice prices were reduced (note: not that causality should be deduced from this trend though).
  • The Art of Re-balancing (or re-capture) the mobile voice revenue in data-centric price plans are non-trivial and prone to trial-and-error (but likely also un-avoidable).

An Unbearable Lightness.

There is something almost perverse about how light the mobile industry tends to treat Mobile Voice, an unbearable lightness?

How often don’t we hear Telco Executives wish for All-IP and web-centric services for All? More and more mobile data-centric plans are being offered with voice as an after thought. Even though voice still constitute more than 60% of the Global Mobile turnover  and in many emerging mobile markets beyond that. Even though classical mobile voice is more profitable than true mobile broadband access. “Has the train left the station” for Voice and running off the track? In my opinion, it might have for some Telecom Operators, but surely not for all. Taking some time away from thinking about mobile data would already be an incredible improvement if spend on strategizing and safeguarding mobile voice revenues that still are a very substantial part of The Mobile Business Model.

Mobile data penetration is un-healthy for voice revenue. It is almost guarantied that voice revenue will start declining as the mobile data penetration reaches 20% and beyond. There are very few exceptions (i.e., Australia, Singapore, Hong Kong and Saudi Arabia) to this rule as observed in the figure below. Much of this can be explained by the Telecoms focus on mobile data and mobile data centric strategies that takes the mobile voice business for given or an afterthought … focusing on a future of All-IP Services where voice is “just” another data service. Given the importance of voice revenues to the mobile business model, treating voice as an afterthought is maybe not the most value-driven strategy to adopt.

I should maybe point out that this is not per se a result of the underlying Cellular All-IP Technology. The fact is that Cellular Voice over an All-IP network is very well specified within 3GPP. Voice over LTE (i.e., VoLTE), or Voice over HSPA (VoHSPA) for that matter, is enabled with the IP Multimedia Subsystem (IMS). Both VoLTE and VoHSPA, or simply Cellular Voice over IP (Cellular VoIP as specified by 3GPP), are highly spectral efficient (compared to their circuit switched equivalents). Further the Cellular VoIP can be delivered at a high quality comparable to or better than High Definition (HD) circuit switched voice. Recent Mean Opinion Score (MOS) measurements by Ericsson and more recently (August 2014) Signals Research Group & Spirent have together done very extensive VoLTE network benchmark tests including VoLTE comparison with the voice quality of 2G & 3G Voice as well as Skype (“Behind the VoLTE Curtain, Part 1. Quantifying the Performance of a Commercial VoLTE Deployment”). Further advantage of Cellular VoIP is that it is specified to inter-operate with legacy circuit-switched networks via the circuit-switched fallback functionality. An excellent account for Cellular VoIP and VoLTE in particular can be found in Miikki Poikselka  et al’s great book on “Voice over LTE” (Wiley, 2012).

Its not the All-IP Technology that is wrong, its the commercial & strategic thinking of Voice in an All-IP World that leaves a lot to be wished for.

Voice over LTE provides for much better Voice Quality than a non-operator controlled (i.e., OTT) mobile VoIP Application would be able to offer. But is that Quality worth 5 to 6 times the price of data, that is the Billion $ Question.

  • Figure Above: illustrates the compound annual growth rates (2009 to 2013) of mobile voice revenue and the mobile data penetration at the beginning of the period (i.e., 2009). As will be addressed later it should be noted that the growth of mobile voice revenues are NOT only depending on Mobile Data Penetration Rates but on a few other important factors, such as addition of new unique subscribers, the minute price and the voice arpu compared to the income level (to name a few). Analysis has been based on Pyramid Research data. Abbreviations: WEU: Western Europe, CEE: Central Eastern Europe, APAC: Asia Pacific, MEA: Middle East & Africa, NA: North America and LA: Latin America.

In the following discussion classical mobile voice should be understood as an operator-controlled voice service charged by the minute or in equivalent economical terms (i.e., re-balanced data pricing). This is opposed to a mobile-application-based voice service (outside the direct control of the Telecom Operator) charged by the tariff structure of a mobile data package without imposed re-balancing.

If the Industry would charge a Mobile Voice Minute the equivalent of what they charge a Mobile Mega Byte … almost 50% of Mobile Turnover would disappear … So be careful AND be prepared for what you wish for! 

There are at least a couple of good reasons why Mobile Operators should be very focused on preserving mobile voice as we know it (or approximately so) also in LTE (and any future standards). Even more so, Mobile Operators should try to avoid too many associations with non-operator controlled Voice-over-IP (VoIP) Smartphone applications (easier said than done .. I know). It will be very important to define a future voice service on the All-IP Mobile Network that maintains its economics (i.e., pricing & margin) and don’t get “confused” with the mobile-data-based economics with substantially lower unit prices & questionable profitability.

Back in 2011 at the Mobile Open Summit, I presented “Who pays for Mobile Broadband” (i.e., both in London & San Francisco) with the following picture drawing attention to some of the Legacy Service (e.g., voice & SMS) challenges our Industry would be facing in the years to come from the many mobile applications developed and in development;

One of the questions back in 2011 was (and Wow it still is! …) how to maintain the Mobile ARPU & Revenues at a reasonable level, as opposed to massive loss of revenue and business model sustainability that the mobile data business model appeared to promise (and pretty much still does). Particular the threat (& opportunities) from mobile Smartphone applications. Mobile Apps that provides Mobile Customers with attractive price-arbitrage compared to their legacy prices for SMS and Classical Voice.

IP killed the SMS Star” … Will IP also do away with the Classical Mobile Voice Economics as well?

Okay … Lets just be clear about what is killing SMS (it’s hardly dead yet). The Mobile Smartphone  Messaging-over-IP (MoIP) App does the killing. However, the tariff structure of an SMS vis-a-vis that of a mobile Mega Byte (i..e, ca. 3,000x) is the real instigator of the deed together with the shear convenience of the mobile application itself.

As of August 2014 the top Messaging & Voice over IP Smartphone applications share ca. 2.0+ Billion Active Users (not counting Facebook Messenger and of course with overlap, i.e., active users having several apps on their device). WhatsApp is the Number One Mobile Communications App with about 700 Million active users  (i.e., up from 600 Million active users in August 2014). Other Smartphone Apps are further away from the WhatsApp adaption figures. Applications from Viber can boast of 200+M active users, WeChat (predominantly popular in Asia) reportedly have 460+M active users and good old Skype around 300+M active users. The impact of smartphone MoIP applications on classical messaging (e.g., SMS) is well evidenced. So far Mobile Voice-over-IP has not visible dented the Telecom Industry’s mobile voice revenues. However the historical evidence is obviously no guaranty that it will not become an issue in the future (near, medium or far).

WhatsApp is rumoured to launch mobile voice calling as of first Quarter of 2015 … Will this event be the undoing of operator controlled classical mobile voice?  WhatsApp already has taken the SMS Scalp with 30 Billion WhatsApp messages send per day according the latest data from WhatsApp (January 2015). For comparison the amount of SMS send out over mobile networks globally was a bit more than 20 Billion per day (source: Pyramid Research data). It will be very interesting (and likely scary as well) to follow how WhatsApp Voice (over IP) service will impact Telecom operator’s mobile voice usage and of course their voice revenues. The Industry appears to take the news lightly and supposedly are unconcerned about the prospects of WhatsApp launching a mobile voice services (see: “WhatsApp voice calling – nightmare for mobile operators?” from 7 January 2015) … My favourite lightness is Vodacom’s (South Africa) “if anything, this vindicates the massive investments that we’ve been making in our network….” … Talking about unbearable lightness of mobile voice … (i.e., 68% of the mobile internet users in South Africa has WhatsApp on their smartphone).

Paying the price of a mega byte mobile voice.

A Mega-Byte is not just a Mega-Byte … it is much more than that!

In 2013, the going Global average rate of a Mobile (Data) Mega Byte was approximately 5 US-Dollar Cent (or a Nickel). A Mega Byte (MB) of circuit switched voice (i.e., ca. 11 Minutes @ 12.2kbps codec) would cost you 30+ US$-cent or about 6 times that of Mobile Data MB. Would you try to send a MB of SMS (i.e., ca. 7,143 of them) that would cost you roughly 150 US$ (NOTE: US$ not US$-Cents).

1 Mobile MB = 5 US$-cent Data MB < 30+ US$-cent Voice MB (6x mobile data) << 150 US$ SMS MB (3000x mobile data).

A Mega Byte of voice conversation is pretty un-ambiguous in the sense of being 11 minutes of a voice conversation (typically a dialogue, but could be monologue as well, e.g., voice mail or an angry better half) at a 12.2 kbps speech codec. How much mega byte a given voice conversation will translate into will depend on the underlying speech coding & decoding  (codec) information rate, which typically is 12.2 kbps or 5.9 kbps (i.e., for 3GPP cellular-based voice). In general we would not be directly conscious about speed (e.g., 12.2 kbps) at which our conversation is being coded and decoded although we certainly would be aware of the quality of the codec itself and its ability to correct errors that will occur in-between the two terminals. For a voice conversation itself, the parties that engage in the conversation is pretty much determining the duration of the conversation.

An SMS is pretty straightforward and well defined as well, i.e., being 140 Bytes (or characters). Again the underlying delivery speed is less important as for most purposes it feels that the SMS sending & delivery is almost instantaneously (though the reply might not be).

All good … but what about a Mobile Data Byte? As a concept it could by anything or nothing. A Mega Byte of Data is Extremely Ambiguous. Certainly we get pretty upset if we perceive a mobile data connection to be slow. But the content, represented by the Byte, would obviously impact our perception of time and whether we are getting what we believe we are paying for. We are no longer master of time. The Technology has taken over time.

Some examples: A Mega Byte of Voice is 11 minutes of conversation (@ 12.2 kbps). A Mega Byte of Text might take a second to download (@ 1 Mbps) but 8 hours to process (i.e., read). A Mega Byte of SMS might be delivered (individually & hopefully for you and your sanity spread out over time) almost instantaneously and would take almost 16 hours to read through (assuming English language and an average mature reader). A Mega Byte of graphic content (e.g., a picture) might take a second to download and milliseconds to process. Is a Mega Byte (MB) of streaming music that last for 11 seconds (@ 96 kbps) of similar value to a MB of Voice conversation that last for 11 minutes or a MB millisecond picture (that took a second to download).

In my opinion the answer should be clearly NO … Such (somewhat silly) comparisons serves to show the problem with pricing and valuing a Mega Byte. It also illustrates the danger of ambiguity of mobile data and why an operator should try to avoid bundling everything under the banner of mobile data (or at the very least be smart about it … whatever that means).

I am being a bit naughty in above comparisons, as I am freely mixing up the time scales of delivering a Byte and the time scales of neurological processing that Byte (mea culpa).


  • Figure Above: Logarithmic representation of the cost per Mega Byte of a given mobile service. 1 MB of Voice is roughly corresponding to 11 Minutes at a 12.2 voice codec which is ca. 25+ times the monthly global MoU usage. 1 MB of SMS correspond to ca. 7,143 SMSs which is a lot (actually really a lot). In USA 7,143 would roughly correspond to a full years consumption. However, in WEU 7,143 SMS would be ca. 6+ years of SMS consumption (on average) to about almost 12 years of SMS consumption in MEA Region. Still SMS remain proportionate costly and clear is an obvious service to be rapidly replaced by mobile data as it becomes readily available. Source: Pyramid Research.

The “Black” Art of Re-balancing … Making the Lightness more Bearable?

I recently had a discussion with a very good friend (from an emerging market) about how to recover lost mobile voice revenues in the mobile data plans (i.e., the art of re-balancing or re-capturing). Could we do without Voice Plans? Should we focus on All-in the Data Package? Obviously, if you would charge 30+ US$-cent per Mega Byte Voice, while you charge 5 US$-cent for Mobile Data, that might not go down well with your customers (or consumer interest groups). We all know that “window-dressing” and sleight-of-hand are important principles in presenting attractive pricings. So instead of Mega Byte voice we might charge per Kilo Byte (lower numeric price), i.e., 0.029 US$-cent per kilo byte (note: 1 kilo-byte is ca. 0.65 seconds @ 12.2 kbps codec). But in general the consumer are smarter than that. Probably the best is to maintain a per time-unit charge or to Blend in the voice usage & pricing into the Mega Byte Data Price Plan (and hope you have done your math right).

Example (a very simple one): Say you have 500 MB mobile data price plan at 5 US$-cent per MB (i.e., 25 US$). You also have a 300 Minute Mobile Voice Plan of 2.7 US$-cent a minute (or 30 US$-cent per MB). Now 300 Minutes corresponds roughly to 30 MB of Voice Usage and would be charged ca. 9$. Instead of having a Data & Voice Plan, one might have only the Data Plan charging (500 MB x 5 US$cent/MB + 30 MB x 30 US$/cent/MB) / 530 MB or 6.4 US$-cent per MB (or 1.4 US$-cent more for mobile voice over the data plan or a 30% surcharge for Voice on the Mobile Data Bytes). Obviously such a pricing strategy (while simple) does pose some price strategic challenges and certainly does not per se completely safeguard voice revenue erosion. Keeping Mobile Voice separately from Mobile Data (i.e., Minutes vs Mega Bytes) in my opinion will remain the better strategy. Although such a minutes-based strategy is easily disrupted by innovative VoIP applications and data-only entrepreneurs (as well as Regulator Authorities).

Re-balancing (or re-capture) the voice revenue in data-centric price plans are non-trivial and prone to trial-and-error. Nevertheless it is clearly an important pricing strategy area to focus on in order to defend existing mobile voice revenues from evaporating or devaluing by the mobile data price plan association.

Is Voice-based communication for the Masses (as opposed to SME, SOHO, B2B,Niche demand, …) technologically un-interesting? As a techno-economist I would say far from it. From the GSM to HSPA and towards LTE, we have observed a quantum leap, a factor 10, in voice spectral efficiency (or capacity), substantial boost in link-budget (i.e., approximately 30% more geographical area can be covered with UMTS as opposed to GSM in apples for apples configurations) and of course increased quality (i.e., high-definition or crystal clear mobile voice). The below Figure illustrates the progress in voice capacity as a function of mobile technology. The relative voice spectral efficiency data in the below figure has been derived from one of the best (imo) textbooks on mobile voice “Voice over LTE” by Miikki Poikselka et all (Wiley, 2012);

  • Figure Above: Abbreviation guide;  EFR: Enhanced Full Rate, AMR: Adaptive Multi-Rate, DFCA: Dynamic Frequency & Channel Allocation, IC: Interference Cancellation. What might not always be appreciate is the possibility of defining voice over HSPA, similar to Voice over LTE. Source: “Voice over LTE” by Miikki Poikselka et all (Wiley, 2012).

If you do a Google Search on Mobile Voice you would get ca. 500 Million results (note Voice over IP only yields 100+ million results). Try that on Mobile Data and “sham bam thank you mam” you get 2+ Billion results (and projected to increase further). For most of us working in the Telecom industry we spend very little time on voice issues and an over-proportionate amount of time on broadband data. When you tell your Marketing Department that a state-of-the-art 3G can carry at least twice as much voice traffic than state-of-the –art GSM (and over 30% more coverage area) they don’t really seem to get terribly exited? Voice is un-sexy!? an afterthought!? … (don’t even go brave and tell Marketing about Voice over LTE, aka VoLTE).

Is Mobile Voice Dead or at the very least Dying?

Is Voice un-interesting, something to be taken for granted?

Is Voice “just” data and should be regarded as an add-on to Mobile Data Services and Propositions?

From a Mobile Revenue perspective mobile voice is certainly not something to be taken for granted or just an afterthought. In 2013, mobile voice still amounted for 60+% of he total global mobile turnover, with mobile data taking up ca. 40% and SMS ca. 10%. There are a lot of evidence that SMS is dying out quickly with the emergence of smartphones and Messaging-over-IP-based mobile application (SMS – Assimilation is inevitable, Resistance is Futile!). Not particular surprising given the pricing of SMS and the many very attractive IP-based alternatives. So are there similar evidences of mobile voice dying?

NO! NIET! NEM! MA HO BU! NEJ! (not any time soon at least)

Lets see what the data have to say about mobile voice?

In the following I only provide a Regional but should there be interest I have very detailed deep dives for most major countries in the various regions. In general there are bigger variations to the regional averages in Middle East & Africa (i.e., MEA) as well as Asia Pacific (i.e., APAC) Regions, as there is a larger mix of mature and emerging markets with fairly large differences in mobile penetration rates and mobile data adaptation in general. Western Europe, Central Eastern Europe, North America (i.e., USA & Canada) and Latin America are more uniform in conclusions that can reasonably be inferred from the averages.

As shown in the Figure below, from 2009 to 2013, the total amount of mobile minutes generated globally increased with 50+%. Most of that increase came from emerging markets as more share of the population (in terms of individual subscribers rather than subscriptions) adapted mobile telephony. In absolute terms, the global mobile voice revenues did show evidence of stagnation and trending towards decline.


  • Figure Above: Illustrates the development & composition of historical Global Mobile Revenues over the period 2009 to 2013. In addition also shows the total estimated growth of mobile voice minutes (i.e., Red Solid Curve showing MoUs in units of Trillions) over the period. Sources: Pyramid Research & Statista. It should noted that various data sources actual numbers (over the period) are note completely matching. I have observed a difference between various sources of up-to 15% in actual global values. While interesting this difference does not alter the analysis & conclusions presented here.

If all voice minutes was charged with the current Rate of Mobile Data, approximately Half-a-Billion US$ would evaporate from the Global Mobile Revenues.

So while mobile voice revenues might not be a positive growth story its still “sort-of” important to the mobile industry business.

Most countries in Western & Central Eastern Europe as well as mature markets in Middle East and Asia Pacific shows mobile voice revenue decline (in absolute terms and in their local currencies). For Latin America, Africa and Emerging Mobile Data Markets in Asia-Pacific almost all exhibits positive mobile voice revenue growth (although most have decelerating growth rates).

  • Figure Above: Illustrates the annual growth rates (compounded) of total mobile voice revenues and the corresponding growth in mobile voice traffic (i.e., associated with the revenues). Some care should be taken as for each region US$ has been used as a common currency. In general each individual country within a region has been analysed based on its own local currency in order to avoid mixing up currency exchange effects. Source: Pyramid Research.

Of course revenue growth of the voice service will depend on (1) the growth of subscriber base, (2) the growth of the unit itself (i.e., minutes of voice usage) as it is used by the subscribers (i.e., which is likely influenced by the unit price), and (3) the development of the average voice revenue per subscriber (or user) or the unit price of the voice service. Whether positive or negative growth of Revenue results, pretty much depends on the competitive environment, regulatory environment and how smart the business is in developing its pricing strategy & customer acquisition & churn dynamics.

Growth of (unique) mobile customers obviously depends the level of penetration, network coverage & customer affordability. Growth in highly penetrated markets is in general (much) lower than growth in less mature markets.

  • Figure Above: Illustrates the annual growth rates (compounded) of unique subscribers added to a given market (or region). Further to illustrate the possible relationship between increased subscribers and increased total generated mobile minutes the previous total minutes annual growth is shown as well. Source: Pyramid Research.

Interestingly, particular for the North America Region (NA), we see an increase in unique subscribers of 11% per anno and hardly any growth over the  period of total voice minutes. Firstly, note that the US Market will dominate the averaging of the North America Region (i.e., USA and Canada) having approx. 13 times more subscribers. So one of the reasons for this no-minutes-growth effect is that the US market saw a substantial increase in the prepaid ratio (i.e., from ca.19% in 2009 to 28% in 2013). Not only were new (unique) prepaid customers being added. Also a fairly large postpaid to prepaid migration took place over the period. In the USA the minute usage of a prepaid is ca. 35+% lower than that of a postpaid. In comparison the Global demanded minutes difference is 2.2+ times lower prepaid minute usage compared to that of a postpaid subscriber). In the NA Region (and of course likewise in the USA Market) we observe a reduced voice usage over the period both for the postpaid & prepaid segment (based on unique subscribers). Thus increased prepaid blend in the overall mobile base with a relative lower voice usage combined with a general decline in voice usage leads to a pretty much zero growth in voice usage in the NA Market. Although the NA Region is dominated by USA growth (ca. 0.1 % CAGR total voice growth), Canada’s likewise showed very minor growth in their overall voice usage as well (ca. 3.8% CAGR). Both Canada & USA reduced their minute pricing over the period.

  • Note on US Voice Usage & Revenues: note that in both in US and in Canada also the receiving party pays (RPP) for receiving a voice call. Thus revenue generating minutes arises from both outgoing and incoming minutes. This is different from most other markets where the Calling Party Pays (CPP) and only minutes originating are counted in the revenue generation. For example in USA the Minutes of Use per blended customer was ca. 620 MoU in 2013. To make that number comparable with say Europe’s 180 MoU, one would need to half the US figure to 310 MoU still a lot higher than the Western European blended minutes of use. The US bundles are huge (in terms of allowed minutes) and likewise the charges outside bundles (i.e., forcing the consumer into the next one) though the fixed fees tends be high to very high (in comparison with other mobile markets). The traditional US voice plan would offer unlimited on-net usage (i.e., both calling & receiving party are subscribing to the same mobile network operator) as well as unlimited off-peak usage (i.e., evening/night/weekends). It should be noted that many new US-based mobile price plans offers data bundles with unlimited voice (i.e., data-centric price plans). In 2013 approximately 60% of the US mobile industry’s turnover could be attributed to mobile voice usage. This number is likely somewhat higher as some data-tariffs has voice-usage (e.g., typically unlimited) embedded. In particular the US mobile voice business model would be depending customer migration to prepaid or lower-cost bundles as well as how well the voice-usage is being re-balanced (and re-captured) in the Data-centric price plans.

The second main component of the voice revenue is the unit price of a voice minute. Apart from the NA Region, all markets show substantial reductions in the unit price of a minute.

  • Figure Above: Illustrating the annual growth (compounded) of the per minute price in US$-cents as well as the corresponding growth in total voice minutes. The most affected by declining growth is Western Europe & Central Eastern Europe although other more-emerging markets are observed to have decelerating voice revenue growth. Source: Pyramid Research.

Clearly from the above it appears that the voice “elastic” have broken down in most mature markets with diminishing (or no return) on further minute price reductions. Another way of looking at the loss (or lack) of voice elasticity is to look at the unit-price development of a voice-minute versus the growth of the total voice revenues;

  • Figure Above: Illustrates the growth of Total Voice Revenue and the unit-price development of a mobile voice minute. Apart from the Latin America (LA) and Asia Pacific (APAC) markets there clearly is no much further point in reducing the price of voice. Obviously, there are other sources & causes, than the pure gain of elasticity, effecting the price development of a mobile voice minute (i.e., regulatory, competition, reduced demand/voice substitution, etc..). Note US$ has been used as the unifying currency across the various markets. Despite currency effects the trend is consistent across the markets shown above. Source: Pyramid Research.

While Western & Central-Eastern Europe (WEU & CEE) as well as the mature markets in Middle East and Asia-Pacific shows little economic gain in lowering voice price, in the more emerging markets (LA and Africa) there are still net voice revenue gains to be made by lowering the unit price of a minute (although the gains are diminishing rapidly). Although most of the voice growth in the emerging markets comes from adding new customers rather than from growth in the demand per customer itself.

  • Figure Above: Illustrating possible drivers for mobile voice growth (positive as well as negative); such as Mobile Data Penetration 2013 (expected negative growth impact), increased number of (unique) subscribers compared to 2009 (expected positive growth impact) and changes in prepaid-postpaid blend (a negative %tage means postpaid increased their proportion while a positive %tage translates into a higher proportion of prepaid compared to 2009). Voice tariff changes have been observed to have elastic effects on usage as well although the impact changes from market to market pending on maturity. Source: derived from Pyramid Research.

With all the talk about Mobile Data, it might come as a surprise that Voice Usage is actually growing across all regions with the exception of North America. The sources of the Mobile Voice Minutes Growth are largely coming from

  1. Adding new unique subscribers (i.e., increasing mobile penetration rates).
  2. Transitioning existing subscribers from prepaid to postpaid subscriptions (i.e., postpaid tends to have (a lot) higher voice usage compared to prepaid).
  3. General increase in usage per individual subscriber (i.e., few markets where this is actually observed irrespective of the general decline in the unit cost of a voice minute).

To the last point (#3) it should be noted that the general trend across almost all markets is that Minutes of Use per Unique customer is stagnating and even in decline despite substantial per unit price reduction of a consumed minute. In some markets that trend is somewhat compensated by increase of postpaid penetration rates (i.e., postpaid subscribers tend to consume more voice minutes). The reduction of MoUs per individual subscriber is more significant than a subscription-based analysis would let on.

Clearly, Mobile Voice Usage is far from Dead

and

Mobile Voice Revenue is a very important part of the overall mobile revenue composition.

It might make very good sense to spend a bit more time on strategizing voice, than appears to be the case today. If mobile voice remains just an afterthought of mobile data, the Telecom industry will loose massive amounts of Revenues and last but not least Profitability.


Post Script: What drives the voice minute growth?

An interesting exercise is to take all the data and run some statistical analysis on it to see what comes out in terms of main drivers for voice minute growth, positive as well as negative. The data available to me comprises 77 countries from WEU (16), CEE (8), APAC (15), MEA (17), NA (Canada & USA) and LA (19). I am furthermore working with 18 different growth parameters (e.g., mobile penetration, prepaid share of base, data adaptation, data penetration begin of period, minutes of use, voice arpu, voice minute price, total minute volume, customers, total revenue growth, sms, sms price, pricing & arpu relative to nominal gdp etc…) and 7 dummy parameters (populated with noise and unrelated data).

Two specific voice minute growth models emerges our of a comprehensive analysis of the above described data. The first model is as follows

(1) Voice Growth correlates positively with Mobile Penetration (of unique customers) in the sense of higher penetration results in more minutes, it correlates negatively with Mobile Data Penetration at the begin of the period (i.e., 2009 uptake of 3G, LTE and beyond) in the sense that higher mobile data uptake at the begin of the period leads to a reduction of Voice Growth, and finally  Voice Growth correlates negatively with the Price of a Voice Minute in the sense of higher prices leads to lower growth and lower prices leads to higher growth.  This model is statistically fairly robust (e.g., a p-values < 0.0001) as well as having all parameters with a statistically meaningful confidence intervals (i.e., upper & lower 95% confidence interval having the same sign).

The Global Analysis does pin point to very rational drivers for mobile voice usage growth, i.e., that mobile penetration growth, mobile data uptake and price of a voice minute are important drivers for total voice usage. 

It should be noted that changes in the prepaid proportion does not appear statistically to impact voice minute growth.

The second model provides a marginal better overall fit to the Global Data but yields slightly worse p-values for the individual descriptive parameters.

(2) The second model simply adds the Voice ARPU to (nominal) GDP ratio to the first model. This yields a negative correlation in the sense that a low ratio results in higher voice usage growth and a higher ration in lower voice usage growth.

Both models describe the trends or voice growth dynamics reasonably well, although less convincing for Western & Central Eastern Europe and other more mature markets where the model tends to overshoot the actual data. One of the reasons for this is that the initial attempt was to describe the global voice growth behaviour across very diverse markets.

  • Figure Above: Illustrates total annual generated voice minutes compound annual growth rate (between 2009 and 2013) for 77 markets across 6 major regions (i.e., WEU, CEE, APAC, MEA, NA and LA). The Model 1 shows an attempt to describe the Global growth trend across all 77 markets within the same model. The Global Model is not great for Western Europe and part of the CEE although it tends to describe the trends between the markets reasonably.

  • Figure Western & Central Eastern Region: the above Illustrates the compound annual growth rate (2009 – 2013) of total generated voice minutes and corresponding voice revenues. For Western & Central Eastern Europe while the generated minutes have increased the voice revenue have consistently declined. The average CAGR of new unique customers over the period was 1.2% with the maximum being little less than 4%.

  • Figure Asia Pacific Region: the above Illustrates the compound annual growth rate (2009 – 2013) of total generated voice minutes and corresponding voice revenues. For the Emerging market in the region there is still positive growth of both minutes generated as well as voice revenue generated. Most of the mature markets the voice revenue growth is negative as have been observed for mature Western & Central Eastern Europe.

  • Figure Middle East & Africa Region: the above Illustrates the compound annual growth rate (2009 – 2013) of total generated voice minutes and corresponding voice revenues. For the Emerging market in the region there is still positive growth of both minutes generated as well as voice revenue generated. Most of the mature markets the voice revenue growth is negative as have been observed for mature Western & Central Eastern Europe.

  • Figure North & Latin America Region: the above Illustrates the compound annual growth rate (2009 – 2013) of total generated voice minutes and corresponding voice revenues. For the Emerging market in the region there is still positive growth of both minutes generated as well as voice revenue generated. Most of the mature markets the voice revenue growth is negative as have been observed for mature Western & Central Eastern Europe.

    PS.PS. Voice Tariff Structure

  • Typically the structure of a mobile voice tariff (or how the customer is billed) is structure as follows

    • Fixed charge / fee

      • This fixed charge can be regarded as an access charge and usually is associated with a given usage limit (i.e., $ X for Y units of usage) or bundle structure.
    • Variable per unit usage charge

      • On-net – call originating and terminating within same network.
      • Off-net – Domestic Mobile.
      • Off-net – Domestic Fixed.
      • Off-net – International.
      • Local vs Long-distance.
      • Peak vs Off-peak rates (e.g., off-peak typically evening/night/weekend).
      • Roaming rates (i.e., when customer usage occurs in foreign network).
      • Special number tariffs (i.e., calls to paid-service numbers).

    How a fixed vis-a-vis variable charges are implemented will depend on the particularity of a given market but in general will depend on service penetration and local vs long-distance charges.

  • Acknowledgement

    I greatly acknowledge my wife Eva Varadi for her support, patience and understanding during the creative process of creating this Blog. I certainly have not always been very present during the analysis and writing. Also many thanks to Shivendra Nautiyal and others for discussing and challenging the importance of mobile voice versus mobile data and how practically to mitigate VoIP cannibalization of the Classical Mobile Voice.