

Part of this blog has also been published in Telecom Analysis, titled “Navigating the Future of Telecom Capex: Western Europe’s Telecom Investment 2024 to 2030.” and some of the material has been updated to reflect the latest available data in some areas (e.g., fiber deployment in Western Europe).
Over the last three years, I have extensively covered the details of the Western European telecom sector’s capital expense levels and the drivers behind telecom companies’ capital investments. These accounts can be found in “The Nature of Telecom Capex—a 2023 Update” from 2023 and my initial article from 2022. This new version of “The Nature of Telecom Capex – a 2024 Update” is also different compared to the issues of 2022 and 2023 in that it focuses on the near future Capex demands from 2024 to 2030 and what we may expect from our Industry capital spending over the next 7 years.
For Western Europe, Capex levels in 2023 were lower than in 2022, a relatively rare but not unique occurrence that led many industry analysts to conclude the “End of Capex” and that from now on, “Capex will surely decline.” The compelling and logical explanations were also evident, pointing out that “data traffic (growth) is in decline”, “overproduction of bandwidth”, “5G is not what it was heralded to be”, “No interest in 6G”, “Capital is too expensive” and so forth. These “End to Capex” conclusions were often made on either aggregated data or selected data, depending on the availability of data.
Having worked on Capex planning and budgeting since the early 2000s for one of the biggest telecom companies in Europe, Deutsche Telecom AG, building what has been described as best-practice Capex models, my outlook is slightly less “optimistic” about the decline and “End” of Capex spending by the Industry. Indeed, for those expecting that a Telco’s capital planning is only impacted by hyper-rational insights glued to real-world tangibles and driven by clear strategic business objectives, I beg you to modify that belief somewhat.

Western Europe’s telecommunications Capex fell between 2022 and 2023 for the first time in some years, from the peak of 51 billion euros in 2022. The overall development from 2017 to 2023 is illustrated below, including a projected Capex development covering 2024 to 2026 using each Telco’s revenue projections as a simple driver for the expected Capex level (i.e., inherently assuming that the planned Capex level is correlated to the anticipated, or targeted, revenue of the subsequent year).
The reduction in Capex between 2022 and 2023 comes from 29 out of 56 Telcos reducing their Capex level in 2023 compared to 2022. In 8 out of 15 countries, the Telco Capex levels were decreased by ca. 2.3 billion euros compared to their 2022 Capex levels. Likewise, 7 countries spent approximately 650 million euros more than their 2022 levels together. If we compared the 1st and 2nd half of 2023 with 2022, there was an unprecedented Capex reduction in the 2nd half of 2023 compared to any other year from 2017 to 2023. It really gives the impression that many ( at least 36 out of 56) Telcos put their feet on the break in 2023. 29 Telcos out of the 36 broke their spending in the last half of 2023 and ended the year with an overall lower spending than in 2022. Of the 8 countries with a lower Capex spend in 2023, the UK, France, Italy, and Spain make up more than 80%. Of the countries with a higher Capex in 2023, Germany, Netherlands, Belgium, and Austria make up more than 80%.
For a few of the countries with lower Capex levels in 2023, one could argue that they more or less finished their 5G rollout and have so high fiber-to-the-home penetration levels that more fiber is on account of overbuilt and of a substantially smaller scale than in the past (e.g., France, Norway, Spain, Portugal, Denmark, and Sweden). For other countries with a lower investment level than the previous year, such as the UK, Italy, and Greece, 2022 and 2023 saw substantial consolidation activity in the markets (e.g., Vodafone UK & C.K. Hutchinson 3, Wind Hellas rounded up in Nova Greece, …). In fact, Spain (e.g., Masmovil), Norway (e.g., Ice Group), and Denmark (e.g., Telia DK) also experienced consolidation activities that will generally lower companies’ spending levels initially. One would expect, as to some extent visible in the first half of 2024, that countries that spend less due to consolidation activities would increase their Capex levels in the next two to three years after an initial replanning period.
WESTERN EUROPE – THE BIG CAPEX OVERVIEW.

When attempting to understand Telco Capex, or any Capex with a “built-in” cyclicity, one really should look at more than one or two years. Figure 2 above provides the comparison with the average Capex spend over the period 2019 to 2023 and the Capex spend in 2023. The five year Capex average captures the initial stages of 5G deployment in Europe, 5G deployment in general, COVID capacity investments (in fixed networks), the acceleration of Fiber rollout in many countries in Europe (e.g., Germany, UK, Netherlands, …), the financial (inflationary) crisis of increasing costly capital, and so forth. In my opinion 2023 is a reflection of the 2021-2022 financial crisis and that most of the 5G has been deployed to cover current market needs. As we have seen before, Telco investments are often 12 to 18 month out of synch with financial crisis years, and thus it is from that perspective also not surprising that 2023 might be a lower Capex year than in the past. Although, as is also evident from Figure 2, only 5 countries had a lower Capex level in 2023 than the previous 5 years average level.

Using Capex to Revenue ratios of the Telco industry are prone to some uncertainty. This is particular the case when individual Telcos are compared. In general, I recommend to make comparisons over a given period of time, like 3 or 5 year periods, as it averages out some of the natural variation between Telcos and countries (e.g., one country or Telco may have started its 5G deployment earlier than others). Even that approach has to be taken with some caution as some Telcos may fully incur Capex for fiber deployments and others may make wholesale agreements with open Fiberco’s (for example) and only incur last-mile access or connection Capex. Although, of smaller relative Capex scale nowadays, Telcos increasingly have Towercos managing and building their passive infrastructure for their cell site demand. Some may still fully build their own cell sites, incurring proportionally higher Capex per new site deployed, which of course may lead to structural Capex differences between such Telcos. Having these cautionary remarks in mind, I believe that Capex to Revenue ratios does provide a means of comparing Countries or Telcos and it does give provide a picture of the capital investment intensity compared to the market performance. A country comparison of the 5-year (period: 2019 to 2023) average Capex to Revenue ratio is illustrated in Figure 3 below for the 15 markets considered in this blog.

Comparing Capex per capita and Capex as a percentage of GDP may offer insights into how capital investments are prioritized in relation to population size and economic output. These two metrics could highlight different aspects of investment strategies, providing a more comprehensive understanding of national economic priorities and critical infrastructure development levels. Such a comparison is show in Figure 15 below.
Capex per capita, shown in Figure 5 left hand side, measures the average amount of investment allocated to each person within a country. This metric is particularly useful for understanding the intensity of investment relative to the population, indicating how much infrastructure, technology, or other capital resources are being made available on a per-person basis. A higher Capex per capita suggests significant investment in areas like public services, infrastructure, or economic development, which could improve quality of life or boost productivity. Comparing this measure across countries helps identify disparities in investment levels, revealing which nations are placing greater emphasis on infrastructure development or economic expansion. For example, a country with a high Capex per capita likely prioritizes public goods such as transportation, energy, or digital infrastructure, potentially leading to better economic outcomes and higher living standards over time. The 5-year average Capex level does show a strong positive linear relationship with the Country population (R² = 0.9318, chart not shown), suggesting that ca. 93% of the variation in Capex can be explained by the variation in population. The trend implies that as the population increases, Capex also tends to increase, likely reflecting higher investment needs to accommodate larger populations. It should be noted that that a countries surface area is not a significant factor influencing Capex. While some countries with larger land areas might exhibit a higher Capex level, the overall trend is not strong.
Capex as a percentage of GDP, shown in Figure 5 right hand side, measures the proportion of a country’s economic output devoted to capital investment. This ratio provides context for understanding investment levels relative to the size of the economy, showing how much emphasis is placed on growth and development. A higher Capex-to-GDP ratio can indicate an aggressive investment strategy, commonly seen in developing economies or countries undergoing significant infrastructure expansion. Conversely, a lower ratio might suggest efficient capital allocation or, in some cases, underinvestment that could constrain future economic growth. This metric helps assess the sustainability of investment levels and reflects economic priorities. For instance, a high Capex-to-GDP ratio in a developed country could indicate a focus on upgrading existing infrastructure, whereas in a developing economy, it may signify efforts to close infrastructure gaps, modernization efforts (e.g., optical fiber replacing copper infrastructure per fixed broadband transformation) and accelerating growth. The 5-year average Capex level does show a strong positive linear relationship with the Country GDP (R² = 0.9389, chart not shown), suggesting that ca. 94% of the variation in Capex can be explained by the variation in the country GDP. While a few data points show some deviation from this trend, the overall fit is very strong, reinforcing the notion that larger economies generally allocate more resources to capital investments.
The insights gained from both Capex per capita and Capex as a percentage of GDP are complementary, providing a fuller picture of a country’s investment strategy. While Capex per capita reflects individual investment levels, Capex as a percentage of GDP reveals the scale of investment in relation to the overall economy. For example, a country with high Capex per capita but a low Capex-to-GDP ratio (e.g., Denmark, Norway, …) may have a wealthy population where individual investment levels are significant, but the size of the economy is such that these investments constitute a relatively small portion of total economic activity. Conversely, a country with a high Capex-to-GDP ratio but low Capex per capita (e.g., Greece) may be dedicating a substantial portion of its economic resources to infrastructure in an effort to drive growth, even if the per-person investment remains modest.

FORWARD TO THE PAST.
Almost 15 years ago, I gave a presentation at the “4G World China” conference in Beijing titled “Economics of 4G Introduction in Growth Markets”. The idea was that a mobile operator’s capital demand would cycle between 8% (minimum) and 13% (maximum), usually with one replacement cycle before migrating to the next-generation radio access technology. This insight was backed up by best-practice capital demand models considering market strategy and growth Capex drivers. It involved also involved the insights of many expert discussions.

For the careful observer, you will see that I expected, back in 2011, the typical Capex maintenance cycle in Western European markets between infrastructure and technology modernization periods to be no more than 8% and that Capex in the maintenance years would be 30% lower than required in the peak periods. I have yet to see a mobile operation with such a low capital intensity unless they effectively share their radio access network and/or by cost-structure “magic” (i.e., cost transformation), move typical mobile Capex items to Opex (by sourcing or optimizing the cost structure between fixed and mobile business units).
I retrospectively underestimated the industry’s willingness to continue increasing capital investments in existing networks, often ignoring the obvious optimization possibilities between their fixed and mobile broadband networks (due to organizational politics) and, of course, what has and still is a major industrial contagious infliction: “Metus Crescendi Exponentialis” (i.e., the fear of the exponential growth aka the opportunity to spend increasingly lots of Capex). From 2000 to today, the Western European Capex to Revenue ratio has been approximately between 11% and 21%, although it has been growing since around 2012 (see details in “The Nature of Telecom Capex—a 2023 Update”).
CAPEX DEVELOPMENT FROM 2024 TO 2026.
From the above Figure 1, it should be no surprise that I do not expect Capex to continue to decline substantially over the next couple of years, as we saw between 2022 and 2023. In fact, I anticipate that 2024 will be around the level of 2023, after which we will experience modest annual increases of 600 to 700 million euros. Countries with high 5G and Fiber-to-the-Home (FTTH) coverage (e.g., France, Netherlands, Norway, Spain, Portugal, Denmark, and Sweden) will keep their Capex levels possible with some modest declines with single-digit percentage points. Countries such as Germany, the UK, Austria, Belgium, and Greece are still European laggards in terms of FTTH coverage, being far below the 80+% of other Western European countries such as France, Spain, Portugal, Netherlands, Denmark, Sweden, and Norway. Such countries may be expected to continue to increase their Capex as they close the FTTH coverage gap. Here, it is worth remembering that several fiber acquisition strategies aiming at connecting homes with fiber result in a lower Capex than if a Telco aims to build all the required fiber infrastructure.
Consolidation Capex.
Telecom companies tend to scale back Capex during consolidation due to uncertainty, the desire to avoid redundancy, and the need to preserve cash. However, after regulatory approval and the deal’s closing, Capex typically rises as the company embarks on network integration, system migration, and infrastructure upgrades necessary to realize the merger’s benefits. This post-merger increase in Capex is crucial for achieving operational synergies, enhancing network performance, and maintaining a competitive edge in the telecom market.
If we look at the period 2021 to 2024, we have had the following consolidation and acquisition examples:
- UK: In May 2021, Virgin Media and the O2 (Telefonica) UK merger was approved. They announced the intention to consolidate on May 7th, 2020.
- UK: Vodafone UK and Three UK announced their intention to merge in June 2023. The final decision is expected by the end of 2024.
- Spain: Orange and MasMovil announced their intent to consolidate in July 2023. Merger approval was given in February 2024. Conditions were imposed on the deal for MasMovil to divestitures its frequency spectrum.
- Italy: The potential merger between Telecom Italia (TIM) and Open Fiber was first discussed in 2020 when the idea emerged to create a national fiber network in Italy by merging TIM’s fixed access unit, FiberCop, with Open Fiber. a Memorandum of Understanding was signed in May 2022.
- Greece: Wind Hellas acquisition by United Group (Nova) was announced in August 2021 and finalized in January 2022 (with EU approval in December 2021).
- Denmark: Norlys’s acquisition of Telia Denmark was first announced on April 25, 2023, and approved by the Danish competition authority in February 2024.
Thus, we should also expect that the bigger in-market consolidations may, in the short term (next 2+ years), lead to increased Capex spending during the consolidation phase, after which Capex (& Opex) synergies hopefully kick in. Typically, 2 budgetary cycles minimum before this would be expected to be observed. Consolidation Capex usually amounts to a couple of percentage points of total consolidated revenue, with some other bigger items being postponed to the tail end of a consolidation unless it is synergetic with the required integration.
The High-risk Suppler Challenge to Western Europe’s Telcos.
When assessing whether Capex will increase or decrease over the next few years (e.g., up to 2030), we cannot ignore the substantial Capex amounts associated with replacing high-risk suppliers (e.g., Huawei, ZTE) from Western European telecom networks. Today, the impact is mainly on mobile critical infrastructure, which is “limited” to core networks and 5G radio access networks (although some EU member states may have extended the reach beyond purely 5G). Particularly if (or when?) the current European Commission’s 5G Toolbox (legal) Framework (i.e., “The EU Toolbox for 5G Security”) is extended to all broadband network infrastructure (e.g., optical and IP transport network infrastructure, non-mobile backend networking & IT systems) and possibly beyond to also address Optical Network Terminal (ONT) and Customer Premise Equipment (note: ONT’s can be integrated in the CPE or alternatively separated from the CPE but installed at the customers premise). To an extent, it is thought-provoking that the EU emphasis has only been on 5G-associated critical infrastructure rather than the vast and ongoing investment of fiber-optical, next-generation fixed broadband networks across all European Union member states (and beyond). In particular, this may appear puzzling when the European Union has subsidized these new fiber-optical networks by up to 50%. Considering that the fixed-broadband traffic is 8 to 10 times that of the mobile traffic, and all mobile (and wireless) traffic passes through the fixed broadband network and associated local as well as global internet critical infrastructure.
As far back as 2013, the European Parliament raised some concerns about the degree of involvement (market share) of Chinese companies in the EU’s telecommunications sector. It should be remembered that in 2013, Europe’s sentiment was generally positive and optimistic toward collaboration with China, as evidenced by the European Commission’s report “EU-China 2020 Strategic Agenda for Cooperation” (2013). Historically, the development of the EU’s 5G Toolbox for Security was the result of a series of events from about 2008 (after the financial crisis) to 2019 (and to today), characterized by growing awareness in Europe of China’s strategic ambitions, the expansion of the BRI (Belt and Road Initiative, 2013), DSR (Digital Silk Road, an important part of BRI 2.0, 2015), and China’s National Intelligence Law (2017) requiring Chinese companies to cooperate with the Chinese Government on intelligence matters, as well as several high-profile cybersecurity incidents (e.g., APT, Operation Cloud Hopper, …), and increased scrutiny of Chinese technology providers and their influence on critical communications infrastructure across pretty much the whole of Europe. These factors collectively drove the EU to adopt a more cautious and coordinated approach to addressing security risks in the context of 5G and beyond.

The European Commission’s 2023 second report on the implementation of the EU 5G cybersecurity toolbox offers an in-depth examination of the risks posed by high-risk suppliers, focusing on Chinese-origin infrastructure, such as equipment from Huawei and ZTE. The report outlines the various stages of implementation across EU Member States and provides recommendations on how to mitigate risks associated with Chinese infrastructure. It considers 5G and fixed broadband networks, including Customer Premise Equipment (CPE) devices like modems and routers placed at customer sites.
The EU Commission defines a high-risk supplier in the context of 5G cybersecurity based on several objective criteria to reduce security threats in telecom networks. A supplier may be classified as high-risk if it originates from a non-EU country with strong governmental ties or interference, particularly if its legal and political systems lack democratic safeguards, security protections, or data protection agreements with the EU. Suppliers susceptible to governmental control in such countries pose a higher risk.
A supplier’s ability to maintain a reliable and uninterrupted supply chain is also critical. A supplier may be considered high-risk if it is deemed vulnerable in delivering essential telecom components or ensuring consistent service. Corporate governance is another important aspect. Suppliers with opaque ownership structures or unclear separation from state influence are more likely to be classified as high-risk due to the increased potential for external control or lack of transparency.
A supplier’s cybersecurity practices also play a significant role. If the quality of the supplier’s products and its ability to implement security measures across operations are considered inadequate, this may raise concerns. In some cases, country-specific factors, such as intelligence assessments from national security agencies or evidence of offensive cyber capabilities, might heighten the risk associated with a particular supplier.
Furthermore, suppliers linked to criminal activities or intelligence-gathering operations undermining the EU’s security interests may also be considered high-risk.
To summarize what may make a telecom supplier a high-risk supplier:
- Of non-EU origin.
- Strong governmental ties.
- The country of origin lacks democratic safeguards.
- The country of origin lacks security protection or data protection agreements with the EU.
- Associated supply chain risks of interruption.
- Opaque ownership structure.
- Unclear separation from state influence.
- Ability to independently implement security measures shielding infrastructure from interference (e.g., sabotage, espionage, …).
These criteria are applied to ensure that telecom operators, and eventually any business with critical infrastructure, become independent of a single supplier, especially those that pose a higher risk to the security and stability of critical infrastructure.

Regarding 5G infrastructure, the EU report reiterates the urgency for EU Member States to immediately implement restrictions on high-risk suppliers. The EU policy highlights the risks of state interference and cybersecurity vulnerabilities posed by the close ties between Chinese companies like Huawei and ZTE and the Chinese government. Following groundwork dating back to the 2008s EU Directive on Critical Infrastructure Protection (EPCIP), The EU’s Digital Single Market Strategy (2015), the (first) Network and Information Security (NIS) directive (2016), and early European concern about 5G societal impact and exposure to cybersecurity (2015 – 2017), the EU toolbox published in January 2020 is designed to address these risks by urging Member States to adopt a coordinated approach. As of 2023, a second EU report was published on the member state’s progress in implementing the EU Toolbox for 5G Cybersecurity. While many Member States have established legal frameworks that give national authorities the power to assess supplier risks, only 10 have fully imposed restrictions on high-risk suppliers in their 5G networks. The report criticizes the slow pace of action in some countries, which increases the EU’s collective exposure to security threats.
Germany, having one of the largest, in absolute numbers, Chinese RAN deployments in Western Europe, has been singled out for its apparent reluctance to address the high-risk supplier challenge in the last couple of years (see also notes in “Further Readings” at the back of this blog). Germany introduced its regulation on Chinese high-risk suppliers in July 2024 with a combination of their Telekommunikationsgesetz (TKG) and IT-Sicherheitsgesetz 2.0. The German government announced that starting in 2026, it will ban critical components from Huawei and ZTE in its 5G networks due to national security concerns. This decision aligns Germany with other European countries working to limit reliance on high-risk suppliers. Germany has been slower in implementing such measures than others in the EU, but the regulation marks a significant step towards strengthening its telecom infrastructure security. Light Reading has estimated that a German Huawei ban would cost €2.5B and take years for German telcos. This estimate seems very optimistic and certainly would require very substantial discounts from the supplier that would be chosen to replace, for example, their Huawei installations with, e.g., for Telekom Deutschland that would be ca. 50+% of their ca. 38+ thousand sites, and it is difficult for me to believe that that kind of economy would apply to all telcos in Western Europe with high-risk suppliers. I also believe it ignores de-commissioning costs and changes to the backend O&M systems. I expect telco operators will try to push the timeline for replacement until most of their high-risk supplier infrastructure is written off and ripe for modernization, which for Germany would most likely happen after 2026. One way or another, we should expect an increase in mobile Capex spending towards the end of the decade as the German operators are swapping out their Chinese RAN suppliers (which may only be a small part of their Capital spend if the ban is extended beyond 5G).
The European Commission recommends that restrictions cover critical and highly sensitive assets, such as the Radio Access Network (RAN) and core network functions, and urges member states to define transition periods to phase out existing equipment from high-risk suppliers. The transition periods, however, must be short enough to avoid prolonging dependency on these suppliers. Notably, the report calls for an immediate halt to installing new equipment from high-risk vendors, ensuring that ongoing deployment does not undermine EU security.
When it comes to fixed broadband services, the report extends its concerns beyond 5G. It stresses that many Member States are also taking steps to ensure that the fixed network infrastructure is not reliant on high-risk suppliers. Fourteen (14) member states have either implemented or plan to restrict Chinese-origin equipment in their fixed networks. Furthermore, nine (9) countries have adopted technology-neutral legislation, meaning the restrictions apply across all types of networks, not just 5G. This implies that Chinese-origin infrastructure, including transport network components, will eventually face the same scrutiny and restrictions as 5G networks. While the report does not explicitly call for a total ban on all Chinese-origin equipment, it stresses the need for detailed assessments of supplier risks and restrictions where necessary based on these assessments.
While the EU’s “5G Security Toolbox” focuses on 5G networks, Denmark’s approach, the “Danish Investment Screening Act,” which took effect on the 1st of July 2021, goes much further by addressing the security of fixed broadband, 4G, and transport networks. This broad regulatory focus helps Denmark ensure the security of its entire communications ecosystem, recognizing that vulnerabilities in older or supporting networks could still pose serious risks. A clear example of Denmark’s comprehensive approach to telecommunications security beyond 5G is when the Danish Center for Cybersikkerhed (CFCS) required TDC Net to remove Chinese DWDM equipment from its optical transport network. TDC Net claimed that the consequence of the CFCS requirement would result in substantial costs to TDC Net that they had not considered in their budgets. CFCS has regulatory and legal authority within Denmark, particularly in relation to national cybersecurity. CFCS is part of the Danish Defense Intelligence Service, which places it under the Ministry of Defense. Denmark’s regulatory framework is not only one of the sharpest implementations of the EU’s 5G Toolkit but also one of the most extensive in protecting its national telecom infrastructure across multiple layers and generations of technology. The Danish approach could be a strong candidate to serve as a blueprint for expanded EU regulation beyond 5G high-risk suppliers and thus become applicable to fixed broadband and transport networks, resulting in substantial additional Capex towards the end of the decade.
While not singled out as a unique risk category, customer premises equipment (CPE) from high-risk suppliers is mentioned in the context of broader network security measures. Some Member States have indicated plans to ensure that CPE is subject to strict procurement standards, potentially using EU-wide certification schemes to vet the security of such devices. CPE may be included in future security measures if it presents a significant risk to the network. Many CPEs have been integrated with the optical network terminal, or ONT, which is architecturally a part of the fixed broadband infrastructure, serving as a demarcation point between the fiber optic network and the customer’s internal network. Thus, ONT is highly likely to be considered and included in any high-risk supplier limitations that may come soon. Any CPE replacement program would likely be associated on its own with considerable Capex and cost for operators and their customers in general. The CPE quantum for the European Union (including the UK, cheeky, I know) is between 200 and 250 million CPEs, including various types of CPE devices, such as routers, modems, ONTs, and other network equipment deployed for residential and commercial users. It is estimated that 30% to 40% of these CPEs may be linked to high-risk Chinese suppliers. The financial impact of a systematic CPE replacement program in the EU (including the UK) could be between 5 to 8 billion euros in capital expenses, ignoring the huge operational costs of executing such a replacement program.
The Data Growth Slow Down – An Opportunities for Lower Capex?
How do we identify whether a growth dynamics, such as data growth, is exponential or self-limiting?
Exponential growth dynamics have the same (percentage) growth rate indefinitely. Self-limiting growth dynamics, or s-curve behavior, will have a declining growth rate. Natural systems are generally self-limiting, although they might exhibit exponential growth over a short term, typically in the initial growth phase. So, if you are in doubt (which you should not be), calculate the growth rate of your growth dynamics from the beginning until now. If that growth rate is constant (over several time intervals), your dynamics are exponential in nature (at least over the period you looked at); if not … well, your growth process is most likely self-limiting.
Telco Capex increases, and Telco Capex decreases. Capex is, in nature, cyclic, although increasing over time. Most European markets will have access to 550 to 650 MHz downlink spectrum depending on SDL deployment levels below 4 GHz. Assuming 4 (1) Mbps per DL (UL) MHz per sector effective spectral efficiency, 10 traffic hours per day, and ca. 350 to 400 thousand mobile sites (3 sectors each) across Western Europe, the carrying mobile capacity in Bytes is in the order of 140 Exa Bytes (EB) per Month (note: if I had chosen 2 and 0.5 Mbps per MHz per sector, carrying capacity would be ca. 70 EB/Month). It is clear that this carrying capacity limit will continue to increase with software releases, innovation, advanced antenna deployment with higher order MiMo, and migration from older radio access technologies to the newest (increasing the effective spectral efficiency).
According to Ericsson Mobility Visualizer, Western Europe saw a mobile data demand per month of 11 EB in 2023 (see Figure below). The demand for mobile data in 2023 was almost 10 times lower than the (conservatively) estimated carrying capacity of the underlying mobile networks.

It should be noted that the Ericsson data treats traffic generated by fixed wireless access (FWA) separately (which, by the way, makes sense). Thus, the 11 EB for 2023 does not include FWA traffic. Ericsson only has a global forecast for FWA traffic starting from 2023 (note: it is not clear whether 2023 is actual FWA traffic or estimated). To get an impression of the long-term impact of FWA traffic, we can apply the same S-curve approach as the one used for mobile data traffic above, according to what I call the “Informed expectations” approach. Even with the FWA traffic, it is difficult to see a situation that, on average (at least), would pose any challenge to existing mobile networks. Particularly, the carrying capacity can easily be increased by deploying more advanced antennas (e.g., higher order MiMo), and, in general, it is expected to improve with each new software release forthcoming.

So, by all means, the latest and greatest mobile networks are, without much doubt, in most places, over-dimensioned from the perspective of their carrying bytes potential, the volumetric capacity, and what is demanded in terms of data volume. They also appear to remain so for a very long time unless the current demand dynamics fundamentally change (which is, of course, always a possibility, as we have seen historically).
However, that our customers get their volumetric demand satisfied is generally a reflection of the quality in terms of bits per second (a much more fundamental unit than volume) satisfied. Thus, the throughput, or speed, should be good enough for the customer to unhindered enjoy their consumption, which, as a consequence, generates the Bytes that most Telco executives have told themselves they understand and like to base their pricing on (and I would argue judging by my experience outside Europe more often than not maybe really don’t get). It is not uncommon that operators with complex volumetric pricing become more obsessed with data volume rather than optimum quality (that might, in fact, generate even more volume). The figure below is a snapshot from August 2024 of the median speeds customers enjoy in mobile as well as fixed broadband networks in Western Europe. In most cases in Europe, customers today enjoy substantially faster fixed-broadband services than they would get in mobile networks. One should expect that this would change how Telcos (at least integrated Telcos) would design and plan their mobile networks and, consequently, maybe dramatically reduce the amount of Mobile Capex we spend. There is little evidence that this is happening yet. However, I do anticipate, most likely naively, that the Telco industry would revise how mobile networks are architected, designed, and built with 6G.

A Crisis of Too Much of a “Good” Thing?
Analysys Mason recently (July 2024) published a report titled “A Crisis of Overproduction in Bandwidth Means that Telecoms Capex Will Inevitably Fall.” The report explores the evolving dynamics of capital expenditure (Capex) in the telecom industry, highlighting that the industry is facing a turning point. The report argues that the telecom sector has reached a phase of bandwidth overproduction, where the infrastructure built to deliver data has far exceeded demand, leading to a natural decline in Capex over the coming years.
According to the Analysys Mason report, global Capex in the telecom sector has already peaked, with two significant investment surges behind it: the rollout of 5G networks in mobile infrastructure and substantial investments in fiber-to-the-premises (FTTP) networks. Both of these infrastructure developments were seen as essential for future-proofing networks, but now that the peaks in these investments have passed, Capex is expected to fall. The report predicts that by 2030, the Capex intensity (the proportion of revenue spent on capital investments) will drop from around 20% to 12%. This reduction is due to the shift from building new infrastructure to optimizing and maintaining existing networks.
The main messages that I take away from the Analysys Mason report are the following:
- Overproduction of bandwidth: Telecom operators have invested heavily in building their networks. However, demand for data and bandwidth is no longer growing at the exponential rates seen in previous years.
- Shifting Capex Trends: The telecom industry is experiencing two peaks: one in mobile spending due to the initial 5G coverage rollout and another in fixed broadband due to fiber deployments. Now that these peaks have passed, Capex is expected to decline.
- Impact of lower data growth: The stagnation in mobile and fixed data demand, combined with the overproduction of mobile and fixed bandwidth, makes further large-scale investment in network expansion unnecessary.
My take on Analysys Mason’s conclusions is that with the cyclic nature of Telco investments, it is natural to expect that Capex will go up and down. That Capex will cycle between 20% (peak deployment phase) and 12% (maintenance phase) seems very agreeable. However, I would expect that the maintenance level would continue to increase as time goes by unless we fundamentally change how we approach mobile investments.
That network capacity is built up at the beginning of a new technology cycle (e.g., 5G NR, GPON, XGPON, XSGPON-based FTTH), it is also not surprising that the amount of available capacity will appear substantial. I would not call it a bandwidth overproduction crisis (although I agree that the overhead of provisioned carrying capacity compared to demand expectations seems historically high); it manifests the technologies we have developed and deployed today. For 5G NR real-world conditions, users could see peak DL speeds ranging from 200 Mbps to 1 Gbps with median 5G DL speeds of 100+ Mbps. The lower end of this range applies in areas with fewer available resources (e.g., less spectrum, fewer MIMO streams). In comparison, the higher end reflects better conditions, such as when a user is close to the cell tower with optimal signal conditions. The quality of fiber-connected households at current GPON and XGPON technology would be sustainable at 1 to 10 Gbps downstream to the in-home ONT/CPE. However, the in-home quality experienced over WiFi would depend a lot on how the WiFi network has been deployed and how many concurrent users there are at any given time. As backhaul and backbone transmission solutions to mobile and fixed access will be modern and fiber-based, there is no reason to believe that user demand should be limited in any way (anytime soon), given a well-optimized, modern fiber-optic network should be able to reach up to 100 Tbps (e.g., 10 EB per month with 10 traffic hours per day).
Germany, the UK, Belgium, and a few smaller Western countries will continue their fiber deployment for some years to bring their fiber coverage up to the level of countries such as France, Spain, Portugal, and the Netherlands. It is difficult to believe that these countries would not continue to invest substantial money to raise their fiber coverage from their current low levels. Countries with less than 60% fiber-to-the-home coverage have a share of 50+ % of the overall Western European Capex level.
The fact that the Telco industry would eventually experience lower growth rates should not surprise anyone. That has been in the cards since growth began. The figure below takes actual mobile data from Ericsson’s Mobile Visualizer. It applies a simple S-curve growth model dynamics to those data that actually do a very good job of accounting for the behavior. A geometrical growth model (or exponential growth dynamics), while possibly accounting for the early stages of technology adaptation and the resulting data growth, is not a reasonable model to apply here and is not supported by the actual data.

The growth dynamic, applied to the data we extract from the markets shown in the above Figure, indicates that in Western Europe and the CEE (Central Eastern Europe), the inflection point should be expected around 2025. This is the year when the growth rates begin to decline. In Western Europe (and CEE), we would expect the growth rate to become less than 10% by 2030, assuming that no fundamental changes to the growth dynamic occur. The inflection point for the North American markets (i.e., The USA and Canada) is around 2033; this is expected to happen a bit earlier (2030) for Asia. Based on the current growth dynamics, North America will experience growth rates below 10% by 2036. For Asia, this event is expected to take place around 2033. How could FWA traffic growth change these results? The overall behavior would not change. The inflection point may happen later, thus the onset of slower growth rates, and the time when we would expect a growth rate lower than 10% would be a couple of years after the inflection year.
Let us just for fun (usually the best reason) construct a counterfactual situation. Let us assume that data growth continues to follow geometric (exponential) growth indefinitely without reaching a saturation point or encountering any constraints (e.g., resource limits, user behavior limitations). The premise is that user demand for mobile and fixed-line data will continue to grow at a constant, accelerating rate. For mobile data growth, we use the 27% YoY growth of 2023 and use this growth rate for our geometrical growth model. Thus, every ca. 3 years, the demand would double.
If telecom data usage continued to grow geometrically, the implications would (obviously) be profound:
- Exponential network demand: Operators would face exponentially increasing demand on their networks, requiring constant and massive investments in capacity to handle growing traffic. Once we reach the limits of the carrying capacity of the network, we have three years (with a CAGR of 27%) until demand has doubled. Obviously, any spectrum position would quickly become insufficient, resulting in massive investments in new infrastructure (sites in mobile and more fiber) would be needed. Capacity would become the growth limiting factor.
- Costs: The capital expenditures (Capex) required to keep pace with geometric growth would skyrocket. Operators must continually upgrade or replace network equipment, expand physical infrastructure, and acquire additional spectrum to support the growing data loads. This would lead to unsustainable business models unless prices for services rose dramatically, making such growth scenarios unaffordable for consumers but long before that for the operators themselves.
- Environmental and Physical Limits: The physical infrastructure necessary to support geometric growth (cell towers, fiber optic cables, data centers) would also have environmental consequences, such as increased energy consumption and carbon emissions. Additionally, telecom providers would face the law of diminishing returns as building out and maintaining these networks becomes less economically feasible over time.
- Consumer Experience: The geometric growth model assumes that user behavior will continue to change dramatically. Consumers would need to find new ways to utilize vast amounts of bandwidth beyond streaming and current data-heavy applications. Continuous innovation in data-hungry applications would be necessary to keep up with the increased data usage.
The counterfactual argument shows that geometric growth, while useful for the early stages of data expansion, becomes unrealistic as it leads to unsustainable economic, physical, and environmental demands. The observed S-curve growth is more appropriate for describing mobile data demand because it accounts for saturation, the limits of user behavior, and the constraints of telecom infrastructure investment.
Back to Analysys Mason’s expected, and quite reasonable, consequence of the (progressively) lower data growth: large-scale investment would become unnecessary.
While the assertion is reasonable, as said, mobile obsolescence hits the industry every 5 to 7 years, regardless of whether there is a new radio access technology (RAT) to take over. I don’t think this will change, or maybe the Industry will spend much more on software annually than previously and less on hardware modernization during obsolescence transformations. Though I suspect that the software would impose increasingly harder requirements on the underlying hardware (whether on-prem or in the cloud), modernization investments into the hardware part would continue to be substantial. This is not even considering the euphoria that may come around the next generation RAT (e.g., 6G).
The fixed broadband fiber infrastructure’s economical and useful life is much longer than that of the mobile infrastructure. The optical transmission equipment is likewise used for access, aggregation, and backbone (although not as long as the optical fiber itself). Additionally, fiber-based fixed broadband networks are operationally (much) more efficient than their mobile counterparts, alluding to the need to re-architect and redesign how they are being built as they are no longer needed inside customer dwellings. Overall, it is not unreasonable to expect that fixed broadband modernization investments will occur less frequently than for mobile networks.
Is Enough Customer Bandwidth a Thing?
Is there an optimum level of bandwidth in bits per second at which a customer is fully (optimized) served? Beyond that, whether the network could provide far more speed or quality does not matter.
For example. for most mobile devices, phones, and tablets, much more than 10 Mbps for streaming would not make much of a viewing difference for the typical customer. Given the assumptions about eyesight and typical viewing distances, more than 90% of people would not notice an improvement in viewing experience on a mobile phone or tablet beyond 1080p resolution. Increasing the resolution beyond that point—such as to 1440p (Quad HD) or 4K would likely not provide a noticeably better experience for most users, as their visual acuity limits their ability to discern finer details on small screens. This means the focus for improving mobile and tablet displays shifts from resolution to other factors like color accuracy, brightness, and contrast rather than chasing higher pixel counts. An optimization strategy that should not necessarily result in higher bandwidth requirements, although moving to higher color depth or more brightness / dynamic range (e.g., HDR vs SDR) would lead to a moderate increase in the required data ranges.
A throughput between 50 and 100 Mbps for fixed broadband TV streaming currently provides an optimum viewing experience. Of course, a fixed broadband household may have many concurrent bandwidth demands that would justify a 1 Gbps fiber to the home or maybe even 10 Gbps downstream to serve the whole household at an optimum experience at any time.

Let’s move into high-end and fully immersive virtual reality experiences. The user bandwidth requirement may exceed 100 Mbps and possibly even require a Gbps sustainable bandwidth delivered to the user device to provide an optimum experience. However, jitter and latency performance may not make such full immersion or high-end VR experiences fully optimal over mobile or fixed networks with long distances to the supporting (edge) data centers and cloud servers where the related application may reside. In my opinion, this kind of ultra-high-end specialized service might be better run exclusively on location.
Size Matter.
I once had a CFO who was adamant that an organization’s size on its own would drive a certain amount of Capex. I would, at times, argue that an organization’s size should depend on the number of activities required to support customers (or, more generally, the number of revenue-generating units (RGUs), your given company has or expects to have) and the revenue those generate. In my logic, at the time, the larger a country in terms of surface area, population, and households, the more capex-related activities would be required, thus also resulting in the need for a bigger organization. If you have more RGU, it might also not be too surprising that the organization would be bigger.
Since then, I have scratched my head many times when I look at country characteristics, the RGUs, and Revenues, asking how that can justify a given size of Telco organizations, knowing that there are other Telcos out there that spend the same or more Capex with a substantially smaller organization (also after considering the difference in sourcing strategies). I have never been with an organization that irrespective of its size did not feel pressured work-wise and believed it was too lightly staffed to operate, irrespective of the Capex and activities under management.

The above figure illustrates a strong correlation between Capex and the number of people in a Telco organization. However, the correlation would be weaker without the upper right data point. In the data shown here, you will find no correlation between FTEs and a country’s size, such as population or surface area, which is also the case for Capex. There is a weak correlation between FTEs and RGU and a stronger correlation with Revenues. Capex, in general, is very strongly correlated with Revenues. The best multi-linear regression model, chosen by p-value, is a model where Capex relates to FTEs and RGUs. For a Telco with 1000 employees and 1 million RGUs, approximately 50% of the Capex could be explained by the number of FTEs. Of course, in the analysis above, we must remember that correlation does not imply causation. You will have telcos that, in most Capex driver aspects, should be reasonably similar in their investment profiles over time, except the telco with the largest organization will consistently invest more in Capex. While I think this is, in particular, an incumbent vs challenger issue, it is a much broader issue in our industry.
Having spent most of my 20+ year career in Telecom being involved in Capex planning and budgeting, it is clear that the size of an organization plays a role in the size of a Capex budget. Intuitively, it should not be too surprising. Suppose the Capex is lower than the capacity of your organization. In that case, you may have to lay off people with the risk you might be short of resources in the future as you may cycle through modernization or a new technology introduction. On the other hand, if the Capex needs are substantially larger than the organization can cope with, including any sourcing agreements in place, it may not make too much sense to ask for more than what can be managed with the resources available (apart from it being sub-optimal for cash flow optimization).
Telco companies that have fixed and mobile broadband infrastructure in their portfolio with organizations that are poorly optimized and with strict demarcation lines between people working on fixed broadband and mobile broadband will, in general, have much worse Capex efficiencies compared to fully fixed-mobile converged organizations (not to mention suffering from poorer operational efficiencies and work practices compared to integrated organizations). Here, the size of, for example, a mobile organization will drive behavior that rather would spend above and beyond Capex in their Radio Access Network infrastructure than use more clever and proven solutions (e.g., Opanga’s RAIN) to optimize quality and capacity needs across their mobile networks.
In general, the resistance to utilize smarter solutions and clever ideas that may save Capex (and/or Opex) is manifesting in a many-fold of behaviors that I have observed over my 25+ year career (and some I might even have adapted on occasion … but shhhh;-).
Budget heuristics:
- 𝗦𝗶𝘇𝗲 𝗱𝗼𝗲𝘀𝗻𝘁 𝗺𝗮𝘁𝘁𝗲𝗿 𝗽𝗮𝗿𝗮𝗱𝗶𝗴𝗺 Irrespective of size, my organization will always be busy and understaffed.
- 𝗧𝗵𝗲 𝗚𝗼𝗹𝗱𝗶𝗹𝗼𝗰𝗸𝘀 𝗙𝗮𝗹𝗹𝗮𝗰𝘆 My organization’s size and structure will determine its optimum Capex spending profile, allowing it to stay busy (and understaffed).
- 𝗧𝗮𝗻𝗴𝗶𝗯𝗹𝗲 𝗕𝗶𝗮𝘀 A hardware (infrastructure-based) solution is better and more visible than a software solution. I feel more comfortable with my organization being busy with hardware.
- 𝗧𝗵𝗲 𝗦𝘂𝗻𝗸 𝗖𝗼𝘀𝘁 𝗙𝗮𝗹𝗹𝗮𝗰𝘆 I don’t trust (allegedly) clever software solutions that may lower or postpone my Capex needs and, by that, reduce the need for people in my organization.
- 𝗕𝘂𝗱𝗴𝗲𝘁 𝗠𝗮𝘅𝗶𝗺𝗶𝘇𝗮𝘁𝗶𝗼𝗻 𝗧𝗲𝗻𝗱𝗲𝗻𝗰𝘆 My organization’s importance and my self-importance are measured by how much Capex I have in my budget. I will resist giving part of my budget away to others.
- 𝗦𝘁𝗮𝘁𝘂𝘀 𝗤𝘂𝗼 𝗕𝗶𝗮𝘀 I will resist innovation that may reduce my Capex budget, even if it may also help reduce my Opex.
- 𝗝𝗼𝗯 𝗣𝗿𝗼𝘁𝗲𝗰𝘁𝗶𝗼𝗻𝗶𝘀𝗺 I resist innovation that may result in a more effective organization, i.e., fewer FTEs.
- 𝗖𝗮𝗽𝗮𝗰𝗶𝘁𝘆 𝗖𝗼𝗺𝗳𝗼𝗿𝘁 𝗦𝘆𝗻𝗱𝗿𝗼𝗺𝗲: The more physical capacity I build into my network, the more we can relax. Our goal is a “Zero Worry Network.”
- 𝗧𝗵𝗲 𝗙𝗲𝗮𝗿 𝗙𝗮𝗰𝘁𝗼𝗿: The leadership is “easy to scare” when arguing for more capacity Capex opposed to the “if-not”-consequences. (e.g., losing best network awards, poorer customer experience, …).
- 𝗧𝗵𝗲 𝗕𝘂𝗱𝗴𝗲𝘁 𝗜𝗻𝗲𝗿𝘁𝗶𝗮 Return on Investment (ROI) prioritization is rarely considered (rigorously), particularly after a budget has been released.
𝗔 𝘄𝗮𝗿𝗻𝗶𝗻𝗴: although each is observable in the live, the reader should be aware that there is also a fair amount of deliberate ironic provocation in the above heuristics.
We should never underestimate that within companies, two things make you important (including self-important and self-worthy) … It is: (1) The size of your organization and (2) the amount of money, your budget size, you have for your organization to be busy with.
Any innovation that may lower an organization’s size and budget will be met with resistance from that organization.
The Balancing Act of Capex to Opex Transformations.
Telco cost structures and Capex have evolved significantly due to accounting changes, valuation strategies, technological advancements, and economic pressures. While shifts like IFRS (International Financial Reporting Standards), issued by the International Accounting Standards Board (IASB), have altered how costs are reported and managed, changes in business strategies, such as cell site spin-offs, cloud migrations, and the transition to software-defined networks, have reshaped Capex allocations somewhat. At the same time, economic crises and competitive pressures have influenced Telcos to continually reassess their capital investments, balancing the need to optimize value, innovation, and growth with financial diligence.
One of the most significant drivers of change has been the shift in accounting standards, particularly with the introduction of IFRS16, which replaced the older GAAP-based approaches. Under IFRS16, nearly all leases are now recognized on the balance sheet as right-of-use assets and corresponding liabilities. This change has particularly impacted Telcos, which often engage in long-term leases for cell sites, network infrastructure, and equipment. Previously, under GAAP (Generally Accepted Accounting Principles), many leases were treated as operating leases, keeping them off the balance sheet, and their associated costs were considered operational expenditures (Opex). Now, under IFRS16, these leases are capitalized, leading to an increase in reported Capex as assets and liabilities grow to reflect the leased infrastructure. This shift has redefined how Telcos manage and report their Capex, as what was previously categorized as leasing costs now appears as capital investments, altering key financial metrics like EBITDA and debt ratios that would appear stronger post-IFRS16.
Simultaneously, valuation strategies and financial priorities have driven significant shifts in Telco Capex. Telecom companies have increasingly focused on enhancing metrics such as EBITDA and capital efficiency, leading them to adopt strategies to reduce heavy capital investments. One such strategy is the cell site spin-off, where Telcos sell off their tower and infrastructure assets to specialized independent companies or create separate entities that manage these assets. These spin-offs have allowed Telcos to reduce the Capex tied to maintaining physical assets, replacing it with leasing arrangements, which shift costs towards operational expenses. As a result, Capex related to infrastructure declines, freeing up resources for investments in other areas such as technology upgrades, customer services, and digital transformation. The spun-off infrastructures often result in significant cash inflows from sales. The telcos can then use this cash to improve their balance sheets by reducing debt, reinvesting in new technologies, or distributing higher dividends to shareholders. However, this shift may also reduce control over critical network infrastructure and create long-term lease obligations, resulting in substantial operational expenses as telcos will have to pay the rental costs on the spun-off infrastructure, increasing Opex pressure. I regularly see analysts using the tower spin-off as an argument for why Capex requirements of telcos are no longer wholly trustworthy and, in particular, in comparison with the past capital spending as the passive part of the cell site built used to be a substantial share mobile site Capex of up to 50% to 60% for a standard site built and beyond that for special sites. I believe that as not many new cell sites are being built any longer, and certainly not as many as in the 90s and 2000s, this effect is very minor on the overall Capex. Most new sites are built at a maintenance level, covering new residential or white spot areas.
When considering mobile network evolution and the impact of higher frequencies, it is important not to default to the assumption that more cell sites will always be necessary. If all things are equal, the coverage cell range of a high carrier frequency would be shorter (often much shorter) than the coverage range at a lower frequency. However, all things are not equal. This misconception arises from a classical coverage approach, where the frequency spectrum is radiated evenly across the entire cell area. However, modern cellular networks employ advanced technologies such as beamforming, which allows for more precise and efficient distribution of radio energy. Beamforming concentrates signal power in specific directions rather than thinly spreading it across a wide area, effectively increasing reach and signal quality without additional sites. Furthermore, the support for asymmetric downlink (higher) and uplink (lower) carrier frequencies allows for high-quality service downlink and uplink in situations where the uplink might be challenged at higher frequencies.
Moreover, many mobile networks today have already been densified to accommodate coverage needs and capacity demands. This densification often occurred when spectrum resources were scarce, and the solution was to add more sites for improved performance rather than simply increasing coverage. As newer frequency bands become available, networks can leverage beamforming and existing densification efforts to meet coverage and capacity requirements without necessarily expanding the number of cell sites. Thus, the focus should be optimizing the deployment of advanced technologies like beamforming and Massive MIMO rather than increasing the site count by default. In many cases, densified networks are already equipped to handle higher frequencies, making additional sites unnecessary for coverage alone.
The migration to public cloud solutions from, for example, Amazon’s AWS or Microsoft Azure is another factor influencing the Capex of Telcos. Historically, telecom companies relied on significant upfront Capex to build and maintain their own data centers or switching locations (as they were once called, as these were occupied mainly by the big legacy telecom proprietary telco switching infrastructure), network operations centers, and IT (monolithic) infrastructure. However, with the rise of cloud computing, Telcos are increasingly migrating to cloud-based solutions, reducing the need for large-scale physical infrastructure investments. This shift from hardware to cloud services changes the composition of Capex as the need for extensive data center investments declines, and more flexible, subscription-based cloud services are adopted. Although Capex for physical infrastructure decreases, there is a shift towards Opex as Telcos pay for cloud services on a usage basis.
Further, the transition to software-defined networks (SDNs) and software-centric telecom solutions has transformed the nature of Telco Capex. In the past, Telcos heavily depended on proprietary hardware for network management, which required substantial Capex to purchase and maintain physical equipment. However, with the advancement of virtualization and SDNs, telcos have shifted away from hardware-intensive solutions to more software-driven architectures. This transition reduces the need for continuous Capex on physical assets like routers, switches, and servers and increases investment in software development, licensing, and cloud-based platforms. The software-centric model allows, in theory, Telcos to innovate faster and reduce long-term infrastructure costs.
The Role of Capex in Financial Statements.
Capital expenditures play a critical role in shaping a telecommunications company’s financial health, influencing its income statement, balance sheet, and cash flow statements in various ways. At the same time, Telcos establish financial guardrails to manage the impact of Capex spending on dividends, liquidity, and future cash needs.
In the income statement (see Figure 15 below), Capex does not appear directly as an expense when it is incurred. Instead, it is capitalized on the balance sheet and then expensed over time through depreciation (for tangible assets) or amortization (for intangible assets). This gradual recognition of the Capex expenditure leads to higher depreciation or amortization charges over future periods, reducing the company’s net income. While the immediate impact of Capex is not seen on the income statement, the long-term effects can improve revenue when investments enhance capacity and quality, as with technological upgrades like 5G infrastructure. However, these benefits are offset by the fact that depreciation lowers profitability in the short term (as the net profit is lowered). The last couple of radio access technology (RAT) generations have, in general, caused an increase in telcos’ operational expenses (i.e., Opex) as more cell sites are required, heavier site configurations are implemented (e.g., multi-band antennas, massive MiMo antennas), and energy consumption has increased in absolute terms. Despite every new generation having become relatively more energy efficient in terms of the kWh/GB, in absolute terms, this is not the case, and that matters for the income statement and the incurred operational expenses.

On the balance sheet (see Figure 16 below), Capex increases the value of a company’s fixed assets, typically recorded as property, plant, and equipment (PP&E). As new assets are added, the company’s overall asset base grows. However, this is balanced by the accumulation of depreciation, which gradually reduces the book value of these assets over time. How Capex is financed also affects the company’s liabilities or equity. If debt is used to finance Capex, the company’s liabilities increase; if equity financing is used, shareholders’ equity increases. The Balance Sheet together with the Depreciation & Amortization (D&A), typically given in the income statement, can help us estimate the amount of Capex a Telco has spend. The capital expense, typically not directly reported in a companies financial statements, can be estimated by adding the changes between subsequent years of PP&E and Intangible Assets to the D&A.

In the cash flow statement, Capex appears as an outflow under the category of cash flows from investing activities, representing the company’s spending on long-term assets. In the short term, this creates a significant reduction in cash. However, well-planned Capex to enhance infrastructure or expand capacity can lead to higher operating cash flows in the future. If Capex is funded through debt or equity issuance, the inflow of funds will be reflected under cash flows from financing activities.

To ensure Capex does not overly strain the company’s financial health or limit returns to shareholders, Telcos put in place financial guardrails. Regarding dividends, many companies set specific dividend payout ratios, ensuring that a portion of earnings or free cash flow is consistently returned to shareholders. This practice balances returning value to shareholders while retaining sufficient earnings to fund operations and investments. It is also not unusual that Telco’s commit a given dividend level to shareholders, that as a consequence may place a limit on Capex spending or result in Capex tasking within a given planning period, as management must balance cash outflows between shareholder returns and strategic investments. This may lead to prioritizing essential projects, delaying less critical investments, or seeking alternative financing to maintain both Capex and dividend commitments. Additionally, Telcos often use dividend coverage ratios to ensure they can sustain dividend payouts even during periods of heavy capital expenditure.
Some telcos have chosen not to commit dividends to shareholders in order to maximize Capex investments, aiming to reinvest profits into the business to drive long-term growth and create higher shareholder value. This strategy prioritizes network expansion, technological upgrades, and new market opportunities over immediate cash returns, allowing the company to maintain financial flexibility and pursue strategic objectives more aggressively. When a telco decides to start paying dividends, it may indicate that management believes there are fewer high-value investment opportunities that can deliver returns above the company’s cost of capital. The decision to pay dividends often reflects the view that shareholders may derive greater value from the cash than the company could generate by reinvesting it. Often it signals a shift to a higher degree of maturity (e.g., corporate or market wise) from having been a growth focused company (i.e., the Telco has past the inflection point of growth). An example of maturity, and maybe less about growth opportunities, is the case of T-Mobile USA which in 2024 announced that it would start to pay dividend for the first time in its history targeting a 10 percent annually per share (note: Deutsche Telekom AG gained ownership in 2001, the company was founded in 1994).
Liquidity management is another consideration. Companies monitor their liquidity through current or quick ratios to ensure they can meet short-term obligations without cutting dividends or pausing important Capex projects. To provide an additional safety net, Telcos often maintain cash reserves or access to credit lines to handle immediate financial needs without disrupting long-term investment plans.
Regarding debt management, Telcos must carefully balance using debt to finance Capex. Companies often track their debt-to-equity ratio to avoid over-leveraging, which can lead to higher interest expenses and reduced financial flexibility. Another common metric is net debt to EBITDA, which ensures that debt levels remain manageable concerning the company’s earnings. To avoid breaching agreements with lenders, Telcos often operate under covenants that limit the amount they can spend on Capex without negatively affecting their ability to service debt or pay dividends.
Telcos also plan long-term cash flow to ensure Capex investments align with future financial needs. Many companies establish a capital allocation framework that prioritizes projects with the highest returns, ensuring that investments in infrastructure or technology do not jeopardize future cash flow. Free cash flow (FCF) is a particularly important metric in this context, as it represents the amount of cash available after covering operating expenses and Capex. A positive FCF ensures the company can meet future cash needs while returning value to shareholders through dividends or share buybacks.
Capex budgeting and prioritization are also essential tools for managing large investments. Companies assess the expected return on investment (ROI) and the payback period for Capex projects, ensuring that capital is allocated efficiently. Projects with assumed high strategic value, such as 5G infrastructure upgrades, household fiber coverage, or strategic fiber overbuilt, are often prioritized for their potential to drive long-term revenue growth. Monitoring the Capex-to-sales ratio helps ensure that capital investments are aligned with revenue growth, preventing over-investment in infrastructure that may not yield sufficient returns.
CAPEX EXPECTATIONS 2024 to 2026.
Considering all of the 54 telcos, ignoring MasMovil and WindHellas that are in the process of being integrated, in the pool of New Street Research Quarterly review each with their individual as well as country “peculiarities” (e.g., state of 5G deployment, fiber-optical coverage, fiber uptake, merger-resulting integration Capex, general revenue trends, …), it is possible to get a directional idea of how Capex will develop for each individual telco as well as the overall trend. This is illustrated in the Figure below on a Western European level.

I expect that we will not see a Capex reduction in 2024, supported by how Capex in the third and fourth quarters usually behave compared to the first two quarters, and due to integration and transformation Capex that will carry from 2023 into 2024 and possibly with a tail-end in 2024. I expect most telcos will cut back on new mobile investments, even if some might start ripping out radio access infrastructure from Chinese suppliers. However, I also believe that telcos will try to delay replacement to 2026 to 2028, when the first round of 5G modernization activities would be expected (and even overdue for some countries).
While 5G networks have made significant advancements, the rollout of 5G SA remains limited. By the end of 2023, only five of 39 markets analyzed by GSMA have reached near-complete adoption of 5G SA networks. 17 markets had yet to launch 5G SA at all. One of the primary barriers is the high cost of investment required to build the necessary infrastructure. The expansion and densification of 5G networks, such as installing more base stations, are essential to support 5G SA. According to GSMA, many operators are facing financial hurdles, as returns in many markets have been flat, and any increase is mainly due to inflationary price corrections rather than incremental or new usage occurring. I suspect that telcos may also be more conservative (and even more realistic, maybe) in assessing the real economic potential of the features being enabled by migrating to 5G SA, e.g., advanced network slicing, ultra-low latency, and massive IoT capabilities in comparison with the capital investments and efforts that they would need to incur. I should point out that any core network investments supporting 5G SA would not be expected to have a visible impact on telcos Capex budgets as this would be expected to be less than 10% of the mobile capex.

In 2022, a bit more than 50% of all Western European households were covered by fiber (see Figure 18 above), which amounts to approximately 85 million households with fiber coverage. This also leaves approximately 80 million households without fiber reach. Almost 60% of households without fiber coverage are in Germany (38%) and the UK (21%). Both Germany and the UK contributed about 40% of the total Western European Capex spend in 2022.
Moreover, I expect there are still Western European markets where the Capex priority is increasing the fiber-optic household coverage. In 2022, there was a peak in new households covered by fiber in Western Europe (see Figure 15 below), with 13+ million households covered according to the European Commission’s report “Broadband Coverage in Europe 2013-2022“. Germany (a fiber laggard) and the UK, which account for more than 35% of the Western European Capex, are expected to continue to invest substantially in fiber coverage until the end of the decade. As Figure 19 below illustrates, there is still a substantial amount of Capex required to close the fixed broadband coverage gap some Western European countries have.

I should point out that I am not assuming that telcos would be required over the next couple of years to swap out Chinese suppliers outside the scope of the European Commission “The EU 5G Toolkit for Security” framework that mainly focuses on 5G mobile networks eventually including the radio access network. It should be kept in mind that there is a relatively big share of high-risk suppliers within the Western European (actually in most European Union member states) fixed broadband networks (e.g., core routers & switches, SBCs, OLT/ONTs, MSAPs) that if subjected to “5G Toolkit for Security”-like regulation, such as in effect in Denmark (i.e., “The Danish Investment Screening Act”), would result in substantial increase in telcos fixed capital spend. We may see that some Western European telcos will commence replacement programs as equipment becomes obsolete (or near obsolete), and I would expect that the fixed broadband Capex will remain relatively high for telcos in Western Europe even beyond 2026.
Thus, overall, I think it is not unrealistic to anticipate a decrease in Capex over the next 3 years. Contrary to some analysts’ expectations, I do not see the lower Capex level being persistent but rather what to expect due to the reasons given above in this blog.

CAPEX EXPECTATIONS TOWARDS 2030.
Taking the above Capex forecasting approach, based on the individual 54 Western European telcos in the New Street Research Quarterly review, it is relatively straightforward, but not per se very accurate, to extend to 2030, as shown in the figure below.
It is worth mentioning that predicting Capex’s reliability over such a relatively long period of ten years is prone to a high degree of uncertainty and can actually only be done with relatively high reliability if very detailed information is available on each telco’s long-term, short-term and strategy as well as their economic outlook. In my experience from working with very detailed bottom-up Capex models covering a five and beyond-year horizon (which is not the approach I have used here simply for lack of information required for such an exercise not to be futile), it is already prone to a relatively high degree of uncertainty even with all the information, solid strategic outlook, and reasonable assumptions up front.

The capital expenditure trends in Western Europe from 2020 to 2030, with projections indicating a steady investment curve (remember that this is the aggregation of 54 Western European telcos Capex development over the period).
A noticeable rise in Capex towards 2030 can be attributed to several key factors, primarily the modernization of 5G Radio Access Networks (RAN). This modernization effort will likely include upgrades to the current 5G infrastructure and potential integration of 6G (or renamed 5G SA) capabilities as Europe prepares for the next generation of mobile technology, which I still believe is an unavoidable direction. Additionally, deploying or expanding 5G Standalone (SA) networks, which offer more advanced features such as network slicing and ultra-low latency, will further drive investments.
Another significant factor contributing to the increased Capex is the planned replacement of high-risk suppliers in the mobile domain. Countries across Western Europe are expected to phase out network equipment from suppliers deemed risky for national security, aligning with broader EU efforts to ensure a secure telecommunications infrastructure. I expect a very strong push from some member state regulators and the European Commission to finish the replacement by 2027/2028. I also expect impacted telcos (of a certain size) to push back and attempt to time a high-risk supplier swap out with their regular mobile infrastructure obsolescence program and introduction of 6G in their networks towards and after 2030.

Simultaneously, Western Europe is expected to complete the extensive rollout of fiber-to-the-home (FTTH) networks, as illustrated by Figure 20 above, particularly in countries lagging behind in fiber deployment, such as Germany, the UK, Belgium, Austria, and Greece. These EU member states will likely have finished covering the majority of households (80+%) with high-speed fiber by the end of the decade. On this topic, we should remember that telcos are using various fiber deployment models that minimize (and optimize) their capital investment levels. By 2030 I would expect that almost 80% of all Western European households will be covered with fiber and thus most consumers and businesses will have easy access to gigabit services to their homes by then (and for most countries long before 2030). Germany is still expected to be the Western European fiber laggard by 20230, with an increased share of 50+% of German households not being covered by fiber (note: in 2022, this was 38%). Most other countries will have reached and exceeded 80% fiber household coverage.
It is also important to note that my Capex model does not assume the extension of the European Commission’s 5G Security Toolkit, which focuses on excluding high-risk suppliers in the 5G domain to fixed broadband networks. If the legal framework were to be applied to the fixed broadband sector as well, an event that I see to be very likely, forcing the removal of high-risk suppliers from fiber broadband networks, Capex requirements would likely increase significantly beyond the projections represented in my assessment with the last years of the decade focused on high-risk supplier replacement in Western European Telcos fixed broadband transport and IP networks. While it is I don’t see a (medium-high) risk that all CPEs would be included in a high-risk supplier ban. However, I do believe that CPEs with the ONT integrated may be required to replace their installed CPE base. If a high-risk supplier ban were to include the ONT, there would be several implications.
Any CPEs that use components from the banned supplier would need to be replaced or retrofitted to ensure compliance. This would require swapping the integrated CPE/ONT units for separate CPE and ONT devices from approved suppliers, which could add to installation costs and increase deployment time. Service providers would also need to reassess their network equipment supply chain, ensuring that new ONTs and CPEs meet regulatory standards for security and compliance. Moreover, replacing equipment could potentially disrupt existing service, necessitating careful planning to manage the transition without major outages for customers. This situation would likely also require updates to the network configuration, as replacing an integrated CPE/ONT device could involve reconfiguring customer devices to work seamlessly with the new setup. I believe it is very likely that telcos eventually will offer fixed broadband service, including CPEs and home gateways, that are free of high-risk suppliers end-2-end (e.g., for B2B and public institutions, e.g., defense and other critically sensitive areas). This may extend to requirements that employees working in or with sensitive areas will need a certificate of high-risk supplier-free end-2-end fixed broadband connection to be allowed to work from home or receive any job-related information (this could extend to mobile devices as well). Again, substantial Capex (and maybe a fair amount of time as well) would be required to reach such a high-risk supplier reduction.
AN ALTERNATE REALITY.
I am unsure whether William Webb’s idea of “The End of Telecoms History” (I really recommend you get his book) will have the same profound impact as Francis Fukuyama’s marvelously thought-provoking book “The End of History and the Last Man“ or be more “right” than Fukuyama’s book. However, I think it may be an oversimplification of his ideas to say that he has been proven wrong. The world of Man may have proven more resistant to “boredom” than the book assumed (as Fukuyama conceded in subsequent writing). Nevertheless, I do not believe history can be over unless the history makers and writers are all gone (which may happen sooner rather than later). History may have long and “boring” periods where little new and disruptive things happen. Still, historically, something so far has always disrupted the hiatus of history, followed by a quieter period (e.g., Pax Romana, European Feudalism, Ming Dynasty, 19th century’s European balance of power, …). The nature of history is cyclic. Stability and disruption are not opposing forces but part of an ongoing dynamic. I don’t think telecommunication would be that different. Parts of what we define as telecom may reach a natural end and settle until it is disrupted again; for example, the fixed telephony services on copper lines were disrupted by emerging mobile technologies driven by radio access technology innovation back in the 90s and until today. Or, like circuit-switched voice-centric technologies, which have been replaced by data-centric packet-switched technologies, putting an “end” to the classical voice-based business model of the incumbent telecommunication corporations.
At some point in the not-so-distant future (2030-2040), all Western European households will be covered by optical fiber and have a fiber-optic access connection with indoor services being served by ultra-WiFi coverage (remember approx. 80% of mobile consumption happens indoors). Mobile broadband networks have by then been redesigned to mainly provide outdoor coverage in urban and suburban areas. These are being modernized at minimum 10-year cycles as the need for innovation is relatively minor and more focused on energy efficiency and CO2 footprint reductions. Direct-to-cell (D2C) LEO satellite or stratospheric drone constellations utilizing a cellular spectrum above 1800 MHz serve outdoor coverage of rural regions, as opposed to the current D2C use of low-frequency bands such as 600 – 800 MHz (as higher frequency bands are occupied terrestrially and difficult to coordinate with LEO Satellite D2C providers). Let’s dream that the telco IT landscape, Core, transport, and routing networks will be fully converged (i.e., no fixed silo, no mobile silo) and autonomous network operations deal with most technical issues, including planning and optimization.
In this alternate reality, you pay for and get a broadband service enabled by a fully integrated broadband network. Not a mobile service served by a mobile broadband network (including own mobile backhaul, mobile aggregation, mobile backbone, and mobile core), and, not a fixed service served by a fixed broadband network different from the mobile infrastructure.
Given the Western European countries addressed in this report (i.e., see details in Further Reading #1), we would need to cover a surface area of 3.6 million square kilometers. To ensure outdoor coverage in urban areas and road networks, we may not need more than about 50,000 cell sites compared to today’s 300 – 400 thousand. If the cellular infrastructure is shared, the effective number of sites that are paid in full would be substantially lower than that.
The required mobile Capex ballpark estimate would be a fifth (including its share of related fixed support investment, e.g., IT, Core, Transport, Switching, Routing, Product development, etc.) of what it otherwise would be if we continue “The Mobile History” as it has been running up to today.
In this “Alternate Reality” ” instead of having a mobile Capex level of about 10% of the total fixed and mobile revenue (~15+% of mobile service revenues), we would be down to between 2% and 3% of the total telecom revenues (assuming it remains reasonably flat at a 2023 level. The fixed investment level would be relatively low, household coverage would be finished, and most households would be connected. If we use numbers of fixed broadband Capex without substantial fiber deployment, that level should not be much higher than 5% of the total revenue. Thus, instead of today’s persistent level of 18% – 20% of the total telecom revenues, in our “Alternate Reality,” it would not exceed 10%. And just imagine what such a change would do to the operational cost structure.
Obviously, this fictive (and speculative) reality would be “The End of Mobile History.”
It would be an “End to Big Capex” and a stop to spending mobile Capex like there is no (better fixed broadband) tomorrow.

ACKNOWLEDGEMENT.
I greatly acknowledge my wife, Eva Varadi, for her support, patience, and understanding during the creative process of writing this Blog. There should be no doubt that without the support of Russell Waller (New Street Research), this blog would not have been possible. Thank you so much for providing the financial telco data for Western Europe that lays the ground for much of the Capex analysis in this article. This blog has also been published in telecomanalysis.net with some minor changes and updates.
FURTHER READING.
- New Street Research covers the following countries in their Quarterly report: Austria, Belgium, Denmark, Finland, France, Germany, Greece, Italy, Netherlands, Norway, Portugal, Spain, Sweden, Switzerland, and the United Kingdom. Across those 15 countries, ca. 56 telcos are covered.
- Kim Kyllesbech Larsen, “Navigating the Future of Telecom Capex: Western Europe’s Telecom Investment 2024 to 2030,” telecomanalysis.net, (October 2024).
- Kim Kyllesbech Larsen, “The Nature of Telecom Capex – a 2023 Update”, techneconomyblog.com, (July 2023).
- Kim Kyllesbech Larsen, “The Nature of Telecom Capex,” techneconomyblog.com, (July 2022).
- Rupert Wood, “A crisis of overproduction in bandwidth means that telecoms capex will inevitably fall,” Analysys Mason (July 2024). A rather costly (for mortals & their budgets, at least) report called “The end of big capex: new strategic options for the telecoms industry” allegedly demonstrates the crisis.
- European Commission, “Cybersecurity of 5G networks – EU Toolbox of risk mitigating measures”, (January 2020).
- European Commission, “The EU Toolbox for 5G Security”, (2020).
- European Commission, “5G security: Member States report on progress on implementing the EU toolbox and strengthening safety measures”, (July 2020). It also includes a link to the actual Member States progress report on 5G Security.
- European Commission, “Second report on the implementation of the EU 5G cybersecurity toolbox”, (June 2023).
- Danish Investment Screening Act, “Particularly sensitive sectors and activities,” Danish Business Authority, (July 2021). Note that the “Danish Investment Screening Act” is closely aligned with broader European Union (EU) frameworks and initiatives to safeguard critical infrastructure from high-risk foreign suppliers. The Act reflects Denmark’s effort to implement national and EU-level policies to protect sensitive sectors from foreign investments that could pose security risks, particularly in critical infrastructure such as telecommunications, energy, and defense.
- Cynthia Kroet, “Eleven EU countries took 5G security measures to ban Huawei, ZTE”, Euro News, (August 2024).
- Michael Stenvei, “Historisk indgreb: TDC tvinges til at droppe Huawei-aftale”, Finans.dk, (May 2023).
- Mathieu Pollet, “Time to cut back on Huawei, German minister tells telecoms giants,” Politico (August 2023).
- German press on high-risk suppliers in German telecommunications networks: “Zeit für den Abschied von Huawei, sagt Innenministerin Faeser” (Handelsblatt, August 18, 2023), “Deutsche Telekom und Huawei: Warum die Abhängigkeit bleibt” (Die Welt, September 7, 2023), “Telekom-Netz: Kritik an schleppendem Rückzug von Huawei-Komponenten” (Der Spiegel, September 20, 2023), “Faeser verschiebt Huawei-Bann und stößt auf heftige Kritik” (Handelsblatt, July 18, 2024), “Huawei-Verbot in 5G-Netzen: Deutschland verschärft, aber langsam” (Tagesschau, July 15, 2024), and “Langsame Fortschritte: Deutschland und das Huawei-Dilemma” (Der Spiegel, September 21, 2024) and many many others.
- Iain Morris, “German Huawei ban to cost €2.5B and take years, no thanks to EU”, Light Reading (May 2023).
- Alexander Martin, “EU states told to restrict Huawei and ZTE from 5G networks ‘without delay’”, The Record, (June 2023).
- Strand Consult, “Understanding the Market for 4G RAN in Europe: Share of Chinese and Non-Chinese Vendors – in 102 Mobile Networks”, (2020).
- Strand Consult, “The Market for 5G RAN in Europe: Share of Chinese and Non-Chinese Vendors in 31 European Countries”, (2023).
- William Web, “The End of Telecoms History,” Kindle, (June 2024).
- GSMA, “The State of 5G 2024 – Introducing the GSMA Intelligence 5G Connectivity Index”, (February 2024).
- Speedtest.com, “Speedtest Global Index”, (August 2024).
- Ericsson Mobility Visualizer – Mobile Data Traffic.
- Kim Kyllesbech Larsen, “5G Economics – An Introduction (Chapter 1)”, techneconomyblog.com, (December 2016).
- Kim Kyllesbech Larsen, “Capacity planning in mobile data networks experiencing exponential growth in demand” (April 2012). See slide 5, showing that 50% of all data traffic is generated in 1 cell, 80% of data traffic is carried in up to 3 cells, and only 20% of traffic can be regarded as truly mobile. The presentation has been viewed more than 19 thousand times.
- Tom Copeland, Tim Koller, Jack Murrin, “Valuation – Measuring and Managing the Valuation of Companies,” John Wiley & Sons, (3rd edition, 2000). There are newer editions on Amazon.com today (e.g., 7th by now).
- Dean Bubley, “The 6G vision needs a Reset” (October 2024).
- Geoff Hollingworth, “Why 6G Reset and why I support”, (October 2024).
- Opanga, “The RAIN AI Platform”, provides a cognitive AI-based solution that addresses (1) Network Optimization lowering Capex demand and increasing the Customer Experience, (2) Energy Reduction above and beyond existing supplier solutions leading to further Opex efficiencies, and (3) Network Intelligence using AI to better manage your network data at a much higher resolution than is possible with classical dashboard applied to technology-driven data lakes.


![CV_X \; - \; CV_Y \; = \; \Delta Capex \; \left[ \frac{1 \; - \; g}{\; WACC \; - \; g \;} \right]](https://s0.wp.com/latex.php?latex=CV_X+%5C%3B+-+%5C%3B+CV_Y+%5C%3B+%3D+%5C%3B+%5CDelta+Capex+%5C%3B+%5Cleft%5B+%5Cfrac%7B1+%5C%3B+-+%5C%3B+g%7D%7B%5C%3B+WACC+%5C%3B+-+%5C%3B+g+%5C%3B%7D+%5Cright%5D&bg=ffffff&fg=333333&s=0&c=20201002)


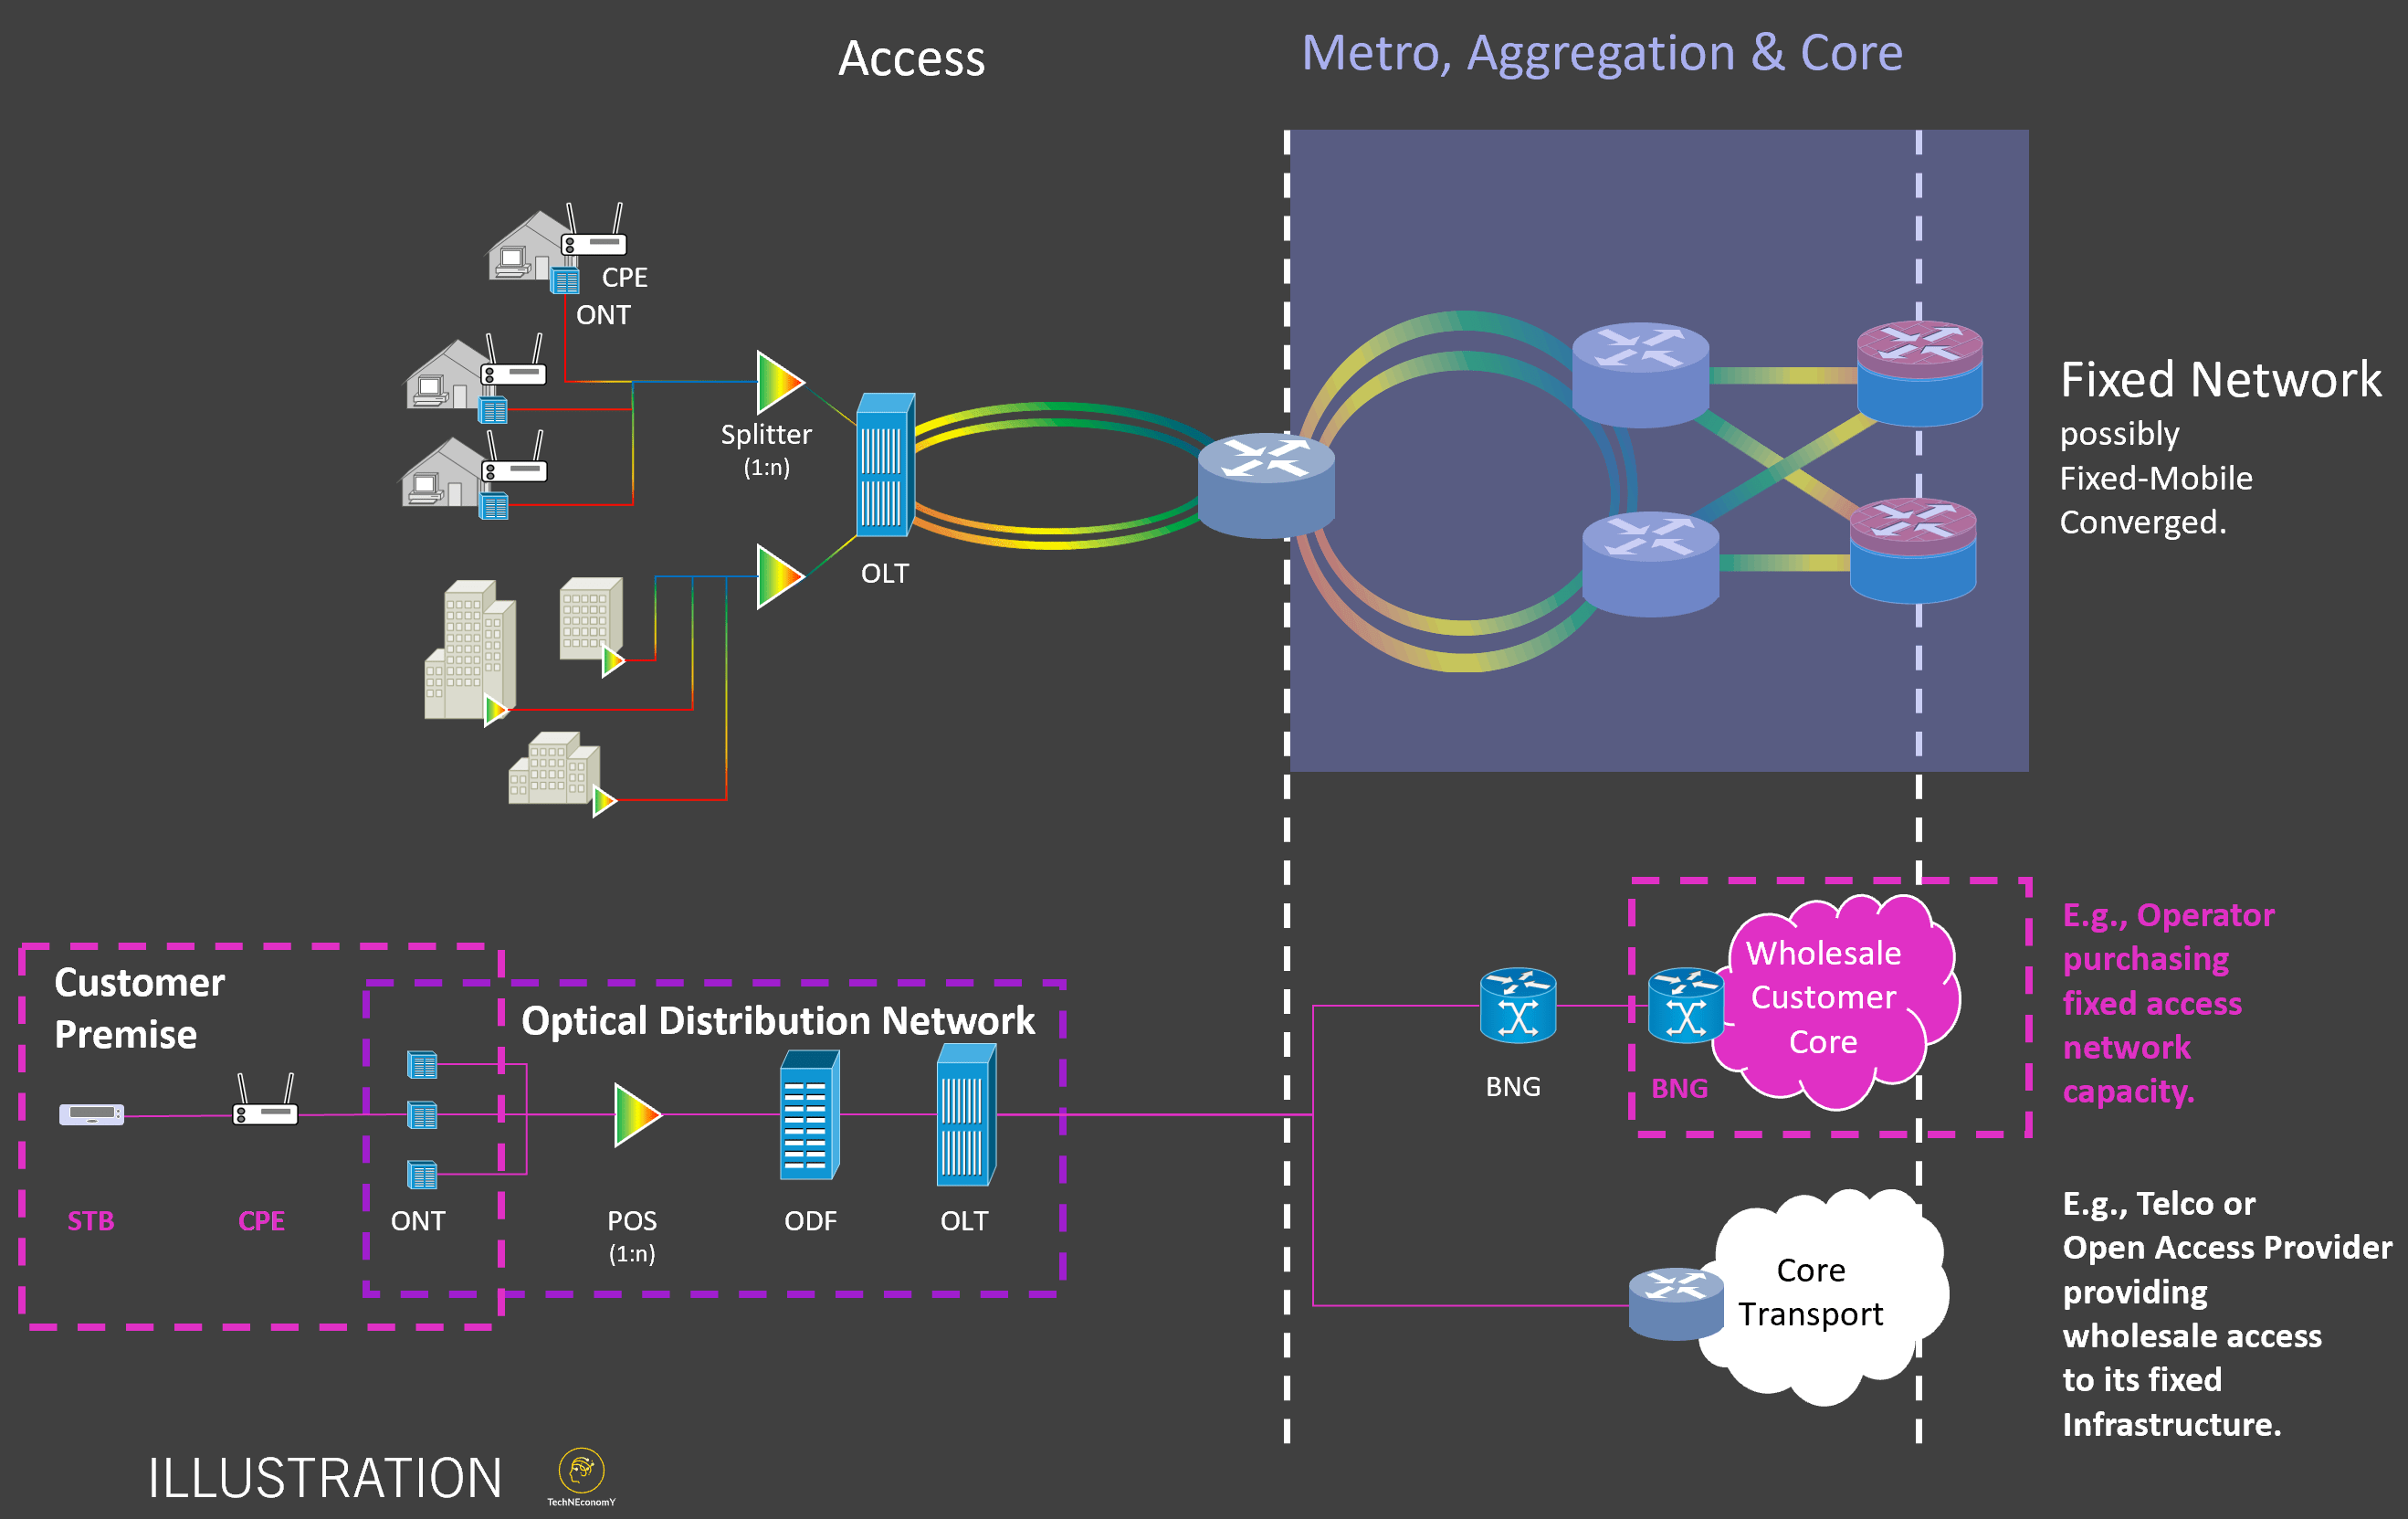


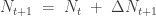

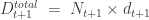
 or
or  ) is the direct driver of network load, and thus, network investments, the volumetric demand, is a manifestation of that throughput demand.
 being the number of active users in a given radio cell at the time-instant of unit t taken within a day.
  is the Bytes consumed in a time instant (e.g., typically a second); thus, 8
  bits/sec) in the same instant and take the maximum across. For example, a day provides the busiest hour throughput for the whole network. Each radio cell drives its capacity provision and supply (in bits/sec) and the investments required to provide that demanded capacity in the air interface and front- and back-haul.
 ) given in bits per second, the basic building block of quality, is relatively easy to estimate. The cellular throughput (per unit cell) is provided by the amount of committed frequency spectrum to the air interface, what your radio access network and antenna support are, multiplied by the so-called spectral efficiency in bits per Hz per cell. The spectral efficiency depends on the antenna technology and the underlying software implementation of signal processing schemes enabling the details of receiving and sending signals over the air interface.
 of ca. 20 Mbps/MHz/cell (i.e.,
  ), we should expect to have a cell throughput on average at 1,000 Mbps (1 Gbps).

