"It doesn't matter how beautiful your idea is, it doesn't matter how smart or important you are. If the idea doesn't agree with reality, it's wrong", Richard Feynman (paraphrased)
If Greenland were digitally cut off tomorrow, how much of its public sector would still function? The uncomfortable answer: very little. The truth is that not only would the public sector break down, but society as a whole would likely also break down the longer a digital isolation would be in effect. This article outlines why it does not necessarily have to be this way and suggests that some remedies and actions can be taken to minimize the impact of an event where Greenland would be digitally isolated from the rest of the internet for an extended period (e.g., weeks to months).
We may like, or feel tempted, to think of digital infrastructure as neutral plumbing. But as I wrote earlier, “digital infrastructure is no longer just about connectivity, but about sovereignty and resilience.” Greenland today has neither.
A recent Sermitsiaq article on Greenland’s “Digital Afhængighed af Udlandet” by Poul Krarup, which describes research work done by the Tænketanken Digital Infrastruktur, laid it bare and crystal clear: the backbone of Greenland’s administration, email, payments, and even municipal services, runs on servers and platforms that are located mainly outside Greenland (and Denmark). Global giants in Europe and the US hold the keys. Greenland doesn’t. My own research reveals just how dramatic this dependency is. The numbers from my own study of 315 Greenlandic public-sector domains make it painfully clear: over 70% of web/IP hosting is concentrated among just three foreign providers, including Microsoft, Google, and Cloudflare. For email exchanges (MX), it’s even worse: the majority of MX records sit entirely outside Greenland’s control.
So imagine the cable is cut, the satellite links fail, or access to those platforms is revoked. Schools, hospitals, courts, and municipalities. How many could still function? How many could even switch on a computer?
This isn’t a thought experiment. It’s a wake-up call.
In my earlier work on Greenland’s critical communications infrastructure, “Greenland: Navigating Security and Critical Infrastructure in the Arctic – A Technology Introduction”, I have pointed out both the resilience and the fragility of what exists today. Tusass has built and maintained a transport network that keeps the country connected under some of the harshest Arctic conditions. That achievement is remarkable, but it is also costly and economically challenging without external subsidies and long-term public investment. With a population of just 57,000 people, Greenland faces challenges in sustaining this infrastructure on market terms alone.
DIGITAL SOVEREIGNTY.
What do we mean when we use phrases like “the digital sovereignty of Greenland is at stake”? Let’s break down the complex language (for techies like myself). Sovereignty in the classical sense is about control over land, people, and institutions. Digital sovereignty extends this to the virtual space. It is primarily about controlling data, infrastructure, and digital services. As societies digitalize, critical aspects of sovereignty move into the digital sphere, such as,
Infrastructure as territory: Submarine cables, satellites, data centers, and cloud platforms are the digital equivalents of ports, roads, and airports. If you don’t own or control them, you depend on others to move your “digital goods.”
Data as a resource: Just as natural resources are vital to economic sovereignty, data has become the strategic resource of the digital age. Those who store, process, and govern data hold significant power over decision-making and value creation.
Platforms as institutions: Social media, SaaS, and search engines act like global “public squares” and administrative tools. If controlled abroad, they may undermine local political, cultural, or economic authority.
The excellent book by Anu Bradford, “Digital Empires: The Global Battle to Regulate Technology,” describes how the digital world is no longer a neutral, borderless space but is increasingly shaped by the competing influence of three distinct “empires.” The American model is built around the dominance of private platforms, such as Google, Amazon, and Meta, where innovation and market power drive the agenda. The scale and ubiquity of Silicon Valley firms have enabled them to achieve a global reach. In contrast, the Chinese model fuses technological development with state control. Here, digital platforms are integrated into the political system, used not only for economic growth but also for surveillance, censorship, and the consolidation of authority. Between these two poles lies the European model, which has little homegrown platform power but exerts influence through regulation. By setting strict rules on privacy, competition, and online content, Europe has managed to project its legal standards globally, a phenomenon Bradford refers to as the “Brussels effect” (which is used here in a positive sense). Bradford’s analysis highlights the core dilemma for Greenland. Digital sovereignty cannot be achieved in isolation. Instead, it requires navigating between these global forces while ensuring that Greenland retains the capacity to keep its critical systems functioning, its data governed under its own laws, and its society connected even when global infrastructures falter. The question is not which empire to join, but how to engage with them in a way that strengthens Greenland’s ability to determine its own digital future.
In practice, this means that Greenland’s strategy cannot be about copying one of the three empires, but rather about carving out a space of resilience within their shadow. Building a national Internet Exchange Point ensures that local traffic continues to circulate on the island rather than being routed abroad, even when external links fail. Establishing a sovereign GovCloud provides government, healthcare, and emergency services with a secure foundation that is not dependent on distant data centers or foreign jurisdictions. Local caching of software updates, video libraries, and news platforms enables communities to operate in a “local mode” during disruptions, preserving continuity even when global connections are disrupted. These measures do not create independence from the digital empires. Still, they give Greenland the ability to negotiate with them from a position of greater strength, ensuring that participation in the global digital order does not come at the expense of local control or security.
FROM DAILY RESILIENCE TO STRATEGIC FRAGILITY.
I have argued that integrity, robustness, and availability must be the guiding principles for Greenland’s digital backbone, both now and in the future.
Integrity means protecting against foreign influence and cyber threats through stronger cybersecurity, AI support, and autonomous monitoring.
Robustness requires diversifying the backbone with new submarine cables, satellite systems, and dual-use assets that can serve both civil and defense needs.
Availability depends on automation and AI-driven monitoring, combined with autonomous platforms such as UAVs, UUVs, IoT sensors, and distributed acoustic sensing on submarine cables, to keep services running across vast and remote geographies with limited human resources.
The conclusion I drew in my previous work remains applicable today. Greenland must develop local expertise and autonomy so that critical communications are not left vulnerable to outside actors in times of crisis. Dual-use investments are not only about defense; they also bring better services, jobs, and innovation.
Source: Tusass Annual Report 2023 with some additions and minor edits.
The Figureabove illustrates the infrastructure of the Greenlandic sole telecommunications provider, Tusass. Note that Tusass is the incumbent and only telecom provider in Greenland. Currently, five hydropower plants (shown above, location only indicative) provide more than 80% of Greenland’s electricity demand. Greenland is entering a period of significant infrastructure transformation, with several large projects already underway and others on the horizon. The most visible change is in aviation. Following the opening of the new international airport in Nuuk in 2024, with its 2,200-meter runway capable of receiving direct flights from Europe and North America, attention has turned to Ilulissat, on the Northwestern Coast of Greenland, and Qaqortoq. Ilulissat is being upgraded with its own 2,200-meter runway, a new terminal, and a control tower, while the old 845-meter strip is being converted into an access road. In southern Greenland, a new airport is being built in Qaqortoq, with a 1,500-meter runway scheduled to open around 2026. Once completed, these three airports, Nuuk, Ilulissat, and Qaqortoq, the largest town in South Greenland, will together handle roughly 80 percent of Greenland’s passenger traffic, reshaping both tourism and domestic connectivity. Smaller projects, such as the planned airport at Ittoqqortoormiit and changes to heliport infrastructure in East Greenland, are also part of this shift, although on a longer horizon.
Beyond air travel, the next decade is likely to bring new developments in maritime infrastructure. There is growing interest in constructing deep-water ports, both to support commercial shipping and to enable the export of minerals from Greenland’s interior. Denmark has already committed around DKK 1.6 billion (approximately USD 250 million) between 2026 and 2029 for a deep-sea port and related coastal infrastructure, with several proposals directly linked to mining ventures. In southern Greenland, for example, the Tanbreez multi-element rare earth project lies within reach of Qaqortoq, and the new airport’s specifications were chosen with freight requirements in mind. Other mineral prospects, ranging from rare earths to nickel and zinc, will require their own supporting infrastructure, roads, power, and port facilities, if the project transitions from exploration to production. The timelines for these mining and port projects are less certain than for the airports, since they depend on market conditions, environmental approvals, and financing. Yet it is clear that the 2025–2035 period will be decisive for Greenland’s economic and strategic trajectory. The combination of new airports, potential deep-water harbors, and the possible opening of significant mining operations would amount to the largest coordinated build-out of Greenlandic infrastructure in decades. Moreover, several submarine cable projects have been mentioned that would strengthen international connectivity to Greenland, as well as strengthen the redundancy and robustness of settlement connectivity, in addition to the existing long-haul microwave network connecting all settlements along the west coast from North to South.
And this is precisely why the question of a sudden digital cut-off matters so much. Without integrity, robustness, and availability built into the communications infrastructure, Greenland’s public sector and its critical infrastructure remain dangerously exposed. What looks resilient in daily operation could unravel overnight if the links to the outside world were severed or internal connectivity were compromised. In particular, the dependency on Nuuk is a critical risk.
GREENLAND’s DIGITAL INFRASTRUCTURE BY LAYER.
Let’s peel the digital onion layer by layer of Greenland’s digital infrastructure.
Is Greenland’s digital infrastructure broken down by the layers upon which society’s continuous functioning depends? This illustration shows how applications, transport, routing, and interconnect all depend on the external connectivity.
Greenland’s digital infrastructure can be understood as a stack of interdependent layers, each of which reveals a set of vulnerabilities. This is illustrated by the Figure above. At the top of the stack lie the applications and services that citizens, businesses, and government rely on every day. These include health IT systems, banking platforms, municipal services, and cloud-based applications. The critical issue is that most of these services are hosted abroad and have no local “island mode.” In practice, this means that if Greenland is digitally cut off, domestic apps and services will fail to function because there is no mechanism to run them independently within the country.
Beneath this sits the physical transport layer, which is the actual hardware that moves data. Greenland is connected internationally by just two subsea cables, routed via Iceland and Canada. A few settlements, such as Tasiilaq, remain entirely dependent on satellite links, while microwave radio chains connect long stretches of the west coast. At the local level, there is some fiber deployment, but it is limited to individual settlements rather than forming part of a national backbone. This creates a transport infrastructure that, while impressive given Greenland’s geography, is inherently fragile. Two cables and a scattering of satellites do not amount to genuine redundancy for a nation. The next layer is IP/TCP transport, where routing comes into play. Here, too, the system is basic. Greenland relies on a limited set of upstream providers with little true diversity or multi-homing. As a result, if one of the subsea cables is cut, large parts of the country’s connectivity collapse, because traffic cannot be seamlessly rerouted through alternative pathways. The resilience that is taken for granted in larger markets is largely absent here.
Finally, at the base of the stack, interconnect and routing expose the structural dependency most clearly. Greenland operates under a single Autonomous System Number (ASN). An ASN is a unique identifier assigned to a network operator (like Tusass) that controls its own routing on the Internet. It allows the network to exchange traffic and routing information with other networks using the Border Gateway Protocol (BGP). In Greenland, there is no domestic internet exchange point (IXP) or peering between local networks. All traffic must be routed abroad first, whether it is destined for Greenland or beyond. International transit flows through Iceland and Canada via the subsea cables, and via geostationary GreenSat satellite connectivity through Grand Canaria as a limited (in capacity) fallback that connected via the submarine network back to Greenland. There is no sovereign government cloud, almost no local caching for global platforms, and only a handful of small data centers (being generous with the definition here). The absence of scaled redundancy and local hosting means that virtually all of Greenland’s digital life depends on international connections.
GREENLAND’s DIGITAL LIFE ON A SINGLE THREAD.
Considering the many layers described above, a striking picture emerges: applications, transport, routing, and interconnect are all structured in ways that assume continuous external connectivity. What appears robust on a day-to-day basis can unravel quickly. A single cable cut, upstream outage, or local transmission fault in Greenland does not just slow down the internet. It can also disrupt it. It can paralyze everyday life across almost every sector, as much of the country’s digital backbone relies on external connectivity and fragile local transport. For the government, the reliance on cloud-hosted systems abroad means that email, document storage, case management, and health IT systems would go dark. Hospitals and clinics could lose access to patient records, lab results, and telemedicine services. Schools would be cut off from digital learning platforms and exam systems that are hosted internationally. Municipalities, which already lean on remote data centers for payroll, social services, and citizen portals, would struggle to process even routine administrative tasks. In finance, the impact would be immediate. Greenland’s card payment and clearing systems are routed abroad; without connectivity, credit and debit card transactions could no longer be authorized. ATMs would stop functioning. Shops, fuel stations, and essential suppliers would be forced into cash-only operations at best, and even that would depend on whether their local systems can operate in isolation. The private sector would be equally disrupted. Airlines, shipping companies, and logistics providers all rely on real-time reservation and cargo systems hosted outside Greenland. Tourism, one of the fastest-growing industries, is almost entirely dependent on digital bookings and payments. Mining operations under development would be unable to transmit critical data to foreign partners or markets. Even at the household level, the effects could be highly disruptive. Messaging apps, social media, and streaming platforms all require constant external connections; they would stop working instantly. Online banking and digital ID services would be unreachable, leaving people unable to pay bills, transfer money, or authenticate themselves for government services. As there are so few local caches or hosting facilities in Greenland, even “local” digital life evaporates once the cables are cut. So we will be back to reading books and paper magazines again.
This means that an outage can cascade well beyond the loss of entertainment or simple inconvenience. It undermines health care, government administration, financial stability, commerce, and basic communication. In practice, the disruption would touch every citizen and every institution almost immediately, with few alternatives in place to keep essential civil services running.
GREENLAND’s DIGITAL INFRASTRUCTURE EXPOSURE: ABOUT THE DATA.
In this inquiry, I have primarily analyzed two pillars of Greenland’s digital presence: web/IP hosting, as well as MX (mail exchange) hosting. These may sound technical, but they are fundamental to understanding. Web/IP hosting determines where Greenland’s websites and online services physically reside, whether inside Greenland’s own infrastructure or abroad in foreign data centers. MX hosting determines where email is routed and processed, and is crucial for the operation of government, business, and everyday communication. Together, these layers form the backbone of a country’s digital sovereignty.
What the data shows is sobering. For example, the Government’s own portal nanoq.gl is hosted locally by Tele Greenland (i.e., Tusass GL), but its email is routed through Amazon’s infrastructure abroad. The national airline, airgreenland.gl, also relies on Microsoft’s mail servers in the US and UK. These are not isolated cases. They illustrate the broader pattern of dependence. If hosting and mail flows are predominantly external, then Greenland’s resilience, control, and even lawful access are effectively in the hands of others.
The data from the Greenlandic .gl domain space paints a clear and rather bleak picture of dependency and reliance on the outside world. My inquiry covered 315 domains, resolving more than a thousand hosts and IPs and uncovering 548 mail exchangers, which together form a dependency network of 1,359 nodes and 2,237 edges. What emerges is not a story of local sovereignty but of heavy reliance on external, that is, outside Greenland, hosting.
When broken down, it becomes clear how much of the Greenlandic namespace is not even in use. Of the 315 domains, only 190 could be resolved to a functioning web or IP host, leaving 125 domains, or about 40 percent, with no active service. For mail exchange, the numbers are even more striking: only 98 domains have MX records, while 217 domains, it would appear, cannot be used for email, representing nearly seventy percent of the total. In other words, the universe of domains we can actually analyze shrinks considerably once you separate the inactive or unused domains from those that carry real digital services.
It is within this smaller, active subset that the pattern of dependency becomes obvious. The majority of the web/IP hosting we can analyze is located outside Greenland, primarily on infrastructure controlled by American companies such as Cloudflare, Microsoft, Google, and Amazon, or through Danish and European resellers. For email, the reliance is even more complete: virtually all MX hosting that exists is foreign, with only two domains fully hosted in Greenland. This means that both Greenland’s web presence and its email flows are overwhelmingly dependent on servers and policies beyond its own borders. The geographic spread of dependencies is extensive, spanning the US, UK, Ireland, Denmark, and the Netherlands, with some entries extending as far afield as China and Panama. This breadth raises uncomfortable questions about oversight, control, and the exposure of critical services to foreign jurisdictions.
Security practices add another layer of concern. Many domains lack the most basic forms of email protection. TheSender Policy Framework(SPF), which instructs mail servers on which IP addresses are authorized to send on behalf of a domain, is inconsistently applied. DomainKeys Identified Mail(DKIM), which uses cryptographic signatures to verify that an email originates from the claimed sender, is also patchy. Most concerning is that Domain-based Message Authentication, Reporting, and Conformance(DMARC), a policy that allows a domain to instruct receiving mail servers on how to handle suspicious emails (for example, reject or quarantine them), is either missing or set to “none” for many critical domains. Without SPF, DKIM, and DMARC properly configured, Greenlandic organizations are wide open to spoofing and phishing, including within government and municipal domains.
Taken together, the picture is clear. Greenland’s digital backbone is not in Greenland. Its critical web and mail infrastructure lives elsewhere, often in the hands of hyperscalers far beyond Nuuk’s control. The question practically asks itself: if those external links were cut tomorrow, how much of Greenland’s public sector could still function?
GREENLAND’s DIGITAL INFRASTRUCTURE EXPOSURE: SOME KEY DATA OUT OF A VERY RICH DATASET.
The Figure shows the distribution of Greenlandic (.gl) web/IP domains hosted on a given country’s infrastructure. Note that domains are frequently hosted in multiple countries. However, very few (2!) have an overlap with Greenland.
The chart of Greenland (.gl) Web/IP Infrastructure Hosting by Supporting Country reveals the true geography of Greenland’s digital presence. The data covers 315 Greenlandic domains, of which 190 could be resolved to active web or IP hosts. From these, I built a dependency map showing where in the world these domains are actually served.
The headline finding is stark: 57% of Greenlandic domains depend on infrastructure in the United States. This reflects the dominance of American companies such as Cloudflare, Microsoft, Google, and Amazon, whose services sit in front of or fully host Greenlandic websites. In contrast, only 26% of domains are hosted on infrastructure inside Greenland itself (primarily through Tele Greenland/Tusass). Denmark (19%), the UK (14%), and Ireland (13%) appear as the next layers of dependency, reflecting the role of regional resellers, like One.com/Simply, as well as Microsoft and Google’s European data centers. Germany, France, Canada, and a long tail of other countries contribute smaller shares.
It is worth noting that the validity of this analysis hinges on how the data are treated. Each domain is counted once per country where it has active infrastructure. This means a domain like nanoq.gl (the Greenland Government portal) is counted for both Greenland and its foreign dependency through Amazon’s mail services. However, double-counting with Greenland is extremely rare. Out of the 190 resolvable domains, 73 (38%) are exclusively Greenlandic, 114 (60%) are solely foreign, and only 2 (~1%) domains are hybrids, split between Greenland and another country. Those two are Nanoq.gl and airgreenland.gl, both of which combine a Greenland presence with foreign infrastructure. This is why the Figure above shows percentages that add up to more than 100%. They represent the dependency footprint. The share of Greenlandic domains that touch each country. They do not represent a pie chart of mutually exclusive categories. What is most important to note, however, is that the overlap with Greenland is vanishingly small. In practice, Greenlandic domains are either entirely local or entirely foreign. Very few straddle the boundary.
The conclusion is sobering. Greenland’s web presence is deeply externalized. With only a quarter of domains hosted locally, and more than half relying on US-controlled infrastructure, the country’s digital backbone is anchored outside its borders. This is not simply a matter of physical location. It is about sovereignty, resilience, and control. The dominance of US, Danish, and UK providers means that Greenland’s citizens, municipalities, and even government services are reliant on infrastructure they do not own and cannot fully control.
Figure shows the distribution of Greenlandic (.gl) domains by the supporting country for the MX (mail exchange) infrastructure. It shows that nearly all email services are routed through foreign providers.
The Figure above of the MX (mail exchange) infrastructure by supporting country reveals an even more pronounced pattern of external reliance than in the case of web hosting. From the 315 Greenlandic domains examined, only 98 domains had active MX records. These are the domains that can be analyzed for mail routing and were used in the analysis below.
Among them, 19% of all Greenlandic domains send their mail through US-controlled infrastructure, primarily Microsoft’s Outlook/Exchange services and Google’s Gmail. The United Kingdom (12%), Ireland (9%), and Denmark (8%) follow, reflecting the presence of Microsoft and Google’s European data centers and Danish resellers. France and Australia appear with smaller shares at 2%, and beyond that, the contributions of other countries are negligible. Greenland itself barely registers. Only two domains, accounting for 1% of the total, utilize MX infrastructure hosted within Greenland. The rest rely on servers beyond its borders. This result is consistent with our sovereignty breakdown: almost all Greenlandic email is foreign-hosted, with just two domains entirely local and one hybrid combining Greenlandic and foreign providers.
Again, the validity of this analysis rests on the same method as the web/IP chart. Each domain is counted once per country where its MX servers are located. Percentages do not add up to 100% because domains may span multiple countries; however, crucially, as with web hosting, double-counting with Greenland is vanishingly rare. In fact, virtually no Greenlandic domains combine local and foreign MX; they are either foreign-only or, in just two cases, local-only.
The story is clear and compelling: Greenland’s email infrastructure is overwhelmingly externalized. Where web hosting still accounts for a quarter of domains within the country, email sovereignty is almost nonexistent. Nearly all communication flows through servers controlled by US, UK, Ireland, or Denmark. The implication is sobering. In the event of disruption, policy disputes, or surveillance demands, Greenland has little autonomous control over its most basic digital communications.
A sector-level view of how Greenland’s web/IP domains are hosted, local vs externally (outside Greenland).
This chart provides a sector-level view of how Greenlandic domains are hosted, distinguishing between those resolved locally in Greenland and those hosted outside of Greenland. It is based on the subset of 190 domains for which sufficient web/IP hosting information was available. Importantly, the categorization relies on individual domains, not on companies as entities. A single company or institution may own and operate multiple domains, which are counted separately for the purpose of this analysis. There is also some uncertainty in sector assignment, as many domains have ambiguous names and were categorized using best-fit rules.
The distribution highlights the uneven exercise of digital sovereignty across sectors. In education and finance, the dependency is absolute: 100 percent of domains are hosted externally, with no Greenland-based presence at all. It should not come as a big surprise that ninety percent of government domains are hosted in Greenland, while only 10 percent are hosted outside. From a Digital Government sovereignty perspective, this would obviously be what should be expected. Transportation shows a split, with about two-thirds of domains hosted locally and one-third abroad, reflecting a mix of Tele Greenland-hosted (Tusass GL) domains alongside foreign-hosted services, such as airgreenland.gl. According to the available data, Energy infrastructure is hosted entirely abroad, underscoring possibly one of the most critical vulnerabilities in the dataset. By contrast, telecom domains, unsurprisingly, given Tele Greenland’s role, are entirely local, making it the only sector with 100 percent internal hosting. Municipalities present a more positive picture, with three-quarters of domains hosted locally and one-quarter abroad, although this still represents a partial external dependency. Finally, the large and diverse “Other” category, which contains a mix of companies, organizations, and services, is skewed towards foreign hosting (67 percent external, 33 percent local).
Taken together, the results underscore three important points. First, sector-level sovereignty is highly uneven. While telecom, municipal, and Governmental web services retain more local control, most finance, education, and energy domains are overwhelmingly external. We should keep in mind that when a Greenlandic domain resolves to local infrastructure, it indicates that the frontend web hosting, the visible entry point that users connect to, is located within Greenland, typically through Tele Greenland (i.e., Tusass GL). However, this does not automatically mean that the entire service stack is local. Critical back-end components such as databases, authentication services, payment platforms, or integrated cloud applications may still reside abroad. In practice, a locally hosted domain therefore guarantees only that the web interface is served from Greenland, while deeper layers of the service may remain dependent on foreign infrastructure. This distinction is crucial when evaluating genuine digital sovereignty and resilience. However, the overall pattern is unmistakable. Greenland’s digital presence remains heavily reliant on foreign hosting, with only pockets of local sovereignty.
A sector-level view of the share of locally versus externally (i.e., outside Greenland) MX (mail exchange) hosted Greenlandic domains (.gl).
The Figure above provides a sector-level view of how Greenlandic domains handle their MX (mail exchange) infrastructure, distinguishing between those hosted locally and those that rely on foreign providers. The analysis is based on the subset of 94 domains (out of 315 total) where MX hosting could be clearly resolved. In other words, these are the domains for which sufficient DNS information was available to identify the location of their mail servers. As with the web/IP analysis, it is important to note two caveats: sector classification involves a degree of interpretation, and the results represent individual domains, not individual companies. A single organization may operate multiple domains, some of which are local and others external.
The results are striking. For most sectors, such as education, finance, transport, energy, telecom, and municipalities, the dependence on foreign MX hosting is total. 100 percent of identified domains rely on external providers for email infrastructure. Even critical sectors such as energy and telecom, where one might expect a more substantial local presence, are fully externalized. The government sector presents a mixed picture. Half of the government domains examined utilize local MX hosting, while the other half are tied to foreign providers. This partial local footprint is significant, as it shows that while some government email flows are retained within Greenland, an equally large share is routed through servers abroad. The “other” sector, which includes businesses, NGOs, and various organizations, shows a small local footprint of about 3 percent, with 97 percent hosted externally. Taken together, the Figure paints a more severe picture of dependency than the web/IP hosting analysis.
While web hosting still retained about a quarter of domains locally, in the case of email, nearly everything is external. Even in government, where one might expect strong sovereignty, half of the domains are dependent on foreign MX servers. This distinction is critical. Email is the backbone of communication for both public and private institutions, and the routing of Greenland’s email infrastructure almost entirely abroad highlights a deep vulnerability. Local MX records guarantee only that the entry point for mail handling is in Greenland. They do not necessarily mean that mail storage or filtering remains local, as many services rely on external processing even when the MX server is domestic.
The broader conclusion is clear. Greenland’s sovereignty in digital communications is weakest in email. Across nearly all sectors, external providers control the infrastructure through which communication must pass, leaving Greenland reliant on systems located far outside its borders. Irrespective of how the picture painted here may appear severe in terms of digital sovereignty, it is not altogether surprising. The almost complete externalization of Greenlandic email infrastructure is not surprising, given that most global email services are provided by U.S.-based hyperscalers such as Microsoft and Google. This reliance on Big Tech is the norm worldwide, but it carries particular implications for Greenland, where dependence on foreign-controlled communication channels further limits digital sovereignty and resilience.
The analysis of the 94 MX hosting entries shows a striking concentration of Greenlandic email infrastructure in the hands of a few large players. Microsoft dominates the picture with 38 entries, accounting for just over 40 percent of all records, while Amazon follows with 20 entries, or around 21 percent. Google, including both Gmail and Google Cloud Platform services, contributes an additional 8 entries, representing approximately 9% of the total. Together, these three U.S. hyperscalers control nearly 70 percent of all Greenlandic MX infrastructure. By contrast, Tele Greenland (Tusass GL) appears in only three cases, equivalent to just 3 percent of the total, highlighting the minimal local footprint. The remaining quarter of the dataset is distributed across a long tail of smaller European and global providers such as Team Blue in Denmark, Hetzner in Germany, OVH and O2Switch in France, Contabo, Telenor, and others. The distribution, however you want to cut it, underscores the near-total reliance on U.S. Big Tech for Greenland’s email services, with only a token share remaining under national control.
Out of 179 total country mentions across the dataset, the United States is by far the most dominant hosting location, appearing in 61 cases, or approximately 34 percent of all country references. The United Kingdom follows with 38 entries (21 percent), Ireland with 28 entries (16 percent), and Denmark with 25 entries (14 percent). France (4 percent) and Australia (3 percent) form a smaller second tier, while Greenland itself appears only three times (2 percent). Germany also accounts for three entries, and all other countries (Austria, Norway, Spain, Czech Republic, Slovakia, Poland, Canada, and Singapore) occur only once each, making them statistically marginal. Examining the structure of services across locations, approximately 30 percent of providers are tied to a single country, while 51 percent span two countries (for example, UK–US or DK–IE). A further 18 percent are spread across three countries, and a single case involved four countries simultaneously. This pattern reflects the use of distributed or redundant MX services across multiple geographies, a characteristic often found in large cloud providers like Microsoft and Amazon.
The key point is that, regardless of whether domains are linked to one, two, or three countries, the United States is present in the overwhelming majority of cases, either alone or in combination with other countries. This confirms that U.S.-based infrastructure underpins the backbone of Greenlandic email hosting, with European locations such as the UK, Ireland, and Denmark acting primarily as secondary anchors rather than true alternatives.
WHAT DOES IT ALL MEAN?
Greenland’s public digital life overwhelmingly runs on infrastructure it does not control. Of 315 .gl domains, only 190 even have active web/IP hosting, and just 98 have resolvable MX (email) records. Within that smaller, “real” subset, most web front-ends are hosted abroad and virtually all email rides on foreign platforms. The dependency is concentrated, with U.S. hyperscalers—Microsoft, Amazon, and Google—accounting for nearly 70% of MX services. The U.S. is also represented in more than a third of all MX hosting locations (often alongside the UK, Ireland, or Denmark). Local email hosting is almost non-existent (two entirely local domains; a few Tele Greenland/Tusass appearances), and even for websites, a Greenlandic front end does not guarantee local back-end data or apps.
That architecture has direct implications for sovereignty and security. If submarine cables, satellites, or upstream policies fail or are restricted, most government, municipal, health, financial, educational, and transportation services would degrade or cease, because their applications, identity systems, storage, payments, and mail are anchored off-island. Daily resilience can mask strategic fragility: the moment international connectivity is severely compromised, Greenland lacks the local “island mode” to sustain critical digital workflows.
This is not surprising. U.S. Big Tech dominates email and cloud apps worldwide. Still, it may pose a uniquely high risk for Greenland, given its small population, sparse infrastructure, and renewed U.S. strategic interest in the region. Dependence on platforms governed by foreign law and policy erodes national leverage in crisis, incident response, and lawful access. It exposes citizens to outages or unilateral changes that are far beyond Nuuk’s control.
The path forward is clear: treat digital sovereignty as critical infrastructure. Prioritize local capabilities where impact is highest (government/municipal core apps, identity, payments, health), build island-mode fallbacks for essential services, expand diversified transport (additional cables, resilient satellite), and mandate basic email security (SPF/DKIM/DMARC) alongside measurable locality targets for hosting and data. Only then can Greenland credibly assure that, even if cut off from the world, it can still serve its people.
CONNECTIVITY AND RESILIENCE: GREENLAND VERSUS OTHER SOVEREIGN ISLANDS.
Sources: Submarine cable counts from TeleGeography/SubmarineNetworks.com; IXPs and ASNs from Internet Society Pulse/Peering DB and RIR data; GDP and Population from IMF/Worldband (2023/2024); Internet penetration from ITU and National Statistics.
The comparative table shown above highlights Greenland’s position among other sovereign and autonomous islands in terms of digital infrastructure. With two international submarine cables, Greenland shares the same level of cable redundancy as the Faroe Islands, Malta, the Maldives, Seychelles, Cuba, and Fiji. This places it in the middle tier of island connectivity: above small states like Comoros, which rely on a single cable, but far behind island nations such as Cyprus, Ireland, or Singapore, which have built themselves into regional hubs with multiple independent international connections.
Where Greenland diverges is in the absence of an Internet Exchange Point (IXP) and its very limited number of Autonomous Systems (ASNs). Unlike Iceland, which couples four cables with three IXPs and over ninety ASNs, Greenland remains a network periphery. Even smaller states such as Malta, Seychelles, or Mauritius operate IXPs and host more ASNs, giving them greater routing autonomy and resilience.
In terms of internet penetration, Greenland fares relatively well, with a rate of over 90 percent, comparable to other advanced island economies. Yet the country’s GDP base is extremely limited, comparable to the Faroe Islands and Seychelles, which constrains its ability to finance major independent infrastructure projects. This means that resilience is not simply a matter of demand or penetration, but rather a question of policy choices, prioritization, and regional partnerships.
Seen from a helicopter’s perspective, Greenland is neither in the worst nor the best position. It has more resilience than single-cable states such as Comoros or small Pacific nations. Still, it lags far behind peer islands that have deliberately developed multi-cable redundancy, local IXPs, and digital sovereignty strategies. For policymakers, this raises a fundamental challenge: whether to continue relying on the relative stability of existing links, or to actively pursue diversification measures such as a national IXP, additional cable investments, or regional peering agreements. In short, Greenland’s digital sovereignty depends less on raw penetration figures and more on whether its infrastructure choices can elevate it from a peripheral to a more autonomous position in the global network.
HOW TO ELEVATE SOUTH GREENLAND TO A PREFERRED TO A PREFFERED DIGITAL HOST FOR THE WORLD … JUST SAYING, WHY NOT!
At first glance, South Greenland and Iceland share many of the same natural conditions that make Iceland an attractive hub for data centers. Both enjoy a cool North Atlantic climate that allows year-round free cooling, reducing the need for energy-intensive artificial systems. In terms of pure geography and temperature, towns such as Qaqortoq and Narsaq in South Greenland are not markedly different from Reykjavík or Akureyri. From a climatic standpoint, there is no inherent reason why Greenland should not also be a viable location for large-scale hosting facilities.
The divergence begins not with climate but with energy and connectivity. Iceland spent decades developing a robust mix of hydropower and geothermal plants, creating a surplus of cheap renewable electricity that could be marketed to international hyperscale operators. Greenland, while rich in hydropower potential, has only a handful of plants tied to local demand centers, with no national grid and limited surplus capacity. Without investment in larger-scale, interconnected generation, it cannot guarantee the continuous, high-volume power supply that international data centers demand. Connectivity is the other decisive factor. Iceland today is connected to four separate submarine cable systems, linking it to Europe and North America, which gives operators confidence in redundancy and low-latency routes across the Atlantic. South Greenland, by contrast, depends on two branches of the Greenland Connect system, which, while providing diversity to Iceland and Canada, does not offer the same level of route choice or resilience. The result is that Iceland functions as a transatlantic bridge, while Greenland remains an endpoint.
For South Greenland to move closer to Iceland’s position, several changes would be necessary. The most important would be a deliberate policy push to develop surplus renewable energy capacity and make it available for export into data center operations. Parallel to this, Greenland would need to pursue further international submarine cables to break its dependence on a single system and create genuine redundancy. Finally, it would need to build up the local digital ecosystem by fostering an Internet Exchange Point and encouraging more networks to establish Autonomous Systems on the island, ensuring that Greenland is not just a transit point but a place where traffic is exchanged and hosted, and, importantly, making money on its own Digital Infrastructure and Sovereignty. South Greenland already shares the climate advantage that underpins Iceland’s success, but climate alone is insufficient. Energy scale, cable diversity, and deliberate policy have been the ingredients that have allowed Iceland to transform itself into a digital hub. Without similar moves, Greenland risks remaining a peripheral node rather than evolving into a sovereign center of digital resilience.
A PRACTICAL BLUEPRINT FOR GREENLAND TOWARDS OWNING ITS DIGITAL SOVEREIGNTY.
No single measure eliminates Greenland’s dependency on external infrastructure, banking, global SaaS, and international transit, which are irreducible. But taken together, these steps described below maximize continuity of essential functions during cable cuts or satellite disruption, improve digital sovereignty, and strengthen bargaining power with global vendors. The trade-off is cost, complexity, and skill requirements, which means Greenland must prioritize where full sovereignty is truly mission-critical (health, emergency, governance) and accept graceful degradation elsewhere (social media, entertainment, SaaS ERP).
A. Keep local traffic local (routing & exchange).
Proposal: Create or strengthen a national IXP in Nuuk, with a secondary node (e.g., Sisimiut or Qaqortoq). Require ISPs, mobile operators, government, and major content/CDNs to peer locally. Add route-server policies with “island-mode” communities to ensure that intra-Greenland routes stay reachable even if upstream transit is lost. Deploy anycasted recursive DNS and host authoritative DNS for .gl domains on-island, with secondaries abroad.
Pros:
Dramatically reduces the latency, cost, and fragility of local traffic.
Ensures Greenland continues to “see itself” even if cut off internationally.
DNS split-horizon prevents sensitive internal queries from leaking off-island.
Cons:
Needs policy push. Voluntary peering is often insufficient in small markets.
Running redundant IXPs is a fixed cost for a small economy.
CDNs may resist deploying nodes without incentives (e.g., free rack and power).
A natural and technically well-founded reaction, especially given Greenland’s monopolistic structure under Tusass, is that an IXP or multiple ASNs might seem redundant. Both content and users reside on the same Tusass network, and intra-Greenland traffic already remains local at Layer 3. Adding an IXP would not change that in practice. Without underlying physical or organizational diversity, an exchange point cannot create redundancy on its own.
However, over the longer term, an IXP can still serve several strategic purposes. It provides a neutral routing and governance layer that enables future decentralization (e.g., government, education, or sectoral ASNs), strengthens “island-mode” resilience by isolating internal routes during disconnection from the global Internet, and supports more flexible traffic management and security policies. Notably, an IXP also offers a trust and independence layer that many third-party providers, such as hyperscalers, CDNs, and data-center networks, typically require before deploying local nodes. Few global operators are willing to peer inside the demarcation of a single national carrier’s network. A neutral IXP provides them with a technical and commercial interface independent of Tusass’s internal routing domain, thereby making on-island caching or edge deployments more feasible in the future. In that sense, this accurately reflects today’s technical reality. The IXP concept anticipates tomorrow’s structural and sovereignty needs, bridging the gap between a functioning monopoly network and a future, more open digital ecosystem.
In practice (and in my opinion), Tusass is the only entity in Greenland with the infrastructure, staff, and technical capacity to operate an IXP. While this challenges the ideal of neutrality, it need not invalidate the concept if the exchange is run on behalf of Naalakkersuisut (the Greenlandic self-governing body) or under a transparent, multi-stakeholder governance model. The key issue is not who operates the IXP, but how it is governed. Suppose Tusass provides the platform while access, routing, and peering policies are openly managed and non-discriminatory. In that case, the IXP can still deliver genuine benefits: local routing continuity, “island-mode” resilience, and a neutral interface that encourages future participation by hyperscalers, CDNs, and sectoral networks.
B. Host public-sector workloads on-island.
Proposal: Stand up a sovereign GovCloud GL in Nuuk (failover in another town, possible West-East redundancy), operated by a Greenlandic entity or tightly contracted partner. Prioritize email, collaboration, case handling, health IT, and emergency comms. Keep critical apps, archives, and MX/journaling on-island even if big SaaS (like M365) is still used abroad.
Pros:
Keeps essential government operations functional in an isolation event.
Reduces legal exposure to extraterritorial laws, such as the U.S. CLOUD Act.
Provides a training ground for local IT and cloud talent.
Cons:
High CapEx + ongoing OpEx; cloud isn’t a one-off investment.
Scarcity of local skills; risk of over-reliance on a few engineers.
Difficult to replicate the breadth of SaaS (ERP, HR, etc.) locally; selective hosting is realistic, full stack is not.
C. Make email & messaging “cable- and satellite-outage proof”.
Proposal: Host primary MX and mailboxes in GovCloud GL with local antispam, journaling, and security. Use off-island secondaries only for queuing. Deploy internal chat/voice/video systems (such as Matrix, XMPP, or local Teams/Zoom gateways) to ensure that intra-Greenland traffic never routes outside the country. Define an “emergency federation mode” to isolate traffic during outages.
Pros:
Ensures communication between government, hospitals, and municipalities continues during outages.
Local queues prevent message loss even if foreign relays are unreachable.
Operating robust mail and collaboration platforms locally is a resource-intensive endeavor.
Risk of user pushback if local platforms feel less polished than global SaaS.
The emergency “mode switch” adds operational complexity and must be tested regularly.
D. Put the content edge in Greenland.
Proposal: Require or incentivize CDN caches (Akamai, Cloudflare, Netflix, OS mirrors, software update repos, map tiles) to be hosted inside Greenland’s IXP(s).
Pros:
Improves day-to-day performance and cuts transit bills.
Reduces dependency on subsea cables for routine updates and content.
Keeps basic digital life (video, software, education platforms) usable in isolation.
Cons:
CDNs deploy based on scale; Greenland’s market may be marginal without a subsidy.
Hosting costs (power, cooling, rackspace) must be borne locally.
Only covers cached/static content; dynamic services (banking, SaaS) still break without external connectivity.
E. Implement into law & contracts.
Proposal: Mandate data residency for public-sector data; require “island-mode” design in procurement. Systems must demonstrate the ability to authenticate locally, operate offline, maintain usable data, and retain keys under Greenlandic custody. Impose peering obligations for ISPs and major SaaS/CDNs.
Pros:
Creates a predictable baseline for sovereignty across all agencies.
Prevents future procurement lock-in to non-resilient foreign SaaS.
Gives legal backing to technical requirements (IXP, residency, key custody).
Cons:
May raise the costs of IT projects (compliance overhead).
Without a strong enforcement, rules risk becoming “checkbox” exercises.
Possible trade friction if foreign vendors see it as protectionist.
F. Strengthen physical resilience
Proposal: Maintain and upgrade subsea cable capacity (Greenland Connect and Connect North), add diversity (spur/loop and new landings), and maintain long-haul microwave/satellite as a tertiary backup. Pre-engineer quality of service downgrades for graceful degradation.
Pros:
Adds true redundancy. Nothing replaces a working subsea cable.
Tertiary paths (satellite, microwave) keep critical services alive during failures.
Clear QoS downgrades make service loss more predictable and manageable.
Cons:
High (possibly very high) CapEx. New cable segments cost tens to hundreds of millions of euros.
Satellite/microwave backup cannot match the throughput of subsea cables.
International partners may be needed for funding and landing rights.
Security & trust
Proposal: Deploy local PKI and HSMs for the government. Enforce end-to-end encryption. Require local custody of cryptographic keys. Audit vendor remote access and include kill switches.
Pros:
Prevents data exposure via foreign subpoenas (without Greenland’s knowledge).
Local trust anchors give confidence in sovereignty claims.
Kill switches and audit trails enhance vendor accountability.
Cons:
PKI and HSM management requires very specialized skills.
Without strong governance, there is a risk of “security theatre” rather than absolute security.
On-island first as default. A key step for Greenland is to make on-island first the norm so that local-to-local traffic stays local even if Atlantic cables fail. Concretely, stand up a national IXP in Nuuk to keep domestic traffic on the island and anchor CDN caches; build a Greenlandic “GovCloud” to host government email, identity, records, and core apps; and require all public-sector systems to operate in “island mode” (continue basic services offline from the rest of the world). Pair this with local MX, authoritative DNS, secure chat/collaboration, and CDN caches, so essential content and services remain available during outages. Back it with clear procurement rules on data residency and key custody to reduce both outage risk and exposure to foreign laws (e.g., CLOUD Act), acknowledging today’s heavy—if unsurprising—reliance on U.S. hyperscalers (Microsoft, Amazon, Google).
What this changes, and what it doesn’t. These measures don’t aim to sever external ties. They should rebalance them. The goal is graceful degradation that keeps government services, domestic payments, email, DNS, and health communications running on-island, while accepting that global SaaS and card rails will go dark during isolation. Finally, it’s also worth remembering that local caching is only a bridge, not a substitute for global connectivity. In the first days of an outage, caches would keep websites, software updates, and even video libraries available, allowing local email and collaboration tools to continue running smoothly. But as the weeks pass, those caches would inevitably grow stale. News sites, app stores, and streaming platforms would stop refreshing, while critical security updates, certificates, and antivirus definitions would no longer be available, leaving systems exposed to risk. If isolation lasted for months, the impact would be much more profound. Banking and card clearing would be suspended, SaaS-driven ERP systems would break down, and Greenland would slide into a “local only” economy, relying on cash and manual processes. Over time, the social impact would also be felt, with the population cut off from global news, communication, and social platforms. Caching, therefore, buys time, but not independence. It can make an outage manageable in the short term, yet in the long run, Greenland’s economy, security, and society depend on reconnecting to the outside world.
The Bottom line. Full sovereignty is unrealistic for a sparse, widely distributed country, and I don’t think it makes sense to strive for that. It just appears impractical. In my opinion, partial sovereignty is both achievable and valuable. Make on-island first the default, keep essential public services and domestic comms running during cuts, and interoperate seamlessly when subsea links and satellites are up. This shifts Greenland from its current state of strategic fragility to one of managed resilience, without overlooking the rest of the internet.
ACKNOWLEDGEMENT.
I want to acknowledge my wife, Eva Varadi, for her unwavering support, patience, and understanding throughout the creative process of writing this article. I would also like to thank Dr. Signe Ravn-Højgaard, from “Tænketanken Digital Infrastruktur”, and the Sermitsiaq article “Digital afhængighed af udlandet” (“Digital dependency on foreign countries”) by Paul Krarup, for inspiring this work, which is also a continuation of my previous research and article titled “Greenland: Navigating Security and Critical Infrastructure in the Arctic – A Technology Introduction”. I would like to thank Lasse Jarlskov for his insightful comments and constructive feedback on this article. His observations regarding routing, OSI layering, and the practical realities of Greenland’s network architecture were both valid and valuable, helping refine several technical arguments and improve the overall clarity of the analysis.
ASN — Autonomous System Number: A unique identifier assigned to a network operator that controls its own routing on the Internet, enabling the exchange of traffic with other networks using the Border Gateway Protocol (BGP).
BGP — Border Gateway Protocol: The primary routing protocol of the Internet, used by Autonomous Systems to exchange information about which paths data should take across networks.
CDN — Content Delivery Network: A system of distributed servers that cache and deliver content (such as videos, software updates, or websites) closer to users, reducing latency and dependency on international links.
CLOUD Act — Clarifying Lawful Overseas Use of Data Act: A U.S. law that allows American authorities to demand access to data stored abroad by U.S.-based cloud providers, raising sovereignty and privacy concerns for other countries.
DMARC — Domain-based Message Authentication, Reporting and Conformance: An email security protocol that tells receiving servers how to handle messages that fail authentication checks, protecting against spoofing and phishing.
DKIM — DomainKeys Identified Mail: An email authentication method that uses cryptographic signatures to verify that a message has not been altered and truly comes from the claimed sender.
DNS — Domain Name System: The hierarchical system that translates human-readable domain names (like example.gl) into IP addresses that computers use to locate servers.
ERP — Enterprise Resource Planning A type of integrated software system that organizations use to manage business processes such as finance, supply chain, HR, and operations.
GL — Greenland (country code top-level domain, .gl) The internet country code for Greenland, used for local domain names such as nanoq.gl.
GovCloud — Government Cloud: A sovereign or dedicated cloud infrastructure designed for hosting public-sector applications and data within national jurisdiction.
HSM — Hardware Security Module: A secure physical device that manages cryptographic keys and operations, used to protect sensitive data and digital transactions.
IoT — Internet of Things: A network of physical devices (sensors, appliances, vehicles, etc.) connected to the internet, capable of collecting and exchanging data.
IP — Internet Protocol: The fundamental addressing system of the Internet, enabling data packets to be sent from one computer to another.
ISP — Internet Service Provider: A company or entity that provides customers with access to the internet and related services.
IXP — Internet Exchange Point: A physical infrastructure where networks interconnect directly to exchange internet traffic locally rather than through international transit links.
MX — Mail Exchange (Record): A type of DNS record that specifies the mail servers responsible for receiving email on behalf of a domain.
PKI — Public Key Infrastructure: A framework for managing encryption keys and digital certificates, ensuring secure electronic communications and authentication.
SaaS — Software as a Service: Cloud-based applications delivered over the internet, such as Microsoft 365 or Google Workspace, are usually hosted on servers outside the country.
SPF — Sender Policy Framework: An email authentication protocol that defines which mail servers are authorized to send email on behalf of a domain, reducing the risk of forgery.
Tusass is the national telecommunications provider of Greenland, formerly Tele Greenland, responsible for submarine cables, satellite links, and domestic connectivity.
UAV — Unmanned Aerial Vehicle: An aircraft without a human pilot on board, often used for surveillance, monitoring, or communications relay.
UUV — Unmanned Underwater Vehicle: A robotic submarine used for monitoring, surveying, or securing undersea infrastructure such as cables.
Is LEO satellite broadband a cost-effective and capable option for rural areas of Europe? Given that most seem to agree that LEO satellites will not replace mobile broadband networks, it seems only natural to ask whether LEO satellites might help the EU Commission’s Digital Decade Policy Programme (DDPP) 2030 goal of having all EU households (HH) covered by gigabit connections delivered by so-called very high-capacity networks, including gigabit capable fiber-optic and 5G networks, by 2030 (i.e., only focusing on the digital infrastructure pillar of the DDPP).
As of 2023, more than €80 billion had been allocated in national broadband strategies and through EU funding instruments, including the Connecting Europe Facility and the Recovery and Resilience Facility. However, based on current deployment trajectories and cost structures, an additional €120 billion or more is expected to close the remaining connectivity gap from the approximately 15.5 million rural homes without a gigabit option in 2023. This brings the total investment requirement to over €200 billion. The shortfall is most acute in rural and hard-to-reach regions where network deployment is significantly more expensive. In these areas, connecting a single household with high-speed broadband infrastructure, especially via FTTP, can easily exceed €10,000 in public subsidy, given the long distances and low density of premises. It would be a very “cheap” alternative for Europe if a non-EU-based (i.e., USA) satellite constellation could close the gigabit coverage gap even by a small margin. However, given some of the current geopolitical factors, 200 billion euros could enable Europe to establish its own large LEO satellite constellation if it can match (or outperform) the unitary economics of SpaceX, rather than its IRIS² satellite program.
In this article, my analysis focuses on direct-to-dish low Earth orbit (LEO) satellites with expected capabilities comparable to, or exceeding, those projected for SpaceX’s Starlink V3, which is anticipated to deliver up to 1 Terabit per second of total downlink capacity. For such satellites to represent a credible alternative to terrestrial gigabit connectivity, several thousand would need to be in operation. This would allow overlapping coverage areas, increasing effective throughput to household outdoor dishes across sparsely populated regions. Reaching such a scale may take years, even under optimistic deployment scenarios, highlighting the importance of aligning policy timelines with technological maturity.
GIGABITS IN THE EU – WHERE ARE WE, AND WHERE DO WE THINK WE WILL GO?
In 2023, Fibre-to-the-Premises (FTTP) rural HH coverage was ca. 52%. For the EU28, this means that approximately 16 million rural homes lack fiber coverage.
By 2030, projected FTTP deployment in the EU28 will result in household coverage reaching almost 85% of all rural homes (under so-called BaU conditions), leaving approximately 5.5 million households without it.
Due to inferior economics, it is estimated that approximately 10% to 15% of European households are “unconnectable” by FTTP (although not necessarily by FWA or broadband mobile in general).
EC estimated (in 2023) that over 80 billion euros in subsidies have been allocated in national budgets, with an additional 120 billion euros required to close the gigabit ambition gap by 2030 (e.g., over 10,000 euros per remaining rural household in 2023).
So, there is a considerable number of so-called “unconnectable” households within the European Union (i.e., EU28). These are, for example, isolated dwellings away from inhabited areas (e.g., settlements, villages, towns, and cities). They often lack the most basic fixed communications infrastructure, although some may have old copper lines or only relatively poor mobile coverage.
The figure below illustrates the actual state of FTTP deployment in rural households in 2023 (orange bars) as well as a Rural deployment scenario that extends FTTP deployment to 2030, using the maximum of the previous year’s deployment level and the average of the last three years’ deployment levels. Any level above 80% grows by 1% pa (arbitrarily chosen). The data source for the above is “Digital Decade 2024: Broadband Coverage in Europe 2023” by the European Commission. The FTTP pace has been chosen individually for suburban and rural areas to match the expectations expressed in the reports for 2030.
ARE LEO DIRECT-TO-DISH (D2D) SATELLITES A CREDIBLE ALTERNATIVE FOR THE “UNCONNECTABLES”?
For Europe, a non-EU-based (i.e., US-based) satellite constellation could be a very cost-effective alternative to closing the gigabit coverage gap.
Megabit connectivity (e.g., up to 100+ Mbps) is already available today with SpaceX Starlink LEO satellites in rural areas with poor broadband alternatives.
The SpaceX Starlink V2 satellite can provide approximately 100 Gbps (V1.5 ~ 20+ Gbps), and its V3 is expected to deliver 1,000 Gbps within the satellite’s coverage area, with a maximum coverage radius of over 500 km.
The V3 may have 320 beams (or more), each providing approximately ~3 Gbps (i.e., 320 x 3 Gbps is ca. 1 Tbps). With a frequency re-use factor of 40, 25 Gbps can be supplied within a unique coverage area. With “adjacent” satellites (off-nadir), the capacity within a unique coverage area can be enhanced by additional beams that overlap the primary satellite (nadir).
With an estimated EU28 “unconnectable” household density of approximately 1.5 per square kilometer, the LEO satellite constellation would cover more than 20,000 households, each with a capacity of 20 Gbps over an area of 15,000 square kilometers.
At a peak-hour user concurrency of 15% and a per-user demand of 1 Gbps, the backhaul demand would reach 3 terabits per second (Tbps). This means we have an oversubscription ratio of approximately 3:1, which must be met by a single 1 Tbps satellite, or could be served by three overlapping satellites.
This assumes a 100% take-up rate of the unconnectable HHs and that each would select a 1 Gbps service (assuming such would be available). In rural areas, the take-up rate may not be significantly higher than 60%, and not all households will require a 1 Gbps service.
This also assumes that there are no alternatives to LEO satellite direct-to-dish service, which seems unlikely for at least some of the 20,000 “unconnectable” households. Given the typical 5G coverage conditions associated with the frequency spectrum license conditions, one might hope for some decent 5G coverage; alas, it is unlikely to be gigabit in deep rural and isolated areas.
For example, consider the Starlink LEO satellite V1.5, which has a total capacity of approximately 25 Gbps, comprising 32 beams that deliver 800 Mbps per beam, including dual polarization, to a ground-based user dish. It can provide a maximum of 6.4 Gbps over a minimum area of ca. 6,000 km² at nadir with an Earth-based dish directly beneath the satellite. If the coverage area is situated in a UK-based rural area, for example, we would expect to find, on average, 150,000 rural households using an average of 25 rural homes per km². If a household demands 100 Mbps at peak, only 60 households can be online at full load concurrently per area. With 10% concurrency, this implies that we can have a total of 600 households per area out of 150,000 homes. Thus, 1 in 250 households could be allowed to subscribe to a Starlink V1.5 if the target is 100 Mbps per home and a concurrency factor of 10% within the coverage area. This is equivalent to stating that the oversubscription ratio is 250:1, and reflects the tension between available satellite capacity and theoretical rural demand density. In rural UK areas, the beam density is too high relative to capacity to allow universal subscription at 100 Mbps unless more satellites provide overlapping service. For a V1.5 satellite, we can support four regions (i.e., frequency reuse groups), each with a maximum throughput of 6.4 Gbps. Thus, the satellite can support a total of 2,400 households (i.e., 4 x 600) with a peak demand of 100 Mbps and a concurrency rate of 10%. As other satellites (off-nadir) can support the primary satellite, it means that some areas’ demand may be supported by two to three different satellites, providing a multiplier effect that can increase the capacity offered. The Starlink V2 satellite is reportedly capable of supporting up to a total of 100 Gbps (approximately four times that of V1.5), while the V3 will support up to 1 Tbps, which is 40 times that of V1.5. The number of beams and, consequently, the number of independent frequency groups, as well as spectral efficiency, are expected to be improved over V1.5, which are factors that will enhance the overall total capacity of the newer Starlink satellite generations.
By 2030, the EU28 rural areas are expected to achieve nearly 85% FTTP coverage under business-as-usual deployment scenarios. This would leave approximately 5.5 million households, referred to as “unconnectables,” without direct access to high-speed fiber. These households are typically isolated, located in sparsely populated or geographically challenging regions, where the economics of fiber deployment become prohibitively uneconomical. Although there may be alternative broadband options, such as FWA, 5G mobile coverage, or copper, it is unlikely that such “unconnectable” homes would sustainably have a gigabit connection.
This may be where LEO satellite constellations enter the picture as a possible alternative to deploying fiber optic cables in uneconomical areas, such as those that are unconnectable. The anticipated capabilities of Starlink’s third-generation (V3) satellites, offering approximately 1 Tbps of total downlink capacity with advanced beamforming and frequency reuse, already make them a viable candidate for servicing low-density rural areas, assuming reasonable traffic models similar to those of an Internet Service Provider (ISP). With modest overlapping coverage from two or three such satellites, these systems could deliver gigabit-class service to tens of thousands of dispersed households without (much) oversubscription, even assuming relatively high concurrency and usage.
Considering this, there seems little doubt that an LEO constellation, just slightly more capable than SpaceX’s Starlink V3 satellite, appears to be able to fully support the broadband needs of the remaining unconnected European households expected by 2030. This also aligns well with the technical and economic strengths of LEO satellites: they are ideally suited for delivering high-capacity service to regions where population density is too low to justify terrestrial infrastructure, yet digital inclusion remains equally essential.
LOW-EARTH ORBIT SATELLITES DIRECT-TO-DISRUPTION.
I have in my blog “Will LEO Satellite Direct-to-Cell Networks make Terrestrial Networks Obsolete?” I provided some straightforward reasons why the LEO satellite with direct to an unmodified smartphone capabilities (e.g., Lynk Global, AST Spacemobile) would not make existing cellular network obsolete and would be of most value in remote or very rural areas where no cellular coverage would be present (as explained very nicely by Lynk Global) offering a connection alternative to satellite phones such as Iridium, and thus being complementary existing terrestrial cellular networks. Thus, despite the hype, we should not expect a direct disruption to regular terrestrial cellular networks from LEO satellite D2C providers.
Of course, the question could also be asked whether LEO satellites directed to an outdoor (terrestrial) dish could threaten existing fiber optic networks, the business case, and the value proposition. After all, the SpaceX Starlink V3 satellite, not yet operational, is expected to support 1 Terabit per second (Tbps) over a coverage area of several thousand kilometers in diameter. It is no doubt an amazing technological achievement for SpaceX to have achieved a 10x leap in throughput from its present generation V2 (~100 Gbps).
However, while a V3-like satellite may offer an (impressive) total capacity of 1 Tbps, this capacity is not uniformly available across its entire footprint. It is distributed across multiple beams, potentially 256 or more, each with a bandwidth of approximately 4 Gbps (i.e., 1 Tbps / 256 beams). With a frequency reuse factor of, for example, 5, the effective usable capacity per unique coverage area becomes a fraction of the satellite’s total throughput. This means that within any given beam footprint, the satellite can only support a limited number of concurrent users at high bandwidth levels.
As a result, such a satellite cannot support more than roughly a thousand households with concurrent 1 Gbps demand in any single area (or, alternatively, about 10,000 households with 100 Mbps concurrent demand). This level of support would be equivalent to a small FTTP (sub)network serving no more than 20,000 households at a 50% uptake rate (i.e., 10,000 connected homes) and assuming a concurrency of 10%. A deployment of this scale would typically be confined to a localized, dense urban or peri-urban area, rather than the vast rural regions that LEO systems are expected to serve.
In contrast, a single Starlink V3-like satellite would cover a vast region, capable of supporting similar or greater numbers of users, including those in remote, low-density areas that FTTP cannot economically reach. The satellite solution described here is thus not designed to densify urban broadband, but rather to reach rural, remote, and low-density areas where laying fiber is logistically or economically impractical. Therefore, such satellites and conventional large-scale fiber networks are not in direct competition, as they cannot match their density, scale, or cost-efficiency in high-demand areas. Instead, it complements fiber infrastructure by providing connectivity and reinforces the case for hybrid infrastructure strategies, in which fiber serves the dense core, and LEO satellites extend the digital frontier.
However, terrestrial providers must closely monitor their FTTP deployment economics and refrain from extending too far into deep rural areas beyond a certain household density, which is likely to increase over time as satellite capabilities improve. The premise of this blog is that capable LEO satellites by 2030 could serve unconnected households that are unlikely to have any commercial viability for terrestrial fiber and have no other gigabit coverage option. Within the EU28, this represents approximately 5.5 million remote households. A Starlink V3-like 1 Tbps satellite could provide a gigabit service (occasionally) to those households and certainly hundreds of megabits per second per isolated household. Moreover, it is likely that over time, more capable satellites will be launched, with SpaceX being the most likely candidate for such an endeavor if it maintains its current pace of innovation. Such satellites will likely become increasingly interesting for household densities above 2 households per square kilometer. However, suppose an FTTP network has already been deployed. In that case, it seems unlikely that the satellite broadband service would render the terrestrial infrastructure obsolete, as long as it is priced competitively in comparison to the satellite broadband network.
LEO satellite direct-to-dish (D2D) based broadband networks may be a credible and economical alternative to deploying fiber in low-density rural households. The density boundary of viable substitution for a fiber connection with a gigabit satellite D2D connection may shift inward (from deep rural, low-density household areas). This reinforces the case for hybrid infrastructure strategies, in which fiber serves the denser regions and LEO satellites extend the digital frontier to remote and rural areas.
THE USUAL SUSPECT – THE PUN INTENDED.
By 2030,SpaceX’s Starlink will operate one of the world’s most extensive low Earth orbit (LEO) satellite constellations. As of early 2025, the company has launched more than 6,000 satellites into orbit; however, most of these, including V1, V1.5, and V2, are expected to cease operation by 2030. Industry estimates suggest that Starlink could have between 15,000 and 20,000 operational satellites by the end of the decade, which I anticipate to be mainly V3 and possibly a share of V4. This projection depends largely on successfully scaling SpaceX’s Starship launch vehicle, which is designed to deploy up to 60 or more next-generation V3 satellites per mission with the current cadence. However, it is essential to note that while SpaceX has filed applications with the International Telecommunication Union (ITU) and obtained FCC authorization for up to 12,000 satellites, the frequently cited figure of 42,000 satellites includes additional satellites that are currently proposed but not yet fully authorized.
The figure above, based on an idea of John Strand of Strand Consult, provides an illustrative comparison of the rapid innovation and manufacturing cycles of SpaceX LEO satellites versus the slower progression of traditional satellite development and spectrum policy processes, highlighting the growing gap between technological advancement and regulatory adaptation. This is one of the biggest challenges that regulatory institutions and policy regimes face today.
Amazon’s Project Kuiper has a much smaller planned constellation. The Federal Communications Commission (FCC) has authorized Amazon to deploy 3,236 satellites under its initial phase, with a deadline requiring that at least 1,600 be launched and operational by July 2026. Amazon began launching test satellites in 2024 and aims to roll out its service in late 2025 or early 2026. On April 28, 2025, Amazon launched its first 27 operational satellites for Project Kuiper aboard a United Launch Alliance Atlas (ULA) V rocket from Cape Canaveral, Florida. This marks the beginning of Amazon’s deployment of its planned 3,236-satellite constellation aimed at providing global broadband internet coverage. Though Amazon has hinted at potential expansion beyond its authorized count, any Phase 2 remains speculative and unapproved. If such an expansion were pursued and granted, the constellation could eventually grow to 6,000 satellites, although no formal filings have yet been made to support the higher amount.
China is rapidly advancing its low Earth orbit (LEO) satellite capabilities, positioning itself as a formidable competitor to SpaceX’s Starlink by 2030. Two major Chinese LEO satellite programs are at the forefront of this effort: the Guowang (13,000) and Qianfan (15,000) constellations. So, by 2030, it is reasonable to expect that China will field a national LEO satellite broadband system with thousands of operational satellites, focused not just on domestic coverage but also on extending strategic connectivity to Belt and Road Initiative (BRI) countries, as well as regions in Africa, Asia, and South America. Unlike SpaceX’s commercially driven approach, China’s system is likely to be closely integrated with state objectives, combining broadband access with surveillance, positioning, and secure communication functionality. While it remains unclear whether China will match SpaceX’s pace of deployment or technological performance by 2030, its LEO ambitions are unequivocally driven by geopolitical considerations. They will likely shape European spectrum policy and infrastructure resilience planning in the years ahead. Guowang and Qianfan are emblematic of China’s dual-use strategy, which involves developing technologies for both civilian and military applications. This approach is part of China’s broader Military-Civil Fusion policy, which seeks to integrate civilian technological advancements into military capabilities. The dual-use nature of these satellite constellations raises concerns about their potential military applications, including surveillance and communication support for the People’s Liberation Army.
AN ILLUSTRATION OF COVERAGE – UNITED KINGDOM.
It takes approximately 172 Starlink beams to cover the United Kingdom, with 8 to 10 satellites overhead simultaneously. To have a persistent UK coverage in the order of 150 satellite constellations across appropriate orbits. Starlink’s 53° inclination orbital shell is optimized for mid-latitude regions, providing frequent satellite passes and dense, overlapping beam coverage over areas like southern England and central Europe. This results in higher throughput and more consistent connectivity with fewer satellites. In contrast, regions north of 53°N, such as northern England and Scotland, lie outside this optimal zone and depend on higher-inclination shells (70° and 97.6°), which have fewer satellites and wider, less efficient beams. As a result, coverage in these Northern areas is less dense, with lower signal quality and increased latency.
For this blog, I developed a Python script, with fewer than 600 lines of code (It’s a physicist’s code, so unlikely to be super efficient), to simulate and analyze Starlink’s satellite coverage and throughput over the United Kingdom using real orbital data. By integrating satellite propagation, beam modeling, and geographic visualization, it enables a detailed assessment of regional performance from current Starlink deployments across multiple orbital shells. Its primary purpose is to assess how the currently deployed Starlink constellation performs over UK territory by modeling where satellites pass, how their beams are steered, and how often any given area receives coverage. The simulation draws live TLE (Two-Line Element) data from Celestrak, a well-established source for satellite orbital elements. Using the Skyfield library, the code propagates the positions of active Starlink satellites over a 72-hour period, sampling every 5 minutes to track their subpoints across the United Kingdom. There is no limitation on the duration or sampling time. Choosing a more extended simulation period, such as 72 hours, provides a more statistically robust and temporally representative view of satellite coverage by averaging out orbital phasing artifacts and short-term gaps. It ensures that all satellites complete multiple orbits, allowing for more uniform sampling of ground tracks and beam coverage, especially from shells with lower satellite densities, such as the 70° and 97.6° inclinations. This results in smoother, more realistic estimates of average signal density and throughput across the entire region.
Each satellite is classified into one of three orbital shells based on inclination angle: 53°, 70°, and 97.6°. These shells are simulated separately and collectively to understand their individual and combined contributions to UK coverage. The 53° shell dominates service in the southern part of the UK, characterized by its tight orbital band and high satellite density (see the Table below). The 70° shell supplements coverage in northern regions, while the 97.6° polar shell offers sparse but critical high-latitude support, particularly in Scotland and surrounding waters. The simulation assumes several (critical) parameters for each satellite type, including the number of beams per satellite, the average beam radius, and the estimated throughput per beam. These assumptions reflect engineering estimates and publicly available Starlink performance information, but are deliberately simplified to produce regional-level coverage and throughput estimates, rather than user-specific predictions. The simulation does not account for actual user terminal distribution, congestion, or inter-satellite link (ISL) performance, focusing instead on geographic signal and capacity potential.
These parameters were used to infer beam footprints and assign realistic signal density and throughput values across the UK landmass. The satellite type was inferred from its shell (e.g., most 53° shell satellites are currently V1.5), and beam properties were adjusted accordingly.
The table above presents the core beam modeling parameters and satellite-specific assumptions used in the Starlink simulation over the United Kingdom. It includes general values for beam steering behavior, such as Gaussian spread, steering limits, city-targeting probabilities, and beam spacing constraints, as well as performance characteristics tied to specific satellite generations to the extent it is known (e.g., Starlink V1.5, V2 Mini, and V2 Full). These assumptions govern the placement of beams on the Earth’s surface and the capacity each beam can deliver. For instance, the City Exclusion Radius of 0.25 degrees corresponds to a ~25 km buffer around urban centers, where beam placement is probabilistically discouraged. Similarly, the beam radius and throughput per beam values align with known design specifications submitted by SpaceX to the U.S. Federal Communications Commission (FCC), particularly for Starlink’s V1.5 and V2 satellites. The table above also defines overlap rules, specifying the maximum number of beams that can overlap in a region and the maximum number of satellites that can contribute beams to a given point. This helps ensure that simulations reflect realistic network constraints rather than theoretical maxima.
Overall, the developed code offers a geographically and physically grounded simulation of how the existing Starlink network performs over the UK. It helps explain observed disparities in coverage and throughput by visualizing the contribution of each shell and satellite generation. This modeling approach enables planners and researchers to quantify satellite coverage performance at national and regional scales, providing insight into both current service levels and facilitating future constellation evolution, which is not discussed here.
The figure illustrates a 72-hour time-averaged Starlink coverage density over the UK. The asymmetric signal strength pattern reflects the orbital geometry of Starlink’s 53° inclination shell, which concentrates satellite coverage over southern and central England. Northern areas receive less frequent coverage due to fewer satellite passes and reduced beam density at higher latitudes.
This image above presents the Starlink Average Coverage Density over the United Kingdom, a result from a 72-hour simulation using real satellite orbital data from Celestrak. It illustrates the mean signal exposure across the UK, where color intensity reflects the frequency and density of satellite beam illumination at each location.
At the center of the image, a bright yellow core indicating the highest signal strength is clearly visible over the English Midlands, covering cities such as Birmingham, Leicester, and Bristol. The signal strength gradually declines outward in a concentric pattern—from orange to purple—as one moves northward into Scotland, west toward Northern Ireland, or eastward along the English coast. While southern cities, such as London, Southampton, and Plymouth, fall within high-coverage zones, northern cities, including Glasgow and Edinburgh, lie in significantly weaker regions. The decline in signal intensity is especially apparent beyond the 56°N latitude. This pattern is entirely consistent with what we know about the structure of the Starlink satellite constellation. The dominant contributor to coverage in this region is the 53° inclination shell, which contains 3,848 satellites spread across 36 orbital planes. This shell is designed to provide dense, continuous coverage to heavily populated mid-latitude regions, such as the southern United Kingdom, continental Europe, and the continental United States. However, its orbital geometry restricts it to a latitudinal range that ends near 53 to 54°N. As a result, southern and central England benefit from frequent satellite passes and tightly packed overlapping beams, while the northern parts of the UK do not. Particularly, Scotland lies at or beyond the shell’s effective coverage boundary.
The simulation may indicate how Starlink’s design prioritizes population density and market reach. Northern England receives only partial benefit, while Scotland and Northern Ireland fall almost entirely outside the core coverage of the 53° shell. Although some coverage in these areas is provided by higher inclination shells (specifically, the 70° shell with 420 satellites and the 97.6° polar shell with 227 satellites), these are sparser in both the number of satellites and the orbital planes. Their beams may also be broader and less (thus) less focused, resulting in lower average signal strength in high-latitude regions.
So, why is the coverage not textbook nice hexagon cells with uniform coverage across the UK? The simple answer is that real-world satellite constellations don’t behave like the static, idealized diagrams of hexagonal beam tiling often used in textbooks or promotional materials. What you’re seeing in the image is a time-averaged simulation of Starlink’s actual coverage over the UK, reflecting the dynamic and complex nature of low Earth orbit (LEO) systems like Starlink’s. Unlike geostationary satellites, LEO satellites orbit the Earth roughly every 90 minutes and move rapidly across the sky. Each satellite only covers a specific area for a short period before passing out of view over the horizon. This movement causes beam coverage to constantly shift, meaning that any given spot on the ground is covered by different satellites at different times. While individual satellites may emit beams arranged in a roughly hexagonal pattern, these patterns move, rotate, and deform continuously as the satellite passes overhead. The beams also vary in shape and strength depending on their angle relative to the Earth’s surface, becoming elongated and weaker when projected off-nadir, i.e., when the satellite is not directly overhead. Another key reason lies in the structure of Starlink’s orbital configuration. Most of the UK’s coverage comes from satellites in the 53° inclination shell, which is optimized for mid-latitude regions. As a result, southern England receives significantly denser and more frequent coverage than Scotland or Northern Ireland, which are closer to or beyond the edge of this shell’s optimal zone. Satellites serving higher latitudes originate from less densely populated orbital shells at 70° and 97.6°, which result in fewer passes and wider, less efficient beams.
The above heatmap does not illustrate a snapshot of beam locations at a specific time, but rather an averaged representation of how often each part of the UK was covered over a simulation period. This type of averaging smooths out the moment-to-moment beam structure, revealing broader patterns of coverage density instead. That’s why we see a soft gradient from intense yellow in the Midlands, where overlapping beams pass more frequently, to deep purple in northern regions, where passes are less common and less centered.
Illustrates an idealized hexagonal beam coverage footprint over the UK. For visual clarity, only a subset of hexagons is shown filled with signal intensity (yellow core to purple edge), to illustrate a textbook-like uniform tiling. In reality, satellite beams from LEO constellations, such as Starlink, are dynamic, moving, and often non-uniform due to orbital motion, beam steering, and geographic coverage constraints.
The two charts below provide a visual confirmation of the spatial coverage dynamics behind the Starlink signal strength distribution over the United Kingdom. Both are based on a 72-hour simulation using real Starlink satellite data obtained from Celestrak, and they accurately reflect the operational beam footprints and orbital tracks of currently active satellites over the United Kingdom.
This figure illustrates time-averaged Starlink coverage density over the UK with beam footprints (left) and satellite ground tracks (right) by orbital shell. The high density of beams and tracks from the 53° shell over southern UK leads to stronger and more consistent coverage. At the same time, northern regions receive fewer, more widely spaced passes from higher-inclination shells (70° and 97.6°), resulting in lower aggregate signal strength.
The first chart displays the beam footprints (i.e., the left side chart above) of Starlink satellites across the UK, color-coded by orbital shell: cyan for the 53° shell, green for the 70° shell, and magenta for the 97° polar shell. The concentration of cyan beam circles in southern and central England vividly demonstrates the dominance of the 53° shell in this region. These beams are tightly packed and frequent, explaining the high signal coverage in the earlier signal strength heatmap. In contrast, northern England and Scotland are primarily served by green and magenta beams, which are more sparse and cover larger areas — a clear indication of the lower beam density from the higher-inclination shells.
The second chart illustrates the satellite ground tracks (i.e., the right side chart above) over the same period and geographic area. Again, the saturation of cyan lines in the southern UK underscores the intensive pass frequency of satellites in the 53° inclined shell. As one moves north of approximately 53°N, these tracks vanish almost entirely, and only the green (70° shell) and magenta (97° shell) paths remain. These higher inclination tracks cross through Scotland and Northern Ireland, but with less spatial and temporal density, which supports the observed decline in average signal strength in those areas.
Together, these two charts provide spatial and orbital validation of the signal strength results. They confirm that the stronger signal levels seen in southern England stem directly from the concentrated beam targeting and denser satellite presence of the 53° shell. Meanwhile, the higher-latitude regions rely on less saturated shells, resulting in lower signal availability and throughput. This outcome is not theoretical — it reflects the live state of the Starlink constellation today.
The figure illustrates the estimated average Starlink throughput across the United Kingdom over a 72-hour window. Throughput is highest over southern and central England due to dense satellite traffic from the 53° orbital shell, which provides overlapping beam coverage and short revisit times. Northern regions experience reduced throughput from sparser satellite passes and less concentrated beam coverage.
The above chart shows the estimated average throughput of Starlink Direct-2-Dish across the United Kingdom, simulated over 72 hours using real orbital data from Celestrak. The values are expressed in Megabits per second (Mbps) and are presented as a heatmap, where higher throughput regions are shown in yellow and green, and lower values fade into blue and purple. The simulation incorporates actual satellite positions and coverage behavior from the three operational inclination shells currently providing Starlink service to the UK. Consistent with the signal strength, beam footprint density, and orbital track density, the best quality and most supplied capacity are available south of the 53°N inclination.
The strongest throughput is concentrated in a horizontal band stretching from Birmingham through London to the southeast, as well as westward into Bristol and south Wales. In this region, the estimated average throughput peaks at over 3,000 Mbps, which can support more than 30 concurrent customers each demanding 100 Mbps within the coverage area or up to 600 households with an oversubscription rate of 1 to 20. This aligns closely with the signal strength and beam density maps also generated in this simulation and is driven by the dense satellite traffic of the 53° inclination shell. These satellites pass frequently over southern and central England, where their beams overlap tightly and revisit times are short. The availability of multiple beams from different satellites at nearly all times drives up the aggregate throughput experienced at ground level. Throughput falls off sharply beyond approximately 54°N. In Scotland and Northern Ireland, values typically stay well below 1,000 Mbps. This reduction directly reflects the sparser presence of higher-latitude satellites from the 70° and 97.6° shells, which are fewer in number and more widely spaced, resulting in lower revisit frequencies and broader, less concentrated beams. The throughput map thus offers a performance-level confirmation of the underlying orbital dynamics and coverage limitations seen in the satellite and beam footprint charts.
While the above map estimates throughput in realistic terms, it is essential to understand why it does not reflect the theoretical maximum performance implied by Starlink’s physical layer capabilities. For example, a Starlink V1.5 satellite supports eight user downlink channels, each with 250 MHz of bandwidth, which in theory amounts to a total of 2 GHz of spectrum. Similarly, if one assumes 24 beams, each capable of delivering 800 Mbps, that would suggest a satellite capacity in the range of approximately 19–20 Gbps. However, these peak figures assume an ideal case with full spectrum reuse and optimized traffic shaping. In practice, the estimated average throughput shown here is the result of modeling real beam overlap and steering constraints, satellite pass timing, ground coverage limits, and the fact that not all beams are always active or directed toward the same location. Moreover, local beam capacity is shared among users and dynamically managed by the constellation. Therefore, the chart reflects a realistic, time-weighted throughput for a given geographic location, not a per-satellite or per-user maximum. It captures the outcome of many beams intermittently contributing to service across 72 hours, modulated by orbital density and beam placement strategy, rather than theoretical peak link rates.
A valuable next step in advancing the simulation model would be the integration of empirical user experience data across the UK footprint. If datasets such as comprehensive Ookla performance measurements (e.g., Starlink-specific download and upload speeds, latency, and jitter) were available with sufficient geographic granularity, the current Python model could be calibrated and validated against real-world conditions. Such data would enable the adjustment of beam throughput assumptions, satellite visibility estimates, and regional weighting factors to better reflect the actual service quality experienced by users. This would enhance the model’s predictive power, not only in representing average signal and throughput coverage, but also in identifying potential bottlenecks, underserved areas, or mismatches between orbital density and demand.
It is also important to note that this work relies on a set of simplified heuristics for beam steering, which are designed to make the simulation both tractable and transparent. In this model, beams are steered within a fixed angular distance from each satellite’s subpoint, with probabilistic biases against cities and simple exclusion zones (i.e., I operate with an exclusion radius of approximately 25 km or more). However, in reality, Starlink’s beam steering logic is expected to be substantially more advanced, employing dynamic optimization algorithms that account for real-time demand, user terminal locations, traffic load balancing, and satellite-satellite coordination via laser interlinks. Starlink has the crucial (and obvious) operational advantage of knowing exactly where its customers are, allowing it to direct capacity where it is needed most, avoid congestion (to an extent), and dynamically adapt coverage strategies. This level of real-time awareness and adaptive control is not replicated in this analysis, which assumes no knowledge of actual user distribution and treats all geographic areas equally.
As such, the current Python code provides a first-order geographic approximation of Starlink coverage and capacity potential, not a reflection of the full complexity and intelligence of SpaceX’s actual network management. Nonetheless, it offers a valuable structural framework that, if calibrated with empirical data, could evolve into a much more powerful tool for performance prediction and service planning.
Median Starlink download speeds in the United Kingdom, as reported by Ookla, from Q4 2022 to Q4 2024, indicate a general decline through 2023 and early 2024, followed by a slight recovery in late 2024. Source: Ookla.com.
The decline in real-world median user speeds, observed in the chart above, particularly from Q4 2023 to Q3 2024, may reflect increasing congestion and uneven coverage relative to demand, especially in areas outside the dense beam zones of the 53° inclination shell. This trend supports the simulation’s findings: while orbital geometry enables strong average coverage in the southern UK, northern regions rely on less frequent satellite passes from higher-inclination shells, which limits performance. The recovery of the median speed in Q4 2024 could be indicative of new satellite deployments (e.g., more V2 Minis or V2 Fulls) beginning to ease capacity constraints, something future simulation extensions could model by incorporating launch timelines and constellation updates.
Illustrates a European-based dual-use Low Earth Orbit (LEO) satellite constellation providing broadband connectivity to Europe’s millions of unconnectables by 2030 on a secure and strategic infrastructure platform covering Europe, North Africa, and the Middle East.
THE 200 BILLION EUROS QUESTION – IS THERE A PATH TO A EUROPEAN SPACE INDEPENDENCE?
Let’s start with the answer! Yes!
Is €200 billion, the estimated amount required to close the EU28 gigabit gap between 2023 and 2030, likely to enable Europe to build its own LEO satellite constellation and potentially develop one that is more secure, inclusive, and strategically aligned with its values and geopolitical objectives? In comparison, the European Union’s IRIS² (Infrastructure for Resilience, Interconnectivity and Security by Satellite) program has been allocated a total budget of 10+ billion euros aiming at building 264 LEO satellites (1,200 km) and 18 MEO satellites (8,000 km) mainly by the European “Primes” (i.e., the usual “suspects” of legacy defense contractors) by 2030. For that amount, we should even be able to afford our dedicated European stratospheric drone program for real-world use cases, as opposed to, for example, Airbus’s (AALTO) Zephyr fragile platform, which, imo, is more an impressive showcase of an innovative, sustainable (solar-driven) aerial platform than a practical, robust, high-performance communications platform.
A significant portion of this budget should be dedicated to designing, manufacturing, and launching a European-based satellite constellation. If Europe could match the satellite cost price of SpaceX, and not that of IRIS² (which appears to be large based on legacy satellite platform thinking or at least the unit price tag is), it could launch a very substantial number of EU-based LEO satellites within 200 billion euros (also for a lot less obviously). It easily matches the number of SpaceX’s long-term plans and would vastly surpass the satellites authorized under Kuiper’s first phase. To support such a constellation, Europe must invest heavily in launch infrastructure. While Ariane 6 remains in development, it could be leveraged to scale up the Ariane program or develop a reusable European launch system, mirroring and improving upon the capabilities of SpaceX’s Starship. This would reduce long-term launch costs, boost autonomy, and ensure deployment scalability over the decade. Equally essential would be establishing a robust ground segment covering the deployment of a European-wide ground station network, edge nodes, optical interconnects, and satellite laser communication capabilities.
Unlike Starlink, which benefits from SpaceX’s vertical integration, and Kuiper, which is backed by Amazon’s capital and logistics empire, a European initiative would rely heavily on strong multinational coordination. With 200 billion euros, possibly less if the usual suspects (i.e., ” Primes”) are managed accordingly, Europe could close the technology gap rapidly, secure digital sovereignty, and ensure that it is not dependent on foreign providers for critical broadband infrastructure, particularly for rural areas, government services, and defense.
Could this be done by 2030? Doubtful, unless Europe can match SpaceX’s impressive pace of innovation. That is at least to match the 3 years (2015–2018) it took SpaceX to achieve a fully reusable Falcon 9 system and the 4 years (2015–2019) it took to go from concept to the first operational V1 satellite launch. Elon has shown it is possible.
KEY TAKEAWAYS.
LEO satellite direct-to-dish broadband, when strategically deployed in underserved and hard-to-reach areas, should be seen not as a competitor to terrestrial networks but as a strategic complement. It provides a practical, scalable, and cost-effective means to close the final connectivity gap, one that terrestrial networks alone are unlikely to bridge economically. In sparsely populated rural zones, where fiber deployment becomes prohibitively expensive, LEO satellites may render new rollouts obsolete. In these cases, satellite broadband is not just an alternative. It may be essential. Moreover, it can also serve as a resilient backup in areas where rural fiber is already deployed, especially in regions lacking physical network redundancy. Rather than undermining terrestrial infrastructure, LEO extends its reach, reinforcing the case for hybrid connectivity models central to achieving EU-wide digital reach by 2030.
Instead of continuing to subsidize costly last-mile fiber in uneconomical areas, European policy should reallocate a portion of this funding toward the development of a sovereign European Low-Earth Orbit (LEO) satellite constellation. A mere 200 billion euros, or even less, would go a very long way in securing such a program. Such an investment would not only connect the remaining “unconnectables” more efficiently but also strengthen Europe’s digital sovereignty, infrastructure resilience, and strategic autonomy. A European LEO system should support dual-use applications, serving both civilian broadband access and the European defense architecture, thereby enhancing secure communications, redundancy, and situational awareness in remote regions. In a hybrid connectivity model, satellite broadband plays a dual role: as a primary solution in hard-to-reach zones and as a high-availability backup where terrestrial access exists, reinforcing a layered, future-proof infrastructure aligned with the EU’s 2030 Digital Decade objectives and evolving security imperatives.
Non-European dependence poses strategic trade-offs: The rise of LEO broadband providers, SpaceX, and China’s state-aligned Guowang and Qianfan, underscores Europe’s limited indigenous capacity in the Low Earth Orbit (LEO) space. While non-EU options may offer faster and cheaper rural connectivity, reliance on foreign infrastructure raises concerns about sovereignty, data governance, and security, especially amid growing geopolitical tensions.
LEO satellites, especially those similar or more capable than Starlink V3, can technically support the connectivity needs of Europe’s 2030s “unconnectable” (rural) households. Due to geography or economic constraints, these homes are unlikely to be reached by FTTP even under the most ambitious business-as-usual scenarios. A constellation of high-capacity satellites could serve these households with gigabit-class connections, especially when factoring in user concurrency and reasonable uptake rates.
The economics of FTTP deployment sharply deteriorate in very low-density rural regions, reinforcing the need for alternative technologies. By 2030, up to 5.5 million EU28 households are projected to remain beyond the economic viability of FTTP, down from 15.5 million rural homes in 2023. The European Commission has estimated that closing the gigabit gap from 2023 to 2030 requires around €200 billion. LEO satellite broadband may be a more cost-effective alternative, particularly with direct-to-dish architecture, at least for the share of unconnectable homes.
While LEO satellite networks offer transformative potential for deep rural coverage, they do not pose a threat to existing FTTP deployments. A Starlink V3 satellite, despite its 1 Tbps capacity, can serve the equivalent of a small fiber network, about 1,000 homes at 1 Gbps under full concurrency, or roughly 20,000 homes with 50% uptake and 10% busy-hour concurrency. FTTP remains significantly more efficient and scalable in denser areas. Satellites are not designed to compete with fiber in urban or suburban regions, but rather to complement it in places where fiber is uneconomical or otherwise unviable.
The technical attributes of LEO satellites make them ideally suited for sparse, low-density environments. Their broad coverage area and increasingly sophisticated beamforming and frequency reuse capabilities allow them to efficiently serve isolated dwellings, often spread across tens of thousands of square kilometers, where trenching fiber would be infeasible. These technologies extend the digital frontier rather than replace terrestrial infrastructure. Even with SpaceX’s innovative pace, it seems unlikely that this conclusion will change substantially within the next five years, at the very least.
A European LEO constellation could be feasible within a € 200 billion budget: The €200 billion gap identified for full gigabit coverage could, in theory, fund a sovereign European LEO system capable of servicing the “unconnectables.” If Europe adopts leaner, vertically integrated innovation models like SpaceX (and avoids legacy procurement inefficiencies), such a constellation could deliver comparable technical performance while bolstering strategic autonomy.
The future of broadband infrastructure in Europe lies in a hybrid strategy. Fiber and mobile networks should continue to serve densely populated areas, while LEO satellites, potentially supplemented by fixed wireless and 5G, offer a viable path to universal coverage. By 2030, a satellite constellation only slightly more capable than Starlink V3 could deliver broadband to virtually all of Europe’s remaining unconnected homes, without undermining the business case for large-scale FTTP networks already in place.
CAUTIONARY NOTE.
While current assessments suggest that a LEO satellite constellation with capabilities on par with or slightly exceeding those anticipated for Starlink V3 could viably serve Europe’s remaining unconnected households by 2030, it is important to acknowledge the speculative nature of these projections. The assumptions are based on publicly available data and technical disclosures. Still, it is challenging to have complete visibility into the precise specifications, performance benchmarks, or deployment strategies of SpaceX’s Starlink satellites, particularly the V3 generation, or, for that matter, Amazon’s Project Kuiper constellation. Much of what is known comes from regulatory filings (e.g., FCC), industry reports and blogs, Reddit, and similar platforms, as well as inferred capabilities. Therefore, while the conclusions drawn here are grounded in credible estimates and modeling, they should be viewed with caution until more comprehensive and independently validated performance data become available.
THE SATELLITE’S SPECS – MOST IS KEPT A “SECRET”, BUT THERE IS SOME LIGHT.
Satellite capacity is not determined by a single metric, but instead emerges from a tightly coupled set of design parameters. Variables such as spectral efficiency, channel bandwidth, polarization, beam count, and reuse factor are interdependent. Knowing a few of them allows us to estimate, bound, or verify others. This is especially valuable when analyzing or validating constellation design, performance targets, or regulatory filings.
For example, consider a satellite that uses 250 MHz channels with 2 polarizations and a spectral efficiency of 5.0 bps/Hz. These inputs directly imply a channel capacity of 1.25 Gbps and a beam capacity of 2.5 Gbps. If the satellite is intended to deliver 100 Gbps of total throughput, as disclosed in related FCC filings, one can immediately deduce that 40 beams are required. If, instead, the satellite’s reuse architecture defines 8 x 250 MHz channels per reuse group with a reuse factor of 5, and each reuse group spans a fixed coverage area. Both the theoretical and practical throughput within that area can be computed, further enabling the estimation of the total number of beams, the required spectrum, and the likely user experience. These dependencies mean that if the number of user channels, full bandwidth, channel bandwidth, number of beams, or frequency reuse factor is known, it becomes possible to estimate or cross-validate the others. This helps identify design consistency or highlight unrealistic assumptions.
In satellite systems like Starlink, the total available spectrum is limited. This is typically divided into discrete channels, for example, eight 250 MHz channels (as is the case for Starlink’s Ku-band downlink to the user’s terrestrial dish). A key architectural advantage of spot-beam satellites (e.g., with spots that are at least 50 to 80 km wide) is that frequency channels can be reused in multiple spatially separated beams, as long as the beams do not interfere with one another. This is not based on a fixed reuse factor, as seen in terrestrial cellular systems, but on beam isolation, achieved through careful beam shaping, angular separation, and sidelobe control (as also implemented in the above Python code for UK Starlink satellite coverage, albeit in much simpler ways). For instance, one beam covering southern England can use the same frequency channels as another beam covering northern Scotland, because their energy patterns do not overlap significantly at ground level. In a constellation like Starlink’s, where hundreds or even thousands of beams are formed across a satellite footprint, frequency reuse is achieved through simultaneous but non-overlapping spatial beam coverage. The reuse logic is handled dynamically on board or through ground-based scheduling, based on real-time traffic load and beam geometry.
This means that for a given satellite, the total instantaneous throughput is not only a function of spectral efficiency and bandwidth per beam, but also of the number of beams that can simultaneously operate on overlapping frequencies without causing harmful interference. If a satellite has access to 2 GHz of bandwidth and 250 MHz channels, then up to 8 distinct channels can be formed. These channels can be replicated across different beams, allowing many more than 8 beams to be active concurrently, each using one of those 8 channels, as long as they are separated enough in space. This approach allows operators to scale capacity dramatically through dense spatial reuse, rather than relying solely on expanding spectrum allocations. The ability to reuse channels across beams depends on antenna performance, beamwidth, power control, and orbital geometry, rather than a fixed reuse pattern. The same set of channels is reused across non-interfering coverage zones enabled by directional spot beams. Satellite beams can be “stacked on top of each other” up to the number of available channels, or they can be allocated optimally across a coverage area determined by user demand.
Although detailed specifications of commercial satellites, whether in operation or in the planning phase, are usually not publicly disclosed. However, companies are required to submit technical filings to the U.S. Federal Communications Commission (FCC). These filings include orbital parameters, frequency bands in use, EIRP, and antenna gain contours, as well as estimated capabilities of the satellite and user terminals. The FCC’s approval of SpaceX’s Gen2 constellation, for instance, outlines many of these values and provides a foundation upon which informed estimates of system behavior and performance can be made. The filings are not exhaustive and may omit sensitive performance data, but they serve as authoritative references for bounding what is technically feasible or likely in deployment.
ACKNOWLEDGEMENT.
I would like to acknowledge my wife, Eva Varadi, for her unwavering support, patience, and understanding throughout the creative process of writing this article.
NOTE: My “Satellite Coverage Concept Model,” which I have applied to Starlink Direct-2-Dish coverage and Services in the United Kingdom, is not limited to the UK alone but can be straightforwardly generalized to other countries and areas.
Over the last three years, I have extensively covered the details of the Western European telecom sector’s capital expense levels and the drivers behind telecom companies’ capital investments. These accounts can be found in “The Nature of Telecom Capex—a 2023 Update” from 2023 and my initial article from 2022. This new version of “The Nature of Telecom Capex – a 2024 Update” is also different compared to the issues of 2022 and 2023 in that it focuses on the near future Capex demands from 2024 to 2030 and what we may expect from our Industry capital spending over the next 7 years.
For Western Europe, Capex levels in 2023 were lower than in 2022, a relatively rare but not unique occurrence that led many industry analysts to conclude the “End of Capex” and that from now on, “Capex will surely decline.” The compelling and logical explanations were also evident, pointing out that “data traffic (growth) is in decline”, “overproduction of bandwidth”, “5G is not what it was heralded to be”, “No interest in 6G”, “Capital is too expensive” and so forth. These “End to Capex” conclusions were often made on either aggregated data or selected data, depending on the availability of data.
Having worked on Capex planning and budgeting since the early 2000s for one of the biggest telecom companies in Europe, Deutsche Telecom AG, building what has been described as best-practice Capex models, my outlook is slightly less “optimistic” about the decline and “End” of Capex spending by the Industry. Indeed, for those expecting that a Telco’s capital planning is only impacted by hyper-rational insights glued to real-world tangibles and driven by clear strategic business objectives, I beg you to modify that belief somewhat.
Figure 1 illustrates the actual telecom Capex development for Western Europe between 2017 and 2023, with projected growth from 2024 (with the first two quarters’ actual Capex levels) to 2026, represented by the orange-colored dashed lines. The light dashed line illustrates the annual baseline Capex level before 5G and fiber deployment acceleration. The light solid line shows the corresponding Telco Capex to Revenue development, including an assessment for 2024 to 2026, with an annual increase of ca. 500 million euros. Source:New Street Research European Quarterly Review, covering 15 Western European countries (see references at the end of the blog) and 56+ telcos from 2017 to 2024, with 2024 covering the year’s first two quarters.
Western Europe’s telecommunications Capex fell between 2022 and 2023 for the first time in some years, from the peak of 51 billion euros in 2022. The overall development from 2017 to 2023 is illustrated below, including a projected Capex development covering 2024 to 2026 using each Telco’s revenue projections as a simple driver for the expected Capex level (i.e., inherently assuming that the planned Capex level is correlated to the anticipated, or targeted, revenue of the subsequent year).
The reduction in Capex between 2022 and 2023 comes from 29 out of 56 Telcos reducing their Capex level in 2023 compared to 2022. In 8 out of 15 countries, the Telco Capex levels were decreased by ca. 2.3 billion euros compared to their 2022 Capex levels. Likewise, 7 countries spent approximately 650 million euros more than their 2022 levels together. If we compared the 1st and 2nd half of 2023 with 2022, there was an unprecedented Capex reduction in the 2nd half of 2023 compared to any other year from 2017 to 2023. It really gives the impression that many ( at least 36 out of 56) Telcos put their feet on the break in 2023. 29 Telcos out of the 36 broke their spending in the last half of 2023 and ended the year with an overall lower spending than in 2022. Of the 8 countries with a lower Capex spend in 2023, the UK, France, Italy, and Spain make up more than 80%. Of the countries with a higher Capex in 2023, Germany, Netherlands, Belgium, and Austria make up more than 80%.
For a few of the countries with lower Capex levels in 2023, one could argue that they more or less finished their 5G rollout and have so high fiber-to-the-home penetration levels that more fiber is on account of overbuilt and of a substantially smaller scale than in the past (e.g., France, Norway, Spain, Portugal, Denmark, and Sweden). For other countries with a lower investment level than the previous year, such as the UK, Italy, and Greece, 2022 and 2023 saw substantial consolidation activity in the markets (e.g., Vodafone UK & C.K. Hutchinson 3, Wind Hellas rounded up in Nova Greece, …). In fact, Spain (e.g., Masmovil), Norway (e.g., Ice Group), and Denmark (e.g., Telia DK) also experienced consolidation activities that will generally lower companies’ spending levels initially. One would expect, as to some extent visible in the first half of 2024, that countries that spend less due to consolidation activities would increase their Capex levels in the next two to three years after an initial replanning period.
WESTERN EUROPE – THE BIG CAPEX OVERVIEW.
Figure 2 Shows on a country-level the 5-year average Capex spend (over the period 2019 to 2023) and the Capex in 2023. Source:New Street Research European Quarterly Review 2017 to 2024 (Q2).
When attempting to understand Telco Capex, or any Capex with a “built-in” cyclicity, one really should look at more than one or two years. Figure 2 above provides the comparison with the average Capex spend over the period 2019 to 2023 and the Capex spend in 2023. The five year Capex average captures the initial stages of 5G deployment in Europe, 5G deployment in general, COVID capacity investments (in fixed networks), the acceleration of Fiber rollout in many countries in Europe (e.g., Germany, UK, Netherlands, …), the financial (inflationary) crisis of increasing costly capital, and so forth. In my opinion 2023 is a reflection of the 2021-2022 financial crisis and that most of the 5G has been deployed to cover current market needs. As we have seen before, Telco investments are often 12 to 18 month out of synch with financial crisis years, and thus it is from that perspective also not surprising that 2023 might be a lower Capex year than in the past. Although, as is also evident from Figure 2, only 5 countries had a lower Capex level in 2023 than the previous 5 years average level.
Figure 3 Illustrates the Capex development over the last 5 years from 2019 to 2023 with the color Green showing years where the subsequent year had a higher Capex level, and color Red that the subsequent year had a lower Capex level. From a Western Europe perspective only 2023 had a lower Capex level than the previous year (compared to the last 5 years). Source:New Street Research European Quarterly Review 2017 to 2024 (Q2).
Using Capex to Revenue ratios of the Telco industry are prone to some uncertainty. This is particular the case when individual Telcos are compared. In general, I recommend to make comparisons over a given period of time, like 3 or 5 year periods, as it averages out some of the natural variation between Telcos and countries (e.g., one country or Telco may have started its 5G deployment earlier than others). Even that approach has to be taken with some caution as some Telcos may fully incur Capex for fiber deployments and others may make wholesale agreements with open Fiberco’s (for example) and only incur last-mile access or connection Capex. Although, of smaller relative Capex scale nowadays, Telcos increasingly have Towercos managing and building their passive infrastructure for their cell site demand. Some may still fully build their own cell sites, incurring proportionally higher Capex per new site deployed, which of course may lead to structural Capex differences between such Telcos. Having these cautionary remarks in mind, I believe that Capex to Revenue ratios does provide a means of comparing Countries or Telcos and it does give provide a picture of the capital investment intensity compared to the market performance. A country comparison of the 5-year (period: 2019 to 2023) average Capex to Revenue ratio is illustrated in Figure 3 below for the 15 markets considered in this blog.
Figure 4 Shows on a country-level the 5-year average Capex to Revenue ratios over the period 2019 to 2023. Source:New Street Research European Quarterly Review 2017 to 2024 (Q2).
Comparing Capex per capita and Capex as a percentage of GDP may offer insights into how capital investments are prioritized in relation to population size and economic output. These two metrics could highlight different aspects of investment strategies, providing a more comprehensive understanding of national economic priorities and critical infrastructure development levels. Such a comparison is show in Figure 15 below.
Capex per capita, shown in Figure 5 left hand side, measures the average amount of investment allocated to each person within a country. This metric is particularly useful for understanding the intensity of investment relative to the population, indicating how much infrastructure, technology, or other capital resources are being made available on a per-person basis. A higher Capex per capita suggests significant investment in areas like public services, infrastructure, or economic development, which could improve quality of life or boost productivity. Comparing this measure across countries helps identify disparities in investment levels, revealing which nations are placing greater emphasis on infrastructure development or economic expansion. For example, a country with a high Capex per capita likely prioritizes public goods such as transportation, energy, or digital infrastructure, potentially leading to better economic outcomes and higher living standards over time. The 5-year average Capex level does show a strong positive linear relationship with the Country population (R² = 0.9318, chart not shown), suggesting that ca. 93% of the variation in Capex can be explained by the variation in population. The trend implies that as the population increases, Capex also tends to increase, likely reflecting higher investment needs to accommodate larger populations. It should be noted that that a countries surface area is not a significant factor influencing Capex. While some countries with larger land areas might exhibit a higher Capex level, the overall trend is not strong.
Capex as a percentage of GDP, shown in Figure 5 right hand side, measures the proportion of a country’s economic output devoted to capital investment. This ratio provides context for understanding investment levels relative to the size of the economy, showing how much emphasis is placed on growth and development. A higher Capex-to-GDP ratio can indicate an aggressive investment strategy, commonly seen in developing economies or countries undergoing significant infrastructure expansion. Conversely, a lower ratio might suggest efficient capital allocation or, in some cases, underinvestment that could constrain future economic growth. This metric helps assess the sustainability of investment levels and reflects economic priorities. For instance, a high Capex-to-GDP ratio in a developed country could indicate a focus on upgrading existing infrastructure, whereas in a developing economy, it may signify efforts to close infrastructure gaps, modernization efforts (e.g., optical fiber replacing copper infrastructure per fixed broadband transformation) and accelerating growth. The 5-year average Capex level does show a strong positive linear relationship with the Country GDP (R² = 0.9389, chart not shown), suggesting that ca. 94% of the variation in Capex can be explained by the variation in the country GDP. While a few data points show some deviation from this trend, the overall fit is very strong, reinforcing the notion that larger economies generally allocate more resources to capital investments.
The insights gained from both Capex per capita and Capex as a percentage of GDP are complementary, providing a fuller picture of a country’s investment strategy. While Capex per capita reflects individual investment levels, Capex as a percentage of GDP reveals the scale of investment in relation to the overall economy. For example, a country with high Capex per capita but a low Capex-to-GDP ratio (e.g., Denmark, Norway, …) may have a wealthy population where individual investment levels are significant, but the size of the economy is such that these investments constitute a relatively small portion of total economic activity. Conversely, a country with a high Capex-to-GDP ratio but low Capex per capita (e.g., Greece) may be dedicating a substantial portion of its economic resources to infrastructure in an effort to drive growth, even if the per-person investment remains modest.
Figure 5 Illustrates two charts that compare the average capital expenditures over a 5-year period from 2019 to 2023. The left chart shows Capex per capita in euros, with Switzerland leading at 230 euros, while Spain has the lowest at 75 euros. The right chart depicts Capex as a percentage of GDP, where Greece tops the list at 0.47%, and Sweden is at the bottom with 0.16%. These metrics provide insights into how different countries allocate investments relative to their population size and economic output, revealing varying levels of investment intensity and economic priorities. It should be noted that Capex levels are strongly correlated with both the size of the population and the size of the economy as measured by the GDP. Source:New Street Research European Quarterly Review 2017 to 2024 (Q2).
FORWARD TO THE PAST.
Almost 15 years ago, I gave a presentation at the “4G World China” conference in Beijing titled “Economics of 4G Introduction in Growth Markets”. The idea was that a mobile operator’s capital demand would cycle between 8% (minimum) and 13% (maximum), usually with one replacement cycle before migrating to the next-generation radio access technology. This insight was backed up by best-practice capital demand models considering market strategy and growth Capex drivers. It involved also involved the insights of many expert discussions.
Figure 6 illustrates my expectations of how Capex would relate before, during, and after LTE deployment in Western Europe. Source:“Economics of 4G Introduction in Growth Markets” at “4G World China”, 2011.
For the careful observer, you will see that I expected, back in 2011, the typical Capex maintenance cycle in Western European markets between infrastructure and technology modernization periods to be no more than 8% and that Capex in the maintenance years would be 30% lower than required in the peak periods. I have yet to see a mobile operation with such a low capital intensity unless they effectively share their radio access network and/or by cost-structure “magic” (i.e., cost transformation), move typical mobile Capex items to Opex (by sourcing or optimizing the cost structure between fixed and mobile business units).
I retrospectively underestimated the industry’s willingness to continue increasing capital investments in existing networks, often ignoring the obvious optimization possibilities between their fixed and mobile broadband networks (due to organizational politics) and, of course, what has and still is a major industrial contagious infliction: “Metus Crescendi Exponentialis” (i.e., the fear of the exponential growth aka the opportunity to spend increasingly lots of Capex). From 2000 to today, the Western European Capex to Revenue ratio has been approximately between 11% and 21%, although it has been growing since around 2012 (see details in “The Nature of Telecom Capex—a 2023 Update”).
CAPEX DEVELOPMENT FROM 2024 TO 2026.
From the above Figure 1, it should be no surprise that I do not expect Capex to continue to decline substantially over the next couple of years, as we saw between 2022 and 2023. In fact, I anticipate that 2024 will be around the level of 2023, after which we will experience modest annual increases of 600 to 700 million euros. Countries with high 5G and Fiber-to-the-Home (FTTH) coverage (e.g., France, Netherlands, Norway, Spain, Portugal, Denmark, and Sweden) will keep their Capex levels possible with some modest declines with single-digit percentage points. Countries such as Germany, the UK, Austria, Belgium, and Greece are still European laggards in terms of FTTH coverage, being far below the 80+% of other Western European countries such as France, Spain, Portugal, Netherlands, Denmark, Sweden, and Norway. Such countries may be expected to continue to increase their Capex as they close the FTTH coverage gap. Here, it is worth remembering that several fiber acquisition strategies aiming at connecting homes with fiber result in a lower Capex than if a Telco aims to build all the required fiber infrastructure.
Consolidation Capex.
Telecom companies tend to scale back Capex during consolidation due to uncertainty, the desire to avoid redundancy, and the need to preserve cash. However, after regulatory approval and the deal’s closing, Capex typically rises as the company embarks on network integration, system migration, and infrastructure upgrades necessary to realize the merger’s benefits. This post-merger increase in Capex is crucial for achieving operational synergies, enhancing network performance, and maintaining a competitive edge in the telecom market.
If we look at the period 2021 to 2024, we have had the following consolidation and acquisition examples:
UK: In May 2021, Virgin Media and the O2 (Telefonica) UK merger was approved. They announced the intention to consolidate on May 7th, 2020.
UK: Vodafone UK and Three UK announced their intention to merge in June 2023. The final decision is expected by the end of 2024.
Spain: Orange and MasMovil announced their intent to consolidate in July 2023. Merger approval was given in February 2024. Conditions were imposed on the deal for MasMovil to divestitures its frequency spectrum.
Italy: The potential merger between Telecom Italia (TIM) and Open Fiber was first discussed in 2020 when the idea emerged to create a national fiber network in Italy by merging TIM’s fixed access unit, FiberCop, with Open Fiber. a Memorandum of Understanding was signed in May 2022.
Greece: Wind Hellas acquisition by United Group (Nova) was announced in August 2021 and finalized in January 2022 (with EU approval in December 2021).
Denmark: Norlys’s acquisition of Telia Denmark was first announced on April 25, 2023, and approved by the Danish competition authority in February 2024.
Thus, we should also expect that the bigger in-market consolidations may, in the short term (next 2+ years), lead to increased Capex spending during the consolidation phase, after which Capex (& Opex) synergies hopefully kick in. Typically, 2 budgetary cycles minimum before this would be expected to be observed. Consolidation Capex usually amounts to a couple of percentage points of total consolidated revenue, with some other bigger items being postponed to the tail end of a consolidation unless it is synergetic with the required integration.
The High-risk Suppler Challenge to Western Europe’s Telcos.
When assessing whether Capex will increase or decrease over the next few years (e.g., up to 2030), we cannot ignore the substantial Capex amounts associated with replacing high-risk suppliers (e.g., Huawei, ZTE) from Western European telecom networks. Today, the impact is mainly on mobile critical infrastructure, which is “limited” to core networks and 5G radio access networks (although some EU member states may have extended the reach beyond purely 5G). Particularly if (or when?) the current European Commission’s 5G Toolbox (legal) Framework (i.e., “The EU Toolbox for 5G Security”) is extended to all broadband network infrastructure (e.g., optical and IP transport network infrastructure, non-mobile backend networking & IT systems) and possibly beyond to also address Optical Network Terminal (ONT) and Customer Premise Equipment (note: ONT’s can be integrated in the CPE or alternatively separated from the CPE but installed at the customers premise). To an extent, it is thought-provoking that the EU emphasis has only been on 5G-associated critical infrastructure rather than the vast and ongoing investment of fiber-optical, next-generation fixed broadband networks across all European Union member states (and beyond). In particular, this may appear puzzling when the European Union has subsidized these new fiber-optical networks by up to 50%. Considering that the fixed-broadband traffic is 8 to 10 times that of the mobile traffic, and all mobile (and wireless) traffic passes through the fixed broadband network and associated local as well as global internet critical infrastructure.
As far back as 2013, the European Parliament raised some concerns about the degree of involvement (market share) of Chinese companies in the EU’s telecommunications sector. It should be remembered that in 2013, Europe’s sentiment was generally positive and optimistic toward collaboration with China, as evidenced by the European Commission’s report “EU-China 2020 Strategic Agenda for Cooperation” (2013). Historically, the development of the EU’s 5G Toolbox for Security was the result of a series of events from about 2008 (after the financial crisis) to 2019 (and to today), characterized by growing awareness in Europe of China’s strategic ambitions, the expansion of the BRI (Belt and Road Initiative, 2013), DSR (Digital Silk Road, an important part of BRI 2.0, 2015), and China’s National Intelligence Law (2017) requiring Chinese companies to cooperate with the Chinese Government on intelligence matters, as well as several high-profile cybersecurity incidents (e.g., APT, Operation Cloud Hopper, …), and increased scrutiny of Chinese technology providers and their influence on critical communications infrastructure across pretty much the whole of Europe. These factors collectively drove the EU to adopt a more cautious and coordinated approach to addressing security risks in the context of 5G and beyond.
Figure 7 illustrates Western society, including Western Europe, ‘s concern about Chinese technology presence in its digital infrastructure. A substantial “hidden” capital expense (security debt) is tied to Western Telco’s telecom infrastructures, mobile and fixed.
The European Commission’s 2023 second report on the implementation of the EU 5G cybersecurity toolbox offers an in-depth examination of the risks posed by high-risk suppliers, focusing on Chinese-origin infrastructure, such as equipment from Huawei and ZTE. The report outlines the various stages of implementation across EU Member States and provides recommendations on how to mitigate risks associated with Chinese infrastructure. It considers 5G and fixed broadband networks, including Customer Premise Equipment (CPE) devices like modems and routers placed at customer sites.
The EU Commission defines a high-risk supplier in the context of 5G cybersecurity based on several objective criteria to reduce security threats in telecom networks. A supplier may be classified as high-risk if it originates from a non-EU country with strong governmental ties or interference, particularly if its legal and political systems lack democratic safeguards, security protections, or data protection agreements with the EU. Suppliers susceptible to governmental control in such countries pose a higher risk.
A supplier’s ability to maintain a reliable and uninterrupted supply chain is also critical. A supplier may be considered high-risk if it is deemed vulnerable in delivering essential telecom components or ensuring consistent service. Corporate governance is another important aspect. Suppliers with opaque ownership structures or unclear separation from state influence are more likely to be classified as high-risk due to the increased potential for external control or lack of transparency.
A supplier’s cybersecurity practices also play a significant role. If the quality of the supplier’s products and its ability to implement security measures across operations are considered inadequate, this may raise concerns. In some cases, country-specific factors, such as intelligence assessments from national security agencies or evidence of offensive cyber capabilities, might heighten the risk associated with a particular supplier.
Furthermore, suppliers linked to criminal activities or intelligence-gathering operations undermining the EU’s security interests may also be considered high-risk.
To summarize what may make a telecom supplier a high-risk supplier:
Of non-EU origin.
Strong governmental ties.
The country of origin lacks democratic safeguards.
The country of origin lacks security protection or data protection agreements with the EU.
Associated supply chain risks of interruption.
Opaque ownership structure.
Unclear separation from state influence.
Ability to independently implement security measures shielding infrastructure from interference (e.g., sabotage, espionage, …).
These criteria are applied to ensure that telecom operators, and eventually any business with critical infrastructure, become independent of a single supplier, especially those that pose a higher risk to the security and stability of critical infrastructure.
Figure 8 above summarizes the current European legislative framework addressing high-risk suppliers in critical infrastructure, with an initial focus on 5G infrastructure and networks.
Regarding 5G infrastructure, the EU report reiterates the urgency for EU Member States to immediately implement restrictions on high-risk suppliers. The EU policy highlights the risks of state interference and cybersecurity vulnerabilities posed by the close ties between Chinese companies like Huawei and ZTE and the Chinese government. Following groundwork dating back to the 2008s EU Directive on Critical Infrastructure Protection (EPCIP), The EU’s Digital Single Market Strategy (2015), the (first) Network and Information Security (NIS) directive (2016), and early European concern about 5G societal impact and exposure to cybersecurity (2015 – 2017), the EU toolbox published in January 2020 is designed to address these risks by urging Member States to adopt a coordinated approach. As of 2023, a second EU report was published on the member state’s progress in implementing the EU Toolbox for 5G Cybersecurity. While many Member States have established legal frameworks that give national authorities the power to assess supplier risks, only 10 have fully imposed restrictions on high-risk suppliers in their 5G networks. The report criticizes the slow pace of action in some countries, which increases the EU’s collective exposure to security threats.
Germany, having one of the largest, in absolute numbers, Chinese RAN deployments in Western Europe, has been singled out for its apparent reluctance to address the high-risk supplier challenge in the last couple of years (see also notes in “Further Readings” at the back of this blog). Germany introduced its regulation on Chinese high-risk suppliers in July 2024 with a combination of their Telekommunikationsgesetz (TKG) and IT-Sicherheitsgesetz 2.0. The German government announced that starting in 2026, it will ban critical components from Huawei and ZTE in its 5G networks due to national security concerns. This decision aligns Germany with other European countries working to limit reliance on high-risk suppliers. Germany has been slower in implementing such measures than others in the EU, but the regulation marks a significant step towards strengthening its telecom infrastructure security. Light Reading has estimated that a German Huawei ban would cost €2.5B and take years for German telcos. This estimate seems very optimistic and certainly would require very substantial discounts from the supplier that would be chosen to replace, for example, their Huawei installations with, e.g., for Telekom Deutschland that would be ca. 50+% of their ca. 38+ thousand sites, and it is difficult for me to believe that that kind of economy would apply to all telcos in Western Europe with high-risk suppliers. I also believe it ignores de-commissioning costs and changes to the backend O&M systems. I expect telco operators will try to push the timeline for replacement until most of their high-risk supplier infrastructure is written off and ripe for modernization, which for Germany would most likely happen after 2026. One way or another, we should expect an increase in mobile Capex spending towards the end of the decade as the German operators are swapping out their Chinese RAN suppliers (which may only be a small part of their Capital spend if the ban is extended beyond 5G).
The European Commission recommends that restrictions cover critical and highly sensitive assets, such as the Radio Access Network (RAN) and core network functions, and urges member states to define transition periods to phase out existing equipment from high-risk suppliers. The transition periods, however, must be short enough to avoid prolonging dependency on these suppliers. Notably, the report calls for an immediate halt to installing new equipment from high-risk vendors, ensuring that ongoing deployment does not undermine EU security.
When it comes to fixed broadband services, the report extends its concerns beyond 5G. It stresses that many Member States are also taking steps to ensure that the fixed network infrastructure is not reliant on high-risk suppliers. Fourteen (14) member states have either implemented or plan to restrict Chinese-origin equipment in their fixed networks. Furthermore, nine (9) countries have adopted technology-neutral legislation, meaning the restrictions apply across all types of networks, not just 5G. This implies that Chinese-origin infrastructure, including transport network components, will eventually face the same scrutiny and restrictions as 5G networks. While the report does not explicitly call for a total ban on all Chinese-origin equipment, it stresses the need for detailed assessments of supplier risks and restrictions where necessary based on these assessments.
While the EU’s “5G Security Toolbox” focuses on 5G networks, Denmark’s approach, the “Danish Investment Screening Act,” which took effect on the 1st of July 2021, goes much further by addressing the security of fixed broadband, 4G, and transport networks. This broad regulatory focus helps Denmark ensure the security of its entire communications ecosystem, recognizing that vulnerabilities in older or supporting networks could still pose serious risks. A clear example of Denmark’s comprehensive approach to telecommunications security beyond 5G is when the Danish Center for Cybersikkerhed (CFCS) required TDC Net to remove Chinese DWDM equipment from its optical transport network. TDC Net claimed that the consequence of the CFCS requirement would result in substantial costs to TDC Net that they had not considered in their budgets. CFCS has regulatory and legal authority within Denmark, particularly in relation to national cybersecurity. CFCS is part of the Danish Defense Intelligence Service, which places it under the Ministry of Defense. Denmark’s regulatory framework is not only one of the sharpest implementations of the EU’s 5G Toolkit but also one of the most extensive in protecting its national telecom infrastructure across multiple layers and generations of technology. The Danish approach could be a strong candidate to serve as a blueprint for expanded EU regulation beyond 5G high-risk suppliers and thus become applicable to fixed broadband and transport networks, resulting in substantial additional Capex towards the end of the decade.
While not singled out as a unique risk category, customer premises equipment (CPE) from high-risk suppliers is mentioned in the context of broader network security measures. Some Member States have indicated plans to ensure that CPE is subject to strict procurement standards, potentially using EU-wide certification schemes to vet the security of such devices. CPE may be included in future security measures if it presents a significant risk to the network. Many CPEs have been integrated with the optical network terminal, or ONT, which is architecturally a part of the fixed broadband infrastructure, serving as a demarcation point between the fiber optic network and the customer’s internal network. Thus, ONT is highly likely to be considered and included in any high-risk supplier limitations that may come soon. Any CPE replacement program would likely be associated on its own with considerable Capex and cost for operators and their customers in general. The CPE quantum for the European Union (including the UK, cheeky, I know) is between 200 and 250 million CPEs, including various types of CPE devices, such as routers, modems, ONTs, and other network equipment deployed for residential and commercial users. It is estimated that 30% to 40% of these CPEs may be linked to high-risk Chinese suppliers. The financial impact of a systematic CPE replacement program in the EU (including the UK) could be between 5 to 8 billion euros in capital expenses, ignoring the huge operational costs of executing such a replacement program.
The Data Growth Slow Down – An Opportunities for Lower Capex?
How do we identify whether a growth dynamics, such as data growth, is exponential or self-limiting?
Exponential growth dynamics have the same (percentage) growth rate indefinitely. Self-limiting growth dynamics, or s-curve behavior, will have a declining growth rate. Natural systems are generally self-limiting, although they might exhibit exponential growth over a short term, typically in the initial growth phase. So, if you are in doubt (which you should not be), calculate the growth rate of your growth dynamics from the beginning until now. If that growth rate is constant (over several time intervals), your dynamics are exponential in nature (at least over the period you looked at); if not … well, your growth process is most likely self-limiting.
Telco Capex increases, and Telco Capex decreases. Capex is, in nature, cyclic, although increasing over time. Most European markets will have access to 550 to 650 MHz downlink spectrum depending on SDL deployment levels below 4 GHz. Assuming 4 (1) Mbps per DL (UL) MHz per sector effective spectral efficiency, 10 traffic hours per day, and ca. 350 to 400 thousand mobile sites (3 sectors each) across Western Europe, the carrying mobile capacity in Bytes is in the order of 140 Exa Bytes (EB) per Month (note: if I had chosen 2 and 0.5 Mbps per MHz per sector, carrying capacity would be ca. 70 EB/Month). It is clear that this carrying capacity limit will continue to increase with software releases, innovation, advanced antenna deployment with higher order MiMo, and migration from older radio access technologies to the newest (increasing the effective spectral efficiency).
According to Ericsson Mobility Visualizer, Western Europe saw a mobile data demand per month of 11 EB in 2023 (see Figure below). The demand for mobile data in 2023 was almost 10 times lower than the (conservatively) estimated carrying capacity of the underlying mobile networks.
Figure 9 illustrates the actual demanded data volume in EB per month. I have often observed that when planners estimate their budgetary demand for capacity expansions, they use the current YoY growth rate and apply it to the future (assuming their growth dynamics are geometrical). I call this the “Naive Expectations” assumption (fallacy) that obviously leads to the overprovision of network capacity and less efficient use of Capex, as opposed to the “Informed Expectations” approach based on the more realistic S-Curve dynamic growth dynamics. I have rarely seen the “Naive Expectations” fallacy challenged by CFOs or non-technical leadership responsible for the Telco budgets and economic health. Although not a transparent approach, it is a “great” way to add a “bit” of Capex cushion for other Capex uncertainties.
It should be noted that the Ericsson data treats traffic generated by fixed wireless access (FWA) separately (which, by the way, makes sense). Thus, the 11 EB for 2023 does not include FWA traffic. Ericsson only has a global forecast for FWA traffic starting from 2023 (note: it is not clear whether 2023 is actual FWA traffic or estimated). To get an impression of the long-term impact of FWA traffic, we can apply the same S-curve approach as the one used for mobile data traffic above, according to what I call the “Informed expectations” approach. Even with the FWA traffic, it is difficult to see a situation that, on average (at least), would pose any challenge to existing mobile networks. Particularly, the carrying capacity can easily be increased by deploying more advanced antennas (e.g., higher order MiMo), and, in general, it is expected to improve with each new software release forthcoming.
Figure 10 above uses Ericsson’s Mobile Visualizer data for Western Europe’s mobile and fixed wireless access (FWA) traffic. It gives us an idea of the total traffic expectations if the current usage dynamics continue. Ericsson only provides a global FWA forecast from 2023 to 2029. I have assumed WEU takes its proportional mobile share of the FWA traffic. Note: For the period up to and including 2023, it seems a bit rich in its FWA expectations, imo.
So, by all means, the latest and greatest mobile networks are, without much doubt, in most places, over-dimensioned from the perspective of their carrying bytes potential, the volumetric capacity, and what is demanded in terms of data volume. They also appear to remain so for a very long time unless the current demand dynamics fundamentally change (which is, of course, always a possibility, as we have seen historically).
However, that our customers get their volumetric demand satisfied is generally a reflection of the quality in terms of bits per second (a much more fundamental unit than volume) satisfied. Thus, the throughput, or speed, should be good enough for the customer to unhindered enjoy their consumption, which, as a consequence, generates the Bytes that most Telco executives have told themselves they understand and like to base their pricing on (and I would argue judging by my experience outside Europe more often than not maybe really don’t get). It is not uncommon that operators with complex volumetric pricing become more obsessed with data volume rather than optimum quality (that might, in fact, generate even more volume). The figure below is a snapshot from August 2024 of the median speeds customers enjoy in mobile as well as fixed broadband networks in Western Europe. In most cases in Europe, customers today enjoy substantially faster fixed-broadband services than they would get in mobile networks. One should expect that this would change how Telcos (at least integrated Telcos) would design and plan their mobile networks and, consequently, maybe dramatically reduce the amount of Mobile Capex we spend. There is little evidence that this is happening yet. However, I do anticipate, most likely naively, that the Telco industry would revise how mobile networks are architected, designed, and built with 6G.
Figure 11 shows that apart from one Western European country (Greece, also a fixed broadband laggard), all other markets have superior fixed broadband downlink speeds compared to what mobile networks can deliver. Note that the speed measurement data is based on the median statistic. Source:Speedtest Global Index, August 2024.
A Crisis of Too Much of a “Good” Thing?
Analysys Mason recently (July 2024) published a report titled “A Crisis of Overproduction in Bandwidth Means that Telecoms Capex Will Inevitably Fall.” The report explores the evolving dynamics of capital expenditure (Capex) in the telecom industry, highlighting that the industry is facing a turning point. The report argues that the telecom sector has reached a phase of bandwidth overproduction, where the infrastructure built to deliver data has far exceeded demand, leading to a natural decline in Capex over the coming years.
According to the Analysys Mason report, global Capex in the telecom sector has already peaked, with two significant investment surges behind it: the rollout of 5G networks in mobile infrastructure and substantial investments in fiber-to-the-premises (FTTP) networks. Both of these infrastructure developments were seen as essential for future-proofing networks, but now that the peaks in these investments have passed, Capex is expected to fall. The report predicts that by 2030, the Capex intensity (the proportion of revenue spent on capital investments) will drop from around 20% to 12%. This reduction is due to the shift from building new infrastructure to optimizing and maintaining existing networks.
The main messages that I take away from the Analysys Mason report are the following:
Overproduction of bandwidth: Telecom operators have invested heavily in building their networks. However, demand for data and bandwidth is no longer growing at the exponential rates seen in previous years.
Shifting Capex Trends: The telecom industry is experiencing two peaks: one in mobile spending due to the initial 5G coverage rollout and another in fixed broadband due to fiber deployments. Now that these peaks have passed, Capex is expected to decline.
Impact of lower data growth: The stagnation in mobile and fixed data demand, combined with the overproduction of mobile and fixed bandwidth, makes further large-scale investment in network expansion unnecessary.
My take on Analysys Mason’s conclusions is that with the cyclic nature of Telco investments, it is natural to expect that Capex will go up and down. That Capex will cycle between 20% (peak deployment phase) and 12% (maintenance phase) seems very agreeable. However, I would expect that the maintenance level would continue to increase as time goes by unless we fundamentally change how we approach mobile investments.
That network capacity is built up at the beginning of a new technology cycle (e.g., 5G NR, GPON, XGPON, XSGPON-based FTTH), it is also not surprising that the amount of available capacity will appear substantial. I would not call it a bandwidth overproduction crisis (although I agree that the overhead of provisioned carrying capacity compared to demand expectations seems historically high); it manifests the technologies we have developed and deployed today. For 5G NR real-world conditions, users could see peak DL speeds ranging from 200 Mbps to 1 Gbps with median 5G DL speeds of 100+ Mbps. The lower end of this range applies in areas with fewer available resources (e.g., less spectrum, fewer MIMO streams). In comparison, the higher end reflects better conditions, such as when a user is close to the cell tower with optimal signal conditions. The quality of fiber-connected households at current GPON and XGPON technology would be sustainable at 1 to 10 Gbps downstream to the in-home ONT/CPE. However, the in-home quality experienced over WiFi would depend a lot on how the WiFi network has been deployed and how many concurrent users there are at any given time. As backhaul and backbone transmission solutions to mobile and fixed access will be modern and fiber-based, there is no reason to believe that user demand should be limited in any way (anytime soon), given a well-optimized, modern fiber-optic network should be able to reach up to 100 Tbps (e.g., 10 EB per month with 10 traffic hours per day).
Germany, the UK, Belgium, and a few smaller Western countries will continue their fiber deployment for some years to bring their fiber coverage up to the level of countries such as France, Spain, Portugal, and the Netherlands. It is difficult to believe that these countries would not continue to invest substantial money to raise their fiber coverage from their current low levels. Countries with less than 60% fiber-to-the-home coverage have a share of 50+ % of the overall Western European Capex level.
The fact that the Telco industry would eventually experience lower growth rates should not surprise anyone. That has been in the cards since growth began. The figure below takes actual mobile data from Ericsson’s Mobile Visualizer. It applies a simple S-curve growth model dynamics to those data that actually do a very good job of accounting for the behavior. A geometrical growth model (or exponential growth dynamics), while possibly accounting for the early stages of technology adaptation and the resulting data growth, is not a reasonable model to apply here and is not supported by the actual data.
Figure 12 provides the actual Exa Bytes (EB) monthly with a fitted S-Curve extrapolated beyond 2023. The S-Curve is described by the Data Demand Limit (Ls), Growth Rate (k), and the Inflection Year (T0), where growth transitions from acceleration to deceleration. Source:Ericsson Mobile Visualizer resource.
The growth dynamic, applied to the data we extract from the markets shown in the above Figure, indicates that in Western Europe and the CEE (Central Eastern Europe), the inflection point should be expected around 2025. This is the year when the growth rates begin to decline. In Western Europe (and CEE), we would expect the growth rate to become less than 10% by 2030, assuming that no fundamental changes to the growth dynamic occur. The inflection point for the North American markets (i.e., The USA and Canada) is around 2033; this is expected to happen a bit earlier (2030) for Asia. Based on the current growth dynamics, North America will experience growth rates below 10% by 2036. For Asia, this event is expected to take place around 2033. How could FWA traffic growth change these results? The overall behavior would not change. The inflection point may happen later, thus the onset of slower growth rates, and the time when we would expect a growth rate lower than 10% would be a couple of years after the inflection year.
Let us just for fun (usually the best reason) construct a counterfactual situation. Let us assume that data growth continues to follow geometric (exponential) growth indefinitely without reaching a saturation point or encountering any constraints (e.g., resource limits, user behavior limitations). The premise is that user demand for mobile and fixed-line data will continue to grow at a constant, accelerating rate. For mobile data growth, we use the 27% YoY growth of 2023 and use this growth rate for our geometrical growth model. Thus, every ca. 3 years, the demand would double.
If telecom data usage continued to grow geometrically, the implications would (obviously) be profound:
Exponential network demand: Operators would face exponentially increasing demand on their networks, requiring constant and massive investments in capacity to handle growing traffic. Once we reach the limits of the carrying capacity of the network, we have three years (with a CAGR of 27%) until demand has doubled. Obviously, any spectrum position would quickly become insufficient, resulting in massive investments in new infrastructure (sites in mobile and more fiber) would be needed. Capacity would become the growth limiting factor.
Costs: The capital expenditures (Capex) required to keep pace with geometric growth would skyrocket. Operators must continually upgrade or replace network equipment, expand physical infrastructure, and acquire additional spectrum to support the growing data loads. This would lead to unsustainable business models unless prices for services rose dramatically, making such growth scenarios unaffordable for consumers but long before that for the operators themselves.
Environmental and Physical Limits: The physical infrastructure necessary to support geometric growth (cell towers, fiber optic cables, data centers) would also have environmental consequences, such as increased energy consumption and carbon emissions. Additionally, telecom providers would face the law of diminishing returns as building out and maintaining these networks becomes less economically feasible over time.
Consumer Experience: The geometric growth model assumes that user behavior will continue to change dramatically. Consumers would need to find new ways to utilize vast amounts of bandwidth beyond streaming and current data-heavy applications. Continuous innovation in data-hungry applications would be necessary to keep up with the increased data usage.
The counterfactual argument shows that geometric growth, while useful for the early stages of data expansion, becomes unrealistic as it leads to unsustainable economic, physical, and environmental demands. The observed S-curve growth is more appropriate for describing mobile data demand because it accounts for saturation, the limits of user behavior, and the constraints of telecom infrastructure investment.
Back to Analysys Mason’s expected, and quite reasonable, consequence of the (progressively) lower data growth: large-scale investment would become unnecessary.
While the assertion is reasonable, as said, mobile obsolescence hits the industry every 5 to 7 years, regardless of whether there is a new radio access technology (RAT) to take over. I don’t think this will change, or maybe the Industry will spend much more on software annually than previously and less on hardware modernization during obsolescence transformations. Though I suspect that the software would impose increasingly harder requirements on the underlying hardware (whether on-prem or in the cloud), modernization investments into the hardware part would continue to be substantial. This is not even considering the euphoria that may come around the next generation RAT (e.g., 6G).
The fixed broadband fiber infrastructure’s economical and useful life is much longer than that of the mobile infrastructure. The optical transmission equipment is likewise used for access, aggregation, and backbone (although not as long as the optical fiber itself). Additionally, fiber-based fixed broadband networks are operationally (much) more efficient than their mobile counterparts, alluding to the need to re-architect and redesign how they are being built as they are no longer needed inside customer dwellings. Overall, it is not unreasonable to expect that fixed broadband modernization investments will occur less frequently than for mobile networks.
Is Enough Customer Bandwidth a Thing?
Is there an optimum level of bandwidth in bits per second at which a customer is fully (optimized) served? Beyond that, whether the network could provide far more speed or quality does not matter.
For example. for most mobile devices, phones, and tablets, much more than 10 Mbps for streaming would not make much of a viewing difference for the typical customer. Given the assumptions about eyesight and typical viewing distances, more than 90% of people would not notice an improvement in viewing experience on a mobile phone or tablet beyond 1080p resolution. Increasing the resolution beyond that point—such as to 1440p (Quad HD) or 4K would likely not provide a noticeably better experience for most users, as their visual acuity limits their ability to discern finer details on small screens. This means the focus for improving mobile and tablet displays shifts from resolution to other factors like color accuracy, brightness, and contrast rather than chasing higher pixel counts. An optimization strategy that should not necessarily result in higher bandwidth requirements, although moving to higher color depth or more brightness / dynamic range (e.g., HDR vs SDR) would lead to a moderate increase in the required data ranges.
A throughput between 50 and 100 Mbps for fixed broadband TV streaming currently provides an optimum viewing experience. Of course, a fixed broadband household may have many concurrent bandwidth demands that would justify a 1 Gbps fiber to the home or maybe even 10 Gbps downstream to serve the whole household at an optimum experience at any time.
Figure 13 provides the data rate ranges for a streaming format, device type, and typical screen size. The data rate required for streaming video content is determined by various factors, including video resolution, frame rate, compression, and screen size. The data rate calculation (in Mbps) for different streaming formats follows a process that involves estimating the amount of data required to encode each frame and multiplying by the frame rate and compression efficiency. The methodology can be found in many places. See also my blog “5G Economics – An Introduction (Chapter 1)” from Dec. 2016.
Let’s move into high-end and fully immersive virtual reality experiences. The user bandwidth requirement may exceed 100 Mbps and possibly even require a Gbps sustainable bandwidth delivered to the user device to provide an optimum experience. However, jitter and latency performance may not make such full immersion or high-end VR experiences fully optimal over mobile or fixed networks with long distances to the supporting (edge) data centers and cloud servers where the related application may reside. In my opinion, this kind of ultra-high-end specialized service might be better run exclusively on location.
Size Matter.
I once had a CFO who was adamant that an organization’s size on its own would drive a certain amount of Capex. I would, at times, argue that an organization’s size should depend on the number of activities required to support customers (or, more generally, the number of revenue-generating units (RGUs), your given company has or expects to have) and the revenue those generate. In my logic, at the time, the larger a country in terms of surface area, population, and households, the more capex-related activities would be required, thus also resulting in the need for a bigger organization. If you have more RGU, it might also not be too surprising that the organization would be bigger.
Since then, I have scratched my head many times when I look at country characteristics, the RGUs, and Revenues, asking how that can justify a given size of Telco organizations, knowing that there are other Telcos out there that spend the same or more Capex with a substantially smaller organization (also after considering the difference in sourcing strategies). I have never been with an organization that irrespective of its size did not feel pressured work-wise and believed it was too lightly staffed to operate, irrespective of the Capex and activities under management.
Figure 14 illustrates the correlation between the Capex and the number of FTEs in a Telco organization. It should be noted that the upper right point results in a very good correlation of 0.75. Without this point, the correlation would be around 0.25. Note that sourcing does have a minor effect on the correlation.
The above figure illustrates a strong correlation between Capex and the number of people in a Telco organization. However, the correlation would be weaker without the upper right data point. In the data shown here, you will find no correlation between FTEs and a country’s size, such as population or surface area, which is also the case for Capex. There is a weak correlation between FTEs and RGU and a stronger correlation with Revenues. Capex, in general, is very strongly correlated with Revenues. The best multi-linear regression model, chosen by p-value, is a model where Capex relates to FTEs and RGUs. For a Telco with 1000 employees and 1 million RGUs, approximately 50% of the Capex could be explained by the number of FTEs. Of course, in the analysis above, we must remember that correlation does not imply causation. You will have telcos that, in most Capex driver aspects, should be reasonably similar in their investment profiles over time, except the telco with the largest organization will consistently invest more in Capex. While I think this is, in particular, an incumbent vs challenger issue, it is a much broader issue in our industry.
Having spent most of my 20+ year career in Telecom being involved in Capex planning and budgeting, it is clear that the size of an organization plays a role in the size of a Capex budget. Intuitively, it should not be too surprising. Suppose the Capex is lower than the capacity of your organization. In that case, you may have to lay off people with the risk you might be short of resources in the future as you may cycle through modernization or a new technology introduction. On the other hand, if the Capex needs are substantially larger than the organization can cope with, including any sourcing agreements in place, it may not make too much sense to ask for more than what can be managed with the resources available (apart from it being sub-optimal for cash flow optimization).
Telco companies that have fixed and mobile broadband infrastructure in their portfolio with organizations that are poorly optimized and with strict demarcation lines between people working on fixed broadband and mobile broadband will, in general, have much worse Capex efficiencies compared to fully fixed-mobile converged organizations (not to mention suffering from poorer operational efficiencies and work practices compared to integrated organizations). Here, the size of, for example, a mobile organization will drive behavior that rather would spend above and beyond Capex in their Radio Access Network infrastructure than use more clever and proven solutions (e.g., Opanga’s RAIN) to optimize quality and capacity needs across their mobile networks.
In general, the resistance to utilize smarter solutions and clever ideas that may save Capex (and/or Opex) is manifesting in a many-fold of behaviors that I have observed over my 25+ year career (and some I might even have adapted on occasion … but shhhh;-).
Budget heuristics:
𝗦𝗶𝘇𝗲 𝗱𝗼𝗲𝘀𝗻𝘁 𝗺𝗮𝘁𝘁𝗲𝗿 𝗽𝗮𝗿𝗮𝗱𝗶𝗴𝗺 Irrespective of size, my organization will always be busy and understaffed.
𝗧𝗵𝗲 𝗚𝗼𝗹𝗱𝗶𝗹𝗼𝗰𝗸𝘀 𝗙𝗮𝗹𝗹𝗮𝗰𝘆 My organization’s size and structure will determine its optimum Capex spending profile, allowing it to stay busy (and understaffed).
𝗧𝗮𝗻𝗴𝗶𝗯𝗹𝗲 𝗕𝗶𝗮𝘀 A hardware (infrastructure-based) solution is better and more visible than a software solution. I feel more comfortable with my organization being busy with hardware.
𝗧𝗵𝗲 𝗦𝘂𝗻𝗸 𝗖𝗼𝘀𝘁 𝗙𝗮𝗹𝗹𝗮𝗰𝘆 I don’t trust (allegedly) clever software solutions that may lower or postpone my Capex needs and, by that, reduce the need for people in my organization.
𝗕𝘂𝗱𝗴𝗲𝘁 𝗠𝗮𝘅𝗶𝗺𝗶𝘇𝗮𝘁𝗶𝗼𝗻 𝗧𝗲𝗻𝗱𝗲𝗻𝗰𝘆 My organization’s importance and my self-importance are measured by how much Capex I have in my budget. I will resist giving part of my budget away to others.
𝗦𝘁𝗮𝘁𝘂𝘀 𝗤𝘂𝗼 𝗕𝗶𝗮𝘀 I will resist innovation that may reduce my Capex budget, even if it may also help reduce my Opex.
𝗝𝗼𝗯 𝗣𝗿𝗼𝘁𝗲𝗰𝘁𝗶𝗼𝗻𝗶𝘀𝗺 I resist innovation that may result in a more effective organization, i.e., fewer FTEs.
𝗖𝗮𝗽𝗮𝗰𝗶𝘁𝘆 𝗖𝗼𝗺𝗳𝗼𝗿𝘁 𝗦𝘆𝗻𝗱𝗿𝗼𝗺𝗲: The more physical capacity I build into my network, the more we can relax. Our goal is a “Zero Worry Network.”
𝗧𝗵𝗲 𝗙𝗲𝗮𝗿 𝗙𝗮𝗰𝘁𝗼𝗿: The leadership is “easy to scare” when arguing for more capacity Capex opposed to the “if-not”-consequences. (e.g., losing best network awards, poorer customer experience, …).
𝗧𝗵𝗲 𝗕𝘂𝗱𝗴𝗲𝘁 𝗜𝗻𝗲𝗿𝘁𝗶𝗮 Return on Investment (ROI) prioritization is rarely considered (rigorously), particularly after a budget has been released.
𝗔 𝘄𝗮𝗿𝗻𝗶𝗻𝗴: although each is observable in the live, the reader should be aware that there is also a fair amount of deliberate ironic provocation in the above heuristics.
We should never underestimate that within companies, two things make you important (including self-important and self-worthy) … It is: (1) The size of your organization and (2) the amount of money, your budget size, you have for your organization to be busy with.
Any innovation that may lower an organization’s size and budget will be met with resistance from that organization.
The Balancing Act of Capex to Opex Transformations.
Telco cost structures and Capex have evolved significantly due to accounting changes, valuation strategies, technological advancements, and economic pressures. While shifts like IFRS (International Financial Reporting Standards), issued by the International Accounting Standards Board (IASB), have altered how costs are reported and managed, changes in business strategies, such as cell site spin-offs, cloud migrations, and the transition to software-defined networks, have reshaped Capex allocations somewhat. At the same time, economic crises and competitive pressures have influenced Telcos to continually reassess their capital investments, balancing the need to optimize value, innovation, and growth with financial diligence.
One of the most significant drivers of change has been the shift in accounting standards, particularly with the introduction of IFRS16, which replaced the older GAAP-based approaches. Under IFRS16, nearly all leases are now recognized on the balance sheet as right-of-use assets and corresponding liabilities. This change has particularly impacted Telcos, which often engage in long-term leases for cell sites, network infrastructure, and equipment. Previously, under GAAP (Generally Accepted Accounting Principles), many leases were treated as operating leases, keeping them off the balance sheet, and their associated costs were considered operational expenditures (Opex). Now, under IFRS16, these leases are capitalized, leading to an increase in reported Capex as assets and liabilities grow to reflect the leased infrastructure. This shift has redefined how Telcos manage and report their Capex, as what was previously categorized as leasing costs now appears as capital investments, altering key financial metrics like EBITDA and debt ratios that would appear stronger post-IFRS16.
Simultaneously, valuation strategies and financial priorities have driven significant shifts in Telco Capex. Telecom companies have increasingly focused on enhancing metrics such as EBITDA and capital efficiency, leading them to adopt strategies to reduce heavy capital investments. One such strategy is the cell site spin-off, where Telcos sell off their tower and infrastructure assets to specialized independent companies or create separate entities that manage these assets. These spin-offs have allowed Telcos to reduce the Capex tied to maintaining physical assets, replacing it with leasing arrangements, which shift costs towards operational expenses. As a result, Capex related to infrastructure declines, freeing up resources for investments in other areas such as technology upgrades, customer services, and digital transformation. The spun-off infrastructures often result in significant cash inflows from sales. The telcos can then use this cash to improve their balance sheets by reducing debt, reinvesting in new technologies, or distributing higher dividends to shareholders. However, this shift may also reduce control over critical network infrastructure and create long-term lease obligations, resulting in substantial operational expenses as telcos will have to pay the rental costs on the spun-off infrastructure, increasing Opex pressure. I regularly see analysts using the tower spin-off as an argument for why Capex requirements of telcos are no longer wholly trustworthy and, in particular, in comparison with the past capital spending as the passive part of the cell site built used to be a substantial share mobile site Capex of up to 50% to 60% for a standard site built and beyond that for special sites. I believe that as not many new cell sites are being built any longer, and certainly not as many as in the 90s and 2000s, this effect is very minor on the overall Capex. Most new sites are built at a maintenance level, covering new residential or white spot areas.
When considering mobile network evolution and the impact of higher frequencies, it is important not to default to the assumption that more cell sites will always be necessary. If all things are equal, the coverage cell range of a high carrier frequency would be shorter (often much shorter) than the coverage range at a lower frequency. However, all things are not equal. This misconception arises from a classical coverage approach, where the frequency spectrum is radiated evenly across the entire cell area. However, modern cellular networks employ advanced technologies such as beamforming, which allows for more precise and efficient distribution of radio energy. Beamforming concentrates signal power in specific directions rather than thinly spreading it across a wide area, effectively increasing reach and signal quality without additional sites. Furthermore, the support for asymmetric downlink (higher) and uplink (lower) carrier frequencies allows for high-quality service downlink and uplink in situations where the uplink might be challenged at higher frequencies.
Moreover, many mobile networks today have already been densified to accommodate coverage needs and capacity demands. This densification often occurred when spectrum resources were scarce, and the solution was to add more sites for improved performance rather than simply increasing coverage. As newer frequency bands become available, networks can leverage beamforming and existing densification efforts to meet coverage and capacity requirements without necessarily expanding the number of cell sites. Thus, the focus should be optimizing the deployment of advanced technologies like beamforming and Massive MIMO rather than increasing the site count by default. In many cases, densified networks are already equipped to handle higher frequencies, making additional sites unnecessary for coverage alone.
The migration to public cloud solutions from, for example, Amazon’s AWS or Microsoft Azure is another factor influencing the Capex of Telcos. Historically, telecom companies relied on significant upfront Capex to build and maintain their own data centers or switching locations (as they were once called, as these were occupied mainly by the big legacy telecom proprietary telco switching infrastructure), network operations centers, and IT (monolithic) infrastructure. However, with the rise of cloud computing, Telcos are increasingly migrating to cloud-based solutions, reducing the need for large-scale physical infrastructure investments. This shift from hardware to cloud services changes the composition of Capex as the need for extensive data center investments declines, and more flexible, subscription-based cloud services are adopted. Although Capex for physical infrastructure decreases, there is a shift towards Opex as Telcos pay for cloud services on a usage basis.
Further, the transition to software-defined networks (SDNs) and software-centric telecom solutions has transformed the nature of Telco Capex. In the past, Telcos heavily depended on proprietary hardware for network management, which required substantial Capex to purchase and maintain physical equipment. However, with the advancement of virtualization and SDNs, telcos have shifted away from hardware-intensive solutions to more software-driven architectures. This transition reduces the need for continuous Capex on physical assets like routers, switches, and servers and increases investment in software development, licensing, and cloud-based platforms. The software-centric model allows, in theory, Telcos to innovate faster and reduce long-term infrastructure costs.
The Role of Capex in Financial Statements.
Capital expenditures play a critical role in shaping a telecommunications company’s financial health, influencing its income statement, balance sheet, and cash flow statements in various ways. At the same time, Telcos establish financial guardrails to manage the impact of Capex spending on dividends, liquidity, and future cash needs.
In the income statement (see Figure 15 below), Capex does not appear directly as an expense when it is incurred. Instead, it is capitalized on the balance sheet and then expensed over time through depreciation (for tangible assets) or amortization (for intangible assets). This gradual recognition of the Capex expenditure leads to higher depreciation or amortization charges over future periods, reducing the company’s net income. While the immediate impact of Capex is not seen on the income statement, the long-term effects can improve revenue when investments enhance capacity and quality, as with technological upgrades like 5G infrastructure. However, these benefits are offset by the fact that depreciation lowers profitability in the short term (as the net profit is lowered). The last couple of radio access technology (RAT) generations have, in general, caused an increase in telcos’ operational expenses (i.e., Opex) as more cell sites are required, heavier site configurations are implemented (e.g., multi-band antennas, massive MiMo antennas), and energy consumption has increased in absolute terms. Despite every new generation having become relatively more energy efficient in terms of the kWh/GB, in absolute terms, this is not the case, and that matters for the income statement and the incurred operational expenses.
Figure 15 illustrates the typical income statement one may find in a telco’s annual report or official financial statements. The purpose here is to show where Capex may have an influence although Capex will not be directly stated in the Income Statement. Note: the numbers in the above financial statement are for illustration only representing a Telco with 35% EBITDA margin, 20% Capex to Revenue Ratio and a Tax rate of 22%.
On the balance sheet (see Figure 16 below), Capex increases the value of a company’s fixed assets, typically recorded as property, plant, and equipment (PP&E). As new assets are added, the company’s overall asset base grows. However, this is balanced by the accumulation of depreciation, which gradually reduces the book value of these assets over time. How Capex is financed also affects the company’s liabilities or equity. If debt is used to finance Capex, the company’s liabilities increase; if equity financing is used, shareholders’ equity increases. The Balance Sheet together with the Depreciation & Amortization (D&A), typically given in the income statement, can help us estimate the amount of Capex a Telco has spend. The capital expense, typically not directly reported in a companies financial statements, can be estimated by adding the changes between subsequent years of PP&E and Intangible Assets to the D&A.
Figure 16 illustrates the balance sheet one may find in a telco’s annual report or official financial statements. The purpose here is to show where Capex may have an influence. Knowing the Depreciation & Amortization (D&A) typically shown in the Income Statement, the change in PP&E and Intangible Assets (between two subsequent years) will provide an estimate of the Capex of the current year. Note: the numbers in the above financial statement are for illustration only representing a Telco with 35% EBITDA margin, 20% Capex to Revenue Ratio and a Tax rate of 22%.
In the cash flow statement, Capex appears as an outflow under the category of cash flows from investing activities, representing the company’s spending on long-term assets. In the short term, this creates a significant reduction in cash. However, well-planned Capex to enhance infrastructure or expand capacity can lead to higher operating cash flows in the future. If Capex is funded through debt or equity issuance, the inflow of funds will be reflected under cash flows from financing activities.
Figure 17 illustrates the Cash Flow Statements one may find in a telco’s annual report or official financial statements (might have a bit more details than what usually would be provided). We would typically get a 70+% impression of a Telco’s Capex level by looking at the “Net Cash Flow Used in Investing Activities”, unless we are offered Purchases of Tangible and Intangible Assets. Note: the numbers in the above financial statement are for illustration only representing a Telco with 35% EBITDA margin, 20% Capex to Revenue Ratio and a Tax rate of 22%.
To ensure Capex does not overly strain the company’s financial health or limit returns to shareholders, Telcos put in place financial guardrails. Regarding dividends, many companies set specific dividend payout ratios, ensuring that a portion of earnings or free cash flow is consistently returned to shareholders. This practice balances returning value to shareholders while retaining sufficient earnings to fund operations and investments. It is also not unusual that Telco’s commit a given dividend level to shareholders, that as a consequence may place a limit on Capex spending or result in Capex tasking within a given planning period, as management must balance cash outflows between shareholder returns and strategic investments. This may lead to prioritizing essential projects, delaying less critical investments, or seeking alternative financing to maintain both Capex and dividend commitments. Additionally, Telcos often use dividend coverage ratios to ensure they can sustain dividend payouts even during periods of heavy capital expenditure.
Some telcos have chosen not to commit dividends to shareholders in order to maximize Capex investments, aiming to reinvest profits into the business to drive long-term growth and create higher shareholder value. This strategy prioritizes network expansion, technological upgrades, and new market opportunities over immediate cash returns, allowing the company to maintain financial flexibility and pursue strategic objectives more aggressively. When a telco decides to start paying dividends, it may indicate that management believes there are fewer high-value investment opportunities that can deliver returns above the company’s cost of capital. The decision to pay dividends often reflects the view that shareholders may derive greater value from the cash than the company could generate by reinvesting it. Often it signals a shift to a higher degree of maturity (e.g., corporate or market wise) from having been a growth focused company (i.e., the Telco has past the inflection point of growth). An example of maturity, and maybe less about growth opportunities, is the case of T-Mobile USA which in 2024 announced that it would start to pay dividend for the first time in its history targeting a 10 percent annually per share (note: Deutsche Telekom AG gained ownership in 2001, the company was founded in 1994).
Liquidity management is another consideration. Companies monitor their liquidity through current or quick ratios to ensure they can meet short-term obligations without cutting dividends or pausing important Capex projects. To provide an additional safety net, Telcos often maintain cash reserves or access to credit lines to handle immediate financial needs without disrupting long-term investment plans.
Regarding debt management, Telcos must carefully balance using debt to finance Capex. Companies often track their debt-to-equity ratio to avoid over-leveraging, which can lead to higher interest expenses and reduced financial flexibility. Another common metric is net debt to EBITDA, which ensures that debt levels remain manageable concerning the company’s earnings. To avoid breaching agreements with lenders, Telcos often operate under covenants that limit the amount they can spend on Capex without negatively affecting their ability to service debt or pay dividends.
Telcos also plan long-term cash flow to ensure Capex investments align with future financial needs. Many companies establish a capital allocation framework that prioritizes projects with the highest returns, ensuring that investments in infrastructure or technology do not jeopardize future cash flow. Free cash flow (FCF) is a particularly important metric in this context, as it represents the amount of cash available after covering operating expenses and Capex. A positive FCF ensures the company can meet future cash needs while returning value to shareholders through dividends or share buybacks.
Capex budgeting and prioritization are also essential tools for managing large investments. Companies assess the expected return on investment (ROI) and the payback period for Capex projects, ensuring that capital is allocated efficiently. Projects with assumed high strategic value, such as 5G infrastructure upgrades, household fiber coverage, or strategic fiber overbuilt, are often prioritized for their potential to drive long-term revenue growth. Monitoring the Capex-to-sales ratio helps ensure that capital investments are aligned with revenue growth, preventing over-investment in infrastructure that may not yield sufficient returns.
CAPEX EXPECTATIONS 2024 to 2026.
Considering all of the 54 telcos, ignoring MasMovil and WindHellas that are in the process of being integrated, in the pool of New Street Research Quarterly review each with their individual as well as country “peculiarities” (e.g., state of 5G deployment, fiber-optical coverage, fiber uptake, merger-resulting integration Capex, general revenue trends, …), it is possible to get a directional idea of how Capex will develop for each individual telco as well as the overall trend. This is illustrated in the Figure below on a Western European level.
I expect that we will not see a Capex reduction in 2024, supported by how Capex in the third and fourth quarters usually behave compared to the first two quarters, and due to integration and transformation Capex that will carry from 2023 into 2024 and possibly with a tail-end in 2024. I expect most telcos will cut back on new mobile investments, even if some might start ripping out radio access infrastructure from Chinese suppliers. However, I also believe that telcos will try to delay replacement to 2026 to 2028, when the first round of 5G modernization activities would be expected (and even overdue for some countries).
While 5G networks have made significant advancements, the rollout of 5G SA remains limited. By the end of 2023, only five of 39 markets analyzed by GSMA have reached near-complete adoption of 5G SA networks. 17 markets had yet to launch 5G SA at all. One of the primary barriers is the high cost of investment required to build the necessary infrastructure. The expansion and densification of 5G networks, such as installing more base stations, are essential to support 5G SA. According to GSMA, many operators are facing financial hurdles, as returns in many markets have been flat, and any increase is mainly due to inflationary price corrections rather than incremental or new usage occurring. I suspect that telcos may also be more conservative (and even more realistic, maybe) in assessing the real economic potential of the features being enabled by migrating to 5G SA, e.g., advanced network slicing, ultra-low latency, and massive IoT capabilities in comparison with the capital investments and efforts that they would need to incur. I should point out that any core network investments supporting 5G SA would not be expected to have a visible impact on telcos Capex budgets as this would be expected to be less than 10% of the mobile capex.
Figure 18 shows the 2022 status of homes covered by fiber in 16 Western European countries, as well as the number of households remaining. It should be noted that a 100% coverage level may be unlikely, and this data does not consider fiber overbuilt (i.e., multiple companies covering the same households with their individual fiber deployments). Fiber overbuilt becomes increasingly likely as the coverage exceeds 80% (on a geographical regional/city basis). The percentages (yellow color) above the chart show the share of Total 2022 Western European Capex for the country, e.g., Germany’s share of the 2022 Capex was 18% and had ca. 19% of all German households covered with fiber. Source: based on Omdia & Point Topic’s “Broadband Coverage in Europe 2013-2022” (EU Commission Report).
In 2022, a bit more than 50% of all Western European households were covered by fiber (see Figure 18 above), which amounts to approximately 85 million households with fiber coverage. This also leaves approximately 80 million households without fiber reach. Almost 60% of households without fiber coverage are in Germany (38%) and the UK (21%). Both Germany and the UK contributed about 40% of the total Western European Capex spend in 2022.
Moreover, I expect there are still Western European markets where the Capex priority is increasing the fiber-optic household coverage. In 2022, there was a peak in new households covered by fiber in Western Europe (see Figure 15 below), with 13+ million households covered according to the European Commission’s report “Broadband Coverage in Europe 2013-2022“. Germany (a fiber laggard) and the UK, which account for more than 35% of the Western European Capex, are expected to continue to invest substantially in fiber coverage until the end of the decade. As Figure 19 below illustrates, there is still a substantial amount of Capex required to close the fixed broadband coverage gap some Western European countries have.
Figure 19 illustrates the number of households covered by fiber (homes passed) and the number of millions of new households covered in a year. The period from 2017 to 2022 is based on actuals. The period from 2023 to 2026 is forecasted for new households covered based on the last 5-year average deployment or the maximum speed over the last 5 years (Urban: e.g., DE, IT, NL, UK,…) with deceleration as coverage reaches 95% for urban areas and 80% for rural (note: may be optimistic for some countries). The fiber deployment model differentiates between Urban and Rural areas. Source: based on Omdia & Point Topic’s “Broadband Coverage in Europe 2013-2022” (EU Commission Report).
I should point out that I am not assuming that telcos would be required over the next couple of years to swap out Chinese suppliers outside the scope of the European Commission “The EU 5G Toolkit for Security” framework that mainly focuses on 5G mobile networks eventually including the radio access network. It should be kept in mind that there is a relatively big share of high-risk suppliers within the Western European (actually in most European Union member states) fixed broadband networks (e.g., core routers & switches, SBCs, OLT/ONTs, MSAPs) that if subjected to “5G Toolkit for Security”-like regulation, such as in effect in Denmark (i.e., “The Danish Investment Screening Act”), would result in substantial increase in telcos fixed capital spend. We may see that some Western European telcos will commence replacement programs as equipment becomes obsolete (or near obsolete), and I would expect that the fixed broadband Capex will remain relatively high for telcos in Western Europe even beyond 2026.
Thus, overall, I think it is not unrealistic to anticipate a decrease in Capex over the next 3 years. Contrary to some analysts’ expectations, I do not see the lower Capex level being persistent but rather what to expect due to the reasons given above in this blog.
Figure 20 illustrates the pace and financial requirements for fiber-to-the-premises (FTTP) deployment across the EU, emphasizing the significant challenges ahead. Germany needs the highest number of households passed per week and the largest investments at €32.9 billion to reach 80% household coverage by 2031. The total investment required to reach 80% household fiber coverage by 2031 is estimated at over €110 billion, with most of this funding allocated to urban areas. Despite progress, more than 57% of Western European households still lack fiber coverage as of 2022. Achieving this goal will require maintaining the current pace of deployment and overcoming historical performance limitations. Source: based on Omdia & Point Topic’s “Broadband Coverage in Europe 2013-2022” (EU Commission Report).
CAPEX EXPECTATIONS TOWARDS 2030.
Taking the above Capex forecasting approach, based on the individual 54 Western European telcos in the New Street Research Quarterly review, it is relatively straightforward, but not per se very accurate, to extend to 2030, as shown in the figure below.
It is worth mentioning that predicting Capex’s reliability over such a relatively long period of ten years is prone to a high degree of uncertainty and can actually only be done with relatively high reliability if very detailed information is available on each telco’s long-term, short-term and strategy as well as their economic outlook. In my experience from working with very detailed bottom-up Capex models covering a five and beyond-year horizon (which is not the approach I have used here simply for lack of information required for such an exercise not to be futile), it is already prone to a relatively high degree of uncertainty even with all the information, solid strategic outlook, and reasonable assumptions up front.
Figure 21 illustrates Western Europe’s projected capital expenditure (Capex) development from 2020 to 2030. The slight increase in Capex towards 2030 is primarily driven by the modernization of 5G radio access networks (RAN), which could potentially incorporate 6G capabilities and further deploy 5G Standalone (SA) networks. Additionally, there is a focus on swapping out high-risk suppliers in the mobile domain and completing heavy fiber household coverage in the remaining laggard countries. Suppose the European Commission’s 5G Security Toolkit should be extended to fixed broadband networks, focusing on excluding high-risk suppliers in the 5G mobile domain. In that case, this scenario has not been factored into the current model represented here. The percentages on the chart represent the overall Capex to Total Revenue ratio development over the period.
The capital expenditure trends in Western Europe from 2020 to 2030, with projections indicating a steady investment curve (remember that this is the aggregation of 54 Western European telcos Capex development over the period).
A noticeable rise in Capex towards 2030 can be attributed to several key factors, primarily the modernization of 5G Radio Access Networks (RAN). This modernization effort will likely include upgrades to the current 5G infrastructure and potential integration of 6G (or renamed 5G SA) capabilities as Europe prepares for the next generation of mobile technology, which I still believe is an unavoidable direction. Additionally, deploying or expanding 5G Standalone (SA) networks, which offer more advanced features such as network slicing and ultra-low latency, will further drive investments.
Another significant factor contributing to the increased Capex is the planned replacement of high-risk suppliers in the mobile domain. Countries across Western Europe are expected to phase out network equipment from suppliers deemed risky for national security, aligning with broader EU efforts to ensure a secure telecommunications infrastructure. I expect a very strong push from some member state regulators and the European Commission to finish the replacement by 2027/2028. I also expect impacted telcos (of a certain size) to push back and attempt to time a high-risk supplier swap out with their regular mobile infrastructure obsolescence program and introduction of 6G in their networks towards and after 2030.
Figure 22 shows the projections for 2023 and 2030 for the number of homes covered by fiber in Western European countries and the number of households remaining. It should be noted that a 100% coverage level may be unlikely, and this data does not consider fiber overbuilt (i.e., multiple companies covering the same households with their individual fiber deployments). Fiber overbuilt becomes increasingly likely as the coverage exceeds 80% (on a geographical regional/city basis). Source: based on Omdia & Point Topic’s “Broadband Coverage in Europe 2013-2022” (EU Commission Report).
Simultaneously, Western Europe is expected to complete the extensive rollout of fiber-to-the-home (FTTH) networks, as illustrated by Figure 20 above, particularly in countries lagging behind in fiber deployment, such as Germany, the UK, Belgium, Austria, and Greece. These EU member states will likely have finished covering the majority of households (80+%) with high-speed fiber by the end of the decade. On this topic, we should remember that telcos are using various fiber deployment models that minimize (and optimize) their capital investment levels. By 2030 I would expect that almost 80% of all Western European households will be covered with fiber and thus most consumers and businesses will have easy access to gigabit services to their homes by then (and for most countries long before 2030). Germany is still expected to be the Western European fiber laggard by 20230, with an increased share of 50+% of German households not being covered by fiber (note: in 2022, this was 38%). Most other countries will have reached and exceeded 80% fiber household coverage.
It is also important to note that my Capex model does not assume the extension of the European Commission’s 5G Security Toolkit, which focuses on excluding high-risk suppliers in the 5G domain to fixed broadband networks. If the legal framework were to be applied to the fixed broadband sector as well, an event that I see to be very likely, forcing the removal of high-risk suppliers from fiber broadband networks, Capex requirements would likely increase significantly beyond the projections represented in my assessment with the last years of the decade focused on high-risk supplier replacement in Western European Telcos fixed broadband transport and IP networks. While it is I don’t see a (medium-high) risk that all CPEs would be included in a high-risk supplier ban. However, I do believe that CPEs with the ONT integrated may be required to replace their installed CPE base. If a high-risk supplier ban were to include the ONT, there would be several implications.
Any CPEs that use components from the banned supplier would need to be replaced or retrofitted to ensure compliance. This would require swapping the integrated CPE/ONT units for separate CPE and ONT devices from approved suppliers, which could add to installation costs and increase deployment time. Service providers would also need to reassess their network equipment supply chain, ensuring that new ONTs and CPEs meet regulatory standards for security and compliance. Moreover, replacing equipment could potentially disrupt existing service, necessitating careful planning to manage the transition without major outages for customers. This situation would likely also require updates to the network configuration, as replacing an integrated CPE/ONT device could involve reconfiguring customer devices to work seamlessly with the new setup. I believe it is very likely that telcos eventually will offer fixed broadband service, including CPEs and home gateways, that are free of high-risk suppliers end-2-end (e.g., for B2B and public institutions, e.g., defense and other critically sensitive areas). This may extend to requirements that employees working in or with sensitive areas will need a certificate of high-risk supplier-free end-2-end fixed broadband connection to be allowed to work from home or receive any job-related information (this could extend to mobile devices as well). Again, substantial Capex (and maybe a fair amount of time as well) would be required to reach such a high-risk supplier reduction.
AN ALTERNATE REALITY.
I am unsure whether William Webb’s idea of “The End of Telecoms History” (I really recommend you get his book) will have the same profound impact as Francis Fukuyama’s marvelously thought-provoking book “The End of History and the Last Man“ or be more “right” than Fukuyama’s book. However, I think it may be an oversimplification of his ideas to say that he has been proven wrong. The world of Man may have proven more resistant to “boredom” than the book assumed (as Fukuyama conceded in subsequent writing). Nevertheless, I do not believe history can be over unless the history makers and writers are all gone (which may happen sooner rather than later). History may have long and “boring” periods where little new and disruptive things happen. Still, historically, something so far has always disrupted the hiatus of history, followed by a quieter period (e.g., Pax Romana, European Feudalism, Ming Dynasty, 19th century’s European balance of power, …). The nature of history is cyclic. Stability and disruption are not opposing forces but part of an ongoing dynamic. I don’t think telecommunication would be that different. Parts of what we define as telecom may reach a natural end and settle until it is disrupted again; for example, the fixed telephony services on copper lines were disrupted by emerging mobile technologies driven by radio access technology innovation back in the 90s and until today. Or, like circuit-switched voice-centric technologies, which have been replaced by data-centric packet-switched technologies, putting an “end” to the classical voice-based business model of the incumbent telecommunication corporations.
At some point in the not-so-distant future (2030-2040), all Western European households will be covered by optical fiber and have a fiber-optic access connection with indoor services being served by ultra-WiFi coverage (remember approx. 80% of mobile consumption happens indoors). Mobile broadband networks have by then been redesigned to mainly provide outdoor coverage in urban and suburban areas. These are being modernized at minimum 10-year cycles as the need for innovation is relatively minor and more focused on energy efficiency and CO2 footprint reductions. Direct-to-cell (D2C) LEO satellite or stratospheric drone constellations utilizing a cellular spectrum above 1800 MHz serve outdoor coverage of rural regions, as opposed to the current D2C use of low-frequency bands such as 600 – 800 MHz (as higher frequency bands are occupied terrestrially and difficult to coordinate with LEO Satellite D2C providers). Let’s dream that the telco IT landscape, Core, transport, and routing networks will be fully converged (i.e., no fixed silo, no mobile silo) and autonomous network operations deal with most technical issues, including planning and optimization.
In this alternate reality, you pay for and get a broadband service enabled by a fully integrated broadband network. Not a mobile service served by a mobile broadband network (including own mobile backhaul, mobile aggregation, mobile backbone, and mobile core), and, not a fixed service served by a fixed broadband network different from the mobile infrastructure.
Given the Western European countries addressed in this report (i.e., see details in Further Reading #1), we would need to cover a surface area of 3.6 million square kilometers. To ensure outdoor coverage in urban areas and road networks, we may not need more than about 50,000 cell sites compared to today’s 300 – 400 thousand. If the cellular infrastructure is shared, the effective number of sites that are paid in full would be substantially lower than that.
The required mobile Capex ballpark estimate would be a fifth (including its share of related fixed support investment, e.g., IT, Core, Transport, Switching, Routing, Product development, etc.) of what it otherwise would be if we continue “The Mobile History” as it has been running up to today.
In this “Alternate Reality” ” instead of having a mobile Capex level of about 10% of the total fixed and mobile revenue (~15+% of mobile service revenues), we would be down to between 2% and 3% of the total telecom revenues (assuming it remains reasonably flat at a 2023 level. The fixed investment level would be relatively low, household coverage would be finished, and most households would be connected. If we use numbers of fixed broadband Capex without substantial fiber deployment, that level should not be much higher than 5% of the total revenue. Thus, instead of today’s persistent level of 18% – 20% of the total telecom revenues, in our “Alternate Reality,” it would not exceed 10%. And just imagine what such a change would do to the operational cost structure.
Obviously, this fictive (and speculative) reality would be “The End of Mobile History.”
It would be an “End to Big Capex” and a stop to spending mobile Capex like there is no (better fixed broadband) tomorrow.
This is an end-reflection of where the current mobile network development may be heading unless the industry gets better at optimizing and prioritizing between mobile and fixed broadband. Re-architecting the fundamental design paradigms of mobile network design, plan, and build is required, including an urgent reset of current 6G thinking.
ACKNOWLEDGEMENT.
I greatly acknowledge my wife, Eva Varadi, for her support, patience, and understanding during the creative process of writing this Blog. There should be no doubt that without the support of Russell Waller (New Street Research), this blog would not have been possible. Thank you so much for providing the financial telco data for Western Europe that lays the ground for much of the Capex analysis in this article. This blog has also been published in telecomanalysis.net with some minor changes and updates.
FURTHER READING.
New Street Research covers the following countries in their Quarterly report: Austria, Belgium, Denmark, Finland, France, Germany, Greece, Italy, Netherlands, Norway, Portugal, Spain, Sweden, Switzerland, and the United Kingdom. Across those 15 countries, ca. 56 telcos are covered.
Rupert Wood, “A crisis of overproduction in bandwidth means that telecoms capex will inevitably fall,” Analysys Mason (July 2024). A rather costly (for mortals & their budgets, at least) report called “The end of big capex: new strategic options for the telecoms industry”allegedly demonstrates the crisis.
Danish Investment Screening Act, “Particularly sensitive sectors and activities,” Danish Business Authority, (July 2021). Note that the “Danish Investment Screening Act” is closely aligned with broader European Union (EU) frameworks and initiatives to safeguard critical infrastructure from high-risk foreign suppliers. The Act reflects Denmark’s effort to implement national and EU-level policies to protect sensitive sectors from foreign investments that could pose security risks, particularly in critical infrastructure such as telecommunications, energy, and defense.
German press on high-risk suppliers in German telecommunications networks: “Zeit für den Abschied von Huawei, sagt Innenministerin Faeser” (Handelsblatt, August 18, 2023), “Deutsche Telekom und Huawei: Warum die Abhängigkeit bleibt” (Die Welt, September 7, 2023), “Telekom-Netz: Kritik an schleppendem Rückzug von Huawei-Komponenten” (Der Spiegel, September 20, 2023), “Faeser verschiebt Huawei-Bann und stößt auf heftige Kritik” (Handelsblatt, July 18, 2024), “Huawei-Verbot in 5G-Netzen: Deutschland verschärft, aber langsam” (Tagesschau, July 15, 2024), and “Langsame Fortschritte: Deutschland und das Huawei-Dilemma” (Der Spiegel, September 21, 2024) and many many others.
Kim Kyllesbech Larsen, “Capacity planning in mobile data networks experiencing exponential growth in demand” (April 2012). See slide 5, showing that 50% of all data traffic is generated in 1 cell, 80% of data traffic is carried in up to 3 cells, and only 20% of traffic can be regarded as truly mobile. The presentation has been viewed more than 19 thousand times.
Opanga, “The RAIN AI Platform”, provides a cognitive AI-based solution that addresses (1) Network Optimization lowering Capex demand and increasing the Customer Experience, (2) Energy Reduction above and beyond existing supplier solutions leading to further Opex efficiencies, and (3) Network Intelligence using AI to better manage your network data at a much higher resolution than is possible with classical dashboard applied to technology-driven data lakes.
The securitization of the Arctic involves key players such as Greenland (The Polar Bear), Denmark, the USA (The Eagle), Russia (The Brown Bear), and China (The Red Dragon), each with strategic interests in the region. Greenland’s location and resources make it central to geopolitical competition, with Denmark ensuring its sovereignty and security. Greenland’s primary allies are Denmark, the USA, and NATO member countries, which support its security and sovereignty. Unfriendly actors assessed to be potential threats include Russia, due to its military expansion in the Arctic, and China, due to its strategic economic ambitions and influence in the region. The primary threats to Greenland include military tensions, sovereignty challenges, environmental risks, resource exploitation, and economic dependence. Addressing these threats requires a balanced, cooperative approach to ensure regional stability and sustainability.
Cold winds cut like knives, Mountains rise in solitude, Life persists in ice. (Aqqaluk Lynge, “Harsh Embrace” ).
I have been designing, planning, building, and operating telecommunications networks across diverse environmental conditions, ranging from varied geographies to extreme climates. I sort of told myself that I most likely had seen it all. However (and luckily), the more I consider the complexities involved in establishing robust and highly reliable communication networks in Greenland, the more I realize the uniqueness and often extreme challenges involved with building & maintaining communications infrastructures there. The Greenlandic telecommunications incumbent Tusass has successfully built a resilient and dependable transport network that connects nearly every settlement in Greenland, no matter how small. They manage and maintain this network amidst some of the most severe environmental conditions on the planet. The staff of Tusass is fully committed to ensuring connectivity for these remote communities, recognizing that any service disruption can have severe repercussions for those living there.
As an independent board member of Tusass Greenland since 2022, I have witnessed Tusass’s dedication, passion, and understanding of the importance of improving and maintaining their network and connections for the well-being of all Greenlandic communities. To be clear, the opinions I express in this post are solely my own and do not necessarily reflect the views or opinions of Tusass. I believe that my opinions have been shaped by my Tusass and Greenlandic experience, by working closely with Tusass as an independent board member, and by a deep respect for Tusass and its employees. All information that I am using in this post is publicly available through annual reports (of Tusass) or, in general, publicly available on the internet.
Figure 1 Illustrating a coastal telecommunications site supporting the microwave long-haul transport network of Tusass up along the Greenlandic west coast. Courtesy: Tusass A/S (Greenland).
Greenland’s strategic location, its natural resources, environmental significance, and broader geopolitical context make it geopolitically a critical country. Thus, protecting and investing in Greenland’s critical infrastructure is obviously important. Not only from a national and geopolitical security perspective but also with respect to the economic development and stability of Greenland and the Arctic region. If a butterfly’s movements can cause a hurricane, imagine what an angry “polar bear” will do to the global weather and climate. The melting ice caps are enabling new shipping routes and making natural resources much more accessible, and they may also raise the stakes for regional security. For example, with China’s Polar Silk Road initiative where, China seeks to establish (or at least claim) a foothold in the Arctic in order to increase its trade routes and access to resources. This is also reflected in their 2018 declaration stating that China sees itself as a “Near-Arctic State” and concludes that China is one of the continental states that are closest to the Arctic Circle. Russia, which is a real neighboring country to the Arctic region and Circle, has also increased its military presence and economic activities in the Arctic. Recently, Russia has made claims in the Arctic to areas that overlap with what Denmark and Canada see as their natural territories, aiming to secure its northern borders and exploit the region’s resources. Russia has also added new military bases and has conducted large-scale maneuvers along its own Arctic coastline. The potential threats from increased Russian and Chinese Arctic activities pose significant security concerns. Identifying and articulating possible threat scenarios to the Arctic region involving potential hostile actors may indeed justify extraordinary measures and also highlight the need for urgent and substantial investments in and attention to Greenland’s critical infrastructure.
In this article, I focus very much on what key technologies should be considered, why specific technologies should be considered, and how those technologies could be implemented in a larger overarching security and defense architecture driving towards enhancing the safety and security of Greenland:
Leapfrog Quality of Critical Infrastructure: Strengthening the existing critical communications infrastructure should be a priority. With Tusass, this is the case in terms of increasing the existing transport network’s reliability and availability by adding new submarine cables and satellite backbone services and the associated satellite infrastructure. However, the backbone of the Tusass economy is a population of 57 thousand. The investments required to quantum leap the robustness of the existing critical infrastructure, as well as deploying many of the technologies discussed in this post, will not have a positive business case or a reasonable return on investment within a short period (e.g., a couple of years) if approached in the way that is the standard practice for most private corporations around the worlds. External subsidies will be required. The benefit evaluation would need to be considered over the long term, more in line with big public infrastructure projects. Most of these critical infrastructure and technology investments discussed are based on particular geopolitical assumptions and serve as risk-mitigating measures with substantial civil upside if we maintain a dual-use philosophy as a boundary condition for those investments. Overall I believe that a positive case might be made from the perspective of the possible loss of not making them rather than a typical gain or growth case expected if an investment is made.
Smart Infrastructure Development: Focus on building smart infrastructure, integrating sensor networks (e.g., DAS on submarine cables), and AI-driven automation for critical systems like communication networks, transportation, and energy management to improve resilience and operational efficiency. As discussed in this post, Tusass already has a strong communications network that should underpin any work on enhancing the Greenlandic defense architecture. Moreover, Tusass are experts in building and operating critical communications infrastructures in the Arctic. This is critical know-how that should be heavily relied upon in what has to come.
Automated Surveillance and Monitoring Systems: Invest in advanced automated surveillance technologies, such as aquatic and aerial drones, satellite-based monitoring (SIGINT and IMINT), and IoT sensors, to enhance real-time monitoring and protection of Greenland.
Autonomous Defense Systems: Deploy autonomous systems, including unmanned aerial vehicles (UAVs) and unmanned underwater vehicles (UUVs), to strengthen defense capabilities and ensure rapid response to potential threats in the Arctic region. These systems should be the backbone of ad-hoc private network deployments serving both defense and civilian use cases.
Cybersecurity and AI Integration: Implement robust cybersecurity measures and integrate artificial intelligence to protect critical infrastructure and ensure secure, reliable communication networks supporting both military and civilian applications in Greenland.
Dual-Use Infrastructure: Prioritize investments in infrastructure solutions that can serve both military and civilian purposes, such as communication networks and transportation facilities, to maximize benefits and resilience.
Local Economic and Social Benefits: Ensure that defense investments support local economic development by creating new job opportunities and improving essential services in Greenland.
I believe that Greenland needs to build a solid Greenlandic-centered know-how on a foundational level around autonomous and automated systems. In order to get there Greenland will need close and strong alliances that is aligned with the aim of achieving a greater degree of independence through clever use of the latest technologies available. Such local expertise will be essential in order to reduce the dependency on external support (e.g., from Denmark and Allies) and ensure that they can maintain operational capabilities independently, particularly during a security crisis. Automation, enabled by digitization and AI-enabled system architectures, would be key to managing and monitoring Greenland’s remote and inaccessible geography and resources efficiently and securely, minimizing the need for extensive human intervention. Leveraging autonomous defense and surveillance technologies and stepping up in digital maturity is an important path to compensating for Greenland’s small population. Additionally, implementing robust, with respect to hardware AND software, automated systems will allow Greenland to protect and maintain its critical infrastructure and services, mitigating the risks associated with (too much) reliance on Denmark or allies during a time of crisis where such resources may be scarce or impractical to timely move to Greenland.
Figure 2 A view from Tusass HQ over Nuuk, Greenland. Courtesy: Tusass A/S (Greenland).
GREENLAND – A CONCISE INTRODUCTION.
Greenland, or Kalaallit Nunaat as it is called in Greenlandic, has a surface area of about 2.2 million square kilometers with ca. 80% covered by ice and is the world’s largest island. It is an autonomous territory of Denmark with a population of approximately 57 thousand. Its surface area is comparable to that of Alaska (1.7 million km2) or Saudi Arabia (2.2 million km2). It is predominantly covered by ice, with a population scattered in smaller settlements along the western coastlines where the climate is milder and more hospitable. Greenland’s extensive coastline measures ca. 44 thousand kilometers and is one of the most remote and sparsely populated coastlines in the world. This remoteness contrasts with more densely populated and developed coastlines like the United States. The remoteness of Greenland’s coastline is further emphasized by a lack of civil infrastructure. There are no connecting roads between settlements, and most (if not all) travel between communities relies on maritime or air transport.
Greenland’s coastline presents several unique security challenges due to its particularities, such as its vast length, rugged terrain, harsh climate, and limited population. These factors make Greenland challenging to monitor and protect effectively, which is critical for several reasons:
The vast and inaccessible terrain.
Harsh climate and weather conditions.
Sparse population and limited infrastructure.
Maritime and resource security challenges.
Communications technology challenges.
Geopolitical significance.
The capital and largest city is Nuuk, located on the southwestern coast. With a population of approximately 18+ thousand or 30+% of the total, Nuuk is Greenland’s administrative and economic center, offering modern amenities and serving as the hub for the island’s limited transportation network. Sisimiut, north of Nuuk on the western coast. It is the second-largest town in Greenland, with a population of around 5,500+. Sisimiut is known for its fishing industry and serves as a base for much of the Greenlandic tourism and outdoor activities.
On the remote and inhospitable eastern coast, Tasiilaq is the largest town in the Ammassalik area, with a population of little less than 2,000. It is relatively isolated compared to the western settlements and is known for its breathtaking natural scenery and opportunities for adventure tourism (check out https://visitgreenland.com/ for much more information). In the far north, on the west coast, we have Qaanaaq (also known as Thule), which is one of the world’s most northern towns, with a population of ca. 600. Located near Qaanaaq, is the so-called Pituffik Space Base which is the United States’ northernmost military base, established in 1951, and a key component of NATO’s early warning and missile defense systems. The USA have had a military presence in Greenland since the early days of the World War II and strengthened during the Cold War. It also plays an important role in monitoring Arctic airspace and supporting the region’s avionics operations.
As of 2023, Greenland has approximately 56 inhabited settlements. I am using the word “settlement” as an all-inclusive covering communities with a population of 10s of thousands (Nuuk) down to 100s or lower. With few exceptions, there are no settlements with connecting roads or any other overland transportation connections with other settlements. All person- and goods transportation between the different settlements is taken by plane or helicopter (provided by Air Greenland) or seaborne transportation (e.g., Royal Artic Line, RAL).
Greenland is rich in natural resources. Apart from water (for hydropower), this includes significant mining, oil, and gas reserves. These natural resources are largely untapped and present substantial opportunities for economic development (and temptation for friendly as well as unfriendly actors). Greenland is believed to have one of the world’s largest deposits of rare earth elements (although by far not comparable to China), extremely valuable as an alternative to the reliance of China and critical for various high-tech applications, including electronics (e.g., your smartphone), renewable energy technologies (e.g., wind turbines and EVs), and defense systems. Graphite and platinum are also present in Greenland and are important in many industrial processes. Some estimates indicate that northeast Greenland’s waters could hold large reserves of (yet) undiscovered oil and gas reserves. Other areas are likewise believed to contain substantial hydrocarbon reserves. However, Greenland’s arctic environment presents severe exploration and extraction challenges, such as extreme cold, ice cover, and remoteness, that so far has made it also very costly and complicated to extraxt its natural resources. With the global warming the economical and practical barrier for exploitation is contineously reducing.
FROM STRATEGIC OUTPOST TO ARCTIC STRONGHOLD: THE EVOLVING SECURITY SIGNIFICANCE OF GREENLAND.
Figure 3 illustrates Greenland’s reliance on and the importance of critical communications infrastructure connecting local communities as well as bridging the rest of the world and the internet. Courtesy: DALL-E.
From a security perspective Greenland has evolved significantly since the Second World War. During World War II, its importance was primarily based on its location as a midway point between North America and Europe serving as a refueling and weather station for allied aircrafts crossing the Atlantic to and from Europe. Additionally, its remote geographical location combined with its harsh climate provided a “safe haven” for monitoring and early warning installations.
During the Cold War era, Greenland’s importance grew (again) due to its proximity to the Soviet Union (and Russia today). Greenland became a key site for early warning radar systems and an integral part of the North American Aerospace Defense Command (NORAD) network designed to detect Soviet bombers and missiles heading toward North America. In 1951, the USA-controlled Thule Air Base, today it is called Pituffik Space Base, located in northwest Greenland, was constructed with the purpose of hosting long-range bombers and providing an advanced point (from a USA perspective) for early warning and missile defense systems.
As global tensions eased in the post-Cold War period, Greenland’s strategic status diminished somewhat. However, its status is now changing again due to Russia’s increased aggression in Europe (and geopolitically) and a more assertive China with expressed interest in the Arctic. The arctic ice is melting due to climate change and has resulted in new maritime routes being possible, such as the Northern Sea Route. Also, making Arctic resources more accessible. Thus, we now observe an increased interest from global powers in the Arctic region. And as was the case during the cold-War period (maybe with much higher stakes), Greenland has become strategically critical for monitoring and controlling these emerging routes, and the Arctic in general. Particularly with the observed increased activity and interest from Russia and China.
Greenland’s position in the North Atlantic, bridging the gap between North America and Europe, has become a crucial spot for monitoring and controlling the transatlantic routes. Greenland is part of the so-called Greenland-Iceland-UK (GIUK) Gap. This gap is a critical “chokepoint” for controlling naval and submarine operations, as was evident during the Second World War (e.g., read up on the Battle of the Atlantic). Controlling the Gap increases the security of maritime and air traffic between the continents. Thus, Greenland has again become a key component in defense strategies and threat scenarios envisioned and studied by NATO (and the USA).
GREENLANDS GEOPOLITICAL ROLE.
Greenland’s recent significance in the Arctic should not be underestimated. It arises, in particular, from climate change and, as a result, melting ice caps that have and will enable new shipping routes and potential (easier) access to Greenland’s untapped natural resources.
Greenland hosts critical military and surveillance assets, including early warning radar installations as well as air & naval bases. These defense assets actively contributes to global security and is integral to NATO’s missile defense and early warning systems. They provide data for monitoring potential missile threats and other aerial activities in the North Atlantic and Arctic regions. Greenland’s air and naval bases also support specialized military operations, providing logistical hubs for allied forces operating in the Arctic and North Atlantic.
From a security perspective, Greenland’s control is not only about monitoring and defense. It is also about deterring potential threats from potential hostile actors. It allows for effective monitoring and defense of the Arctic and North Atlantic regions. Enabling the detection and tracking of submarines, ships, and aircraft. Such capabilities enhance situational awareness and operational readiness, but more importantly, it sends a message to potential adversaries (e.g., maybe unaware, as unlikely as it may be, about the deficiencies of Danish Arctic patrol ships). The ability to project power and maintain a military presence in this area is necessary for deterring potential adversaries and protecting he critical communications infrastructure (e.g., submarine cables), maritime routes, and airspace.
The strategic location of Greenland is key to contribute to the global security dynamics. Ensuring Greenland’s security and stability is essential for also maintaining control over critical transatlantic routes, monitoring Arctic activities, and protecting against potential threats from hostile actors. Making Greenland a cornerstone of the defense infrastructure and an essential area for geopolitical strategy in the North Atlantic and Arctic regions.
INFRASTRUCTURE RECOMMENDATIONS.
Recent research has focused on Greenland in the context of Arctic security (see “Greenland in Arctic Security: (De)securitization Dynamics under Climatic Thaw and Geopolitical Freeze” by M. Jacobsen et al.). The work emphasizes the importance of maintaining and enhancing surveillance and early warning systems. Greenland is advised to invest in advanced radar systems and satellite monitoring capabilities. These systems are relevant for detecting potential threats and providing timely information, ensuring national and regional security. I should point to the following traditional academic use of the word “securitization,” particularly from the Copenhagen School, which refers to framing an issue as an existential threat requiring extraordinary measures. Thus, securitization is the process by which topics are framed as matters of security that should be addressed with urgency and exeptional measures.
The research work furthermore underscores the Greenlandic need for additional strategic infrastructure development, such as enhancing or building new airport facilities and the associated infrastructure. This would for example include expanding and upgrading existing airports to improve connectivity within Greenland and with external partners (e.g., as is happening with the new airport in Nuuk). Such developments would also support economic activities, emergency response, and defense operations. Thus, it combines civic and military applications in what could be defined as dual-purpose infrastructure programs.
The above-mentioned research argues for the need to develop advanced communication systems, Signals Intelligence (SIGINT), and Image Intelligence (IMINT) gathering technologies based on satellite- and aerial-based platforms. These wide-area coverage platforms are critical to Greenland due to its vast and remote areas, where traditional communication networks may be insufficient or impractical. Satellite communication systems such as GEO, MEO, and LEO (and combinations thereof), and stratospheric high-altitude platform systems (HAPS) are relevant for maintaining robust surveillance, facilitating rapid emergency response, and ensuring effective coordination of security as well as search & rescue operations.
Expanding broadband internet access across Greenland is also a key recommendation (that is already in progress today). This involves improving the availability and reliability of communications-related connectivity by additional submarine cables and by new satellite internet services, ensuring that even the most remote communities have reliable broadband internet connectivity. All communities need to have access to broadband internet, be connected, enable economic development, improve quality of life in general, and integrate remote areas into the national and global networks. These communication infrastructure improvements are important for civilian and military purposes, ensuring that Greenland can effectively manage its security challenges and leverage new economic opportunities for its communities. It is my personal opinion that most communities or settlements are connected to the wider internet, and the priority should be to improve the redundancy, availability, and reliability of the existing critical communications infrastructure. With that also comes more quality in the form of higher internet speeds.
The applicability of at least some of the specific securitization recommendations for Greenland, as outlined in Marc Jacobsen’s “Greenland in Arctic Security: (De)securitization Dynamics Under Climatic Thaw and Geopolitical Freeze,” may be somewhat impractical given the unique characteristics of Greenland with its vast area and very small population. Quite a few recommendations (in my opinion), even if in place “today or tomorrow,” would require a critical scale of expertise, human, and industrial capital that Greenland does not have available on its own (and also is unlikely to have in the future). Thus, some of the recommendations depend on such resources to be delivered from outside Greenland, posing inherent availability risks to provide in a crisis (assuming that such capacity would even be available under normal circumstances). This dependency on external actors, particularly Danish and International investors, complicates Greenland’s ability to independently implement policies recommended by the securitization framework. It could lead to conflicts between local priorities and the interests of external stakeholders, particularly in a time of a clear and present security crisis (e.g., Russia attempting to expand west above and beyond Ukraine).
Also, as a result of Greenland’s small population there will be a limited pool of available local personnel with the needed skills to draw upon for implementing and maintaining many of the recommendations in “Greenland in Arctic Security: (De)securitization Dynamics under Climatic Thaw and Geopolitical Freeze”. Training and deploying enough high-tech skilled individuals to cover Greenland’s vast territory and technology needs is a very complex challenge given the limited human resources and challenges in getting external high-tech resouces to Greenland.
I believe Greenland should focus on establishing a comprehensive security strategy that minimizes its dependency on its natural allies and external actors in general. The dual-use approach should be integral to such a security strategy, where technology investments serve civil and defense purposes whenever possible. This approach ensures that Greenlandic society benefits directly from investments in building a robust security framework. I will come back to the various technologies that may be relevant in achieving more independence and less reliance on the external actors that are so prevalent in Greenland today.
HOW CRITICAL IS CRITICAL INFRASTRUCTURE TO GREENLAND
Communications infrastructure is seen as critical in Greenland. It has to provide a reliable and good quality service despite Greenland having some of the most unfavorable environmental conditions in which to build and operate communications networks. Greenland is characterized by vast distances between relatively small, isolated communities. Thus, this makes effective communication essential for bridging those gaps, allowing people to stay connected with each other and as well as the outside world irrespective of weather or geography. The lack of a comprehensive road network and reliance on sea and air travel further emphasize the importance of reliable and available telecommunications services, ensuring timely communication and coordination across the country.
Telecommunications infrastructure is a cornerstone of economic development in Greenland (as it has been elsewhere). It is about efficient internet and telephony services and its role in business operations, e-commerce activities, and international market connections. These aspects are important for the economic growth, education, and diversification of the many Greenlandic communities. The burgeoning tourism industry will also depend on (maybe even demand) robust communication networks to serve those tourists, ensure their safety in remote areas, and promote tourism activities in general. This illustrates very firmly that the communications infrastructure is critical (should there be any doubts).
Telecommunications infrastructure also enables distance learning in education and health services, providing people in remote areas with access to high-quality education that otherwise would not be possible (e.g., Coursera, Udemy Academy, …). Telemedicine has obvious benefits for healthcare services that are often limited in remote regions. It allows residents to receive remote medical consultations and services (e.g., by video conferencing) without the need for long-distance and time-consuming travels that often may aggravate a patient’s condition. Emergency response and public safety are other critical areas in which our communications infrastructure plays a crucial role. Greenland’s harsh and unpredictable weather can lead to severe storms, avalanches, and ice-related incidents. It is therefore important to have a reliable communication network that allows for timely warnings, supporting rescue operations & coordination, and public safety. Moreover, maritime safety also depends on a robust communication infrastructure, enabling reliable communication between ships and coastal stations.
A strong communication network can significantly enhance social connectivity, and help maintaining social ties, such as among families and communities across Greenland. Thus reduce the feeling of isolation. Supporting social cohesion in communities as well as between settlements. Telecommunications can also facilitate sharing and preserving the Greenlandic culture and language through digital media (e.g., Tusass Music), online platforms, and social networks (e.g., Facebook used by ca. 85% of the eligible population, that number is ca. 67% in Denmark).
For a government and its administration, maintaining effective and reliable communication is essential for well-functioning public services and its administration. It should facilitate coordination between different levels of government and remote administration. Additionally, environmental monitoring and research benefit greatly from a reliable and available communication infrastructure. Greenland’s unique environment attracts scientific research, and robust communication networks are essential for supporting data transmission (in general), coordination of research activities, and environmental monitoring. Greenland’s role in global climate change studies should also be supported by communication networks that provide the means of sharing essential climate data collected from remote research stations.
Last but not least. A well-protected (i.e., redundant) and highly available communications infrastructure is a cornerstone of any national defense or emergency situation. If it is well functioning, the critical communications infrastructure will support the seamless operation of military and civilian coordination, protect against cyber threats, and ensure public confidence during a crisis situation (natural or man-made). The importance of investing in and maintaining such a critical infrastructure cannot be underestimated. It plays a critical role in a nation’s overall security and resilience.
TUSASS: THE BACKBONE OF GREENLANDS CRITICAL COMMUNICATIONS INFRASTRUCTURE.
Tusass is the primary telecommunications provider in Greenland. It operates a comprehensive telecom network that includes submarine cables with 5 landing stations in Greenland, very long microwave (MW) radio chains (i.e., long-haul backbone transmission links) with MW backhaul branches to settlements along its way, and broadband satellite connections to deliver telephony, internet, and other communication services across the country. The company is wholly owned by the Government of Greenland (Naalakkersuisut). Positioning Tusass as a critical company responsible for the nation’s communications infrastructure. Tusass faces unique challenges due to the vast, remote, and rugged terrain. Extreme weather conditions make it difficult, often impossible, to work outside for at least 3 – 4 months a year. This complicates the deployment and maintenance of any infrastructure in general and a communications network in particular. The regulatory framework mandates that Tusass fulfills a so-called Public Service Obligation, or PSO. This requires Tusass to provide essential telecommunications services to all of Greenland, even the most isolated communities. This requires Tusass to continue to invest heavily in expanding and enhancing its critical infrastructure, providing reliable and high-quality services to all residents throughout Greenland.
Tusass is the main and, in most areas, the only telecommunications provider in Greenland. The company holds a dominant market position where it provides essential services such as fixed-line telephony, mobile networks, and internet services. The Greenlandic market for internet and data connections was liberalized in 2015. The liberalization allowed private Internet Service Providers (ISPs) to purchase wholesale connections from Tusass and resell them. Despite liberalization, Tusass remains the dominant force in Greenland’s telecommunications sector. Tusass’s market position can be attributed to its extensive communications infrastructure and its government ownership. With a population of 57 thousand and its vast geographical size, it would be highly uneconomical and human-resource wise very chalenging to have duplicate competing physical communications infrastructures and support organizations in Greenland. Not to mention that it would take many years before an alternative telco infrastructure could be up an running matching what is already in place. Thus, while there are smaller niche service providers, Tusass effectively operates as Greenland’s sole telecom provider.
Figure 4 Illustrates one of many of Tusass’s long-haul microwave site along Greenland’s west coast. Accessible only by helicopter. Courtesy: Tusass A/S (Greenland).
CURRENT STATE OF CRITICAL COMMUNICATIONS INFRASTRUCTURE.
The illustration below provides an overview of some of the major and critical infrastructures available in Greenland, with a focus on the communications infrastructure provided by Tusass, such as submarine cables, microwave (MW) radios radio chains, and satellite ground stations, which all connect Greenland and give access to the Internet for all of Greenland.
Figure 5 illustrates the Greenlandic telecommunications provider Tusass infrastructure. Note that Tusass is the incumbent and only telecom provider in Greenland. Currently, five hydropower plants (shown above, location only indicative) provide more than 80% of Greenland’s electricity demand. A new international airport is expected to be operational in Nuuk from November 2024. Source: from Tusass Annual Report 2023 with some additions and minor edits.
From the south of Nanortalik up to above Upernavik on the west coast, Tusass has a 1,700+ km long microwave radio chain connecting all settlements along Greenland’s west coast from the south to the north distributed, supported by 67 microwave (MW) radio sites. Thus, have a microwave radio equipment located for every ca. 25 km ensuring very high performance and availability of connectivity to the many settlements along the West Coast. This setup is called a long-haul microwave chain that uses a series of MW radio relay stations to transmit data over long distances (e.g., up to thousands of kilometers). The harsh climate with heavy rain, snow, and icing makes it very challenging to operate high-frequency, high-bandwidth microwaves (i.e., the short distances between the radio chain sites). The MW radio sites are mainly located on remote peaks in the harsh and unforgiving coastal landscape (ensuring line-of-site), making helicopters the only means of accessing these locations for maintenance and fueling. The field engineers here are pretty much superheroes maintaining the critical communications infrastructure of Greenland and understanding its life-and-death implications for all the remote communities if it breaks down (with the additional danger of meeting a very hungry polar bear and being stuck for several days on a location due to poor weather preventing the helicopter from picking the engineers up again).
Figure 6 illustrates a typical housing for field service staff when on site visits. As the weather can change very rapidly in Greenland it is not uncommon that field service staff have to wait for many days before they can be picked up again by the helicopter. Courtesy: Tusass A/S (Greenland).
Greenland relies on the “Greenland Connect” submarine cable to connect to the rest of the world and the wider internet with a modern-day throughput. The submarine cable connecting Greenland to Canada and Iceland runs from Newfoundland and Labrador in Canada to Nuuk and continues from Qaqortoq in Greenland to land in Iceland (that connects further to Copenhagen and the wider internet). Tusass, furthermore, has deployed submarine cables between 5 of the major Greenlandic settlements, including Nuuk, up the west coast and down to the south (i.e., Qaqortoq). The submarine cables provide some level of redundancies, increased availability, and substantial capacity & quality augmentation to the long-haul MW chain that carries the traffic from surrounding settlements. The submarine cables are critical and essential for the modernization and digitalization of Greenland. However, there are only two main submarine broadband cable connection points, the Canada – Nuuk and Qaqortoq – Iceland submarine connections, to and from Greenland. From a security perspective, this poses substantial and unique risks to Greenland, and its role and impact need to be considered in any work on critical infrastructure strategy. If both international submarine cables were compromised, intentionally or otherwise, it would become challenging, if possible, to sustain today’s communications demand. Most traffic would have to be supported by existing satellite capacity, which is substantially lower than the existing submarine cables can support, leaving the capacity mainly for mission-critical communications. Allowing little spare capacity for consumer and non-critical business communication needs. This said, as long as Greenlandic submarine cables, terrestrial transport, and switching infrastructure are functional, it would be possible to internally to Greenland maintain a resemblance of internet services and communication means between connected settlements using modern day network design thinking.
Moreover, while the submarine cables along the west coast offer redundancy to the land-based long-haul transport solution, there are substantial risks to settlements and their populations where the long-haul MW solution is the only means of supporting remote Greenlandic communities. Given Greenland’s unique geographic and climate challenges it is not only very costly but also time-consuming to reduce the risk of disruption to the existing lesser redundant critical infrastructure already in place (e.g., above Aasiaat north of the Arctic Circle).
Using satellites is an additional dimension, and part of the connectivity toolkit, that can be used to improve the redundancy and availability of the land- and water-based critical communications infrastructures. However, the drawback of satellite systems is that they generally are bandwidth/throughput limited and have longer signal delays (latency and round-trip time) than terrestrial-based communications systems. These issues could pose some limitations on how well some services can be supported or will function and would require a versatile traffic management & prioritization system in case the satellite solution would be the only means of connecting a relatively high-traffic area (e.g., Tasiilaq) used to ground-based support of broadband transport means with substantial more available bandwidth than accessible to the satellite solution. Particular for GEO stationary satellite services, with the satellite located at 36 thousand kilometer altitude, the data traffic flow needs to be carefully optimized in order to function well irrespective of the substantial latency experienced on such connections that at the very best can be 239 milliseconds and in practice might be closer to twice that or more. This poses significant challenges to particular TCP/IP data flows on such response-time-challenged connections and applications sensitivity short round trip times.
Optimizing and stabilizing TCP/IP data flows over GEO satellite connections requires a multi-faceted approach involving enhancements to the TCP protocol (e.g., window scaling, SACK, TCP Hypla, …), the use of hybrid and proxy solutions, application-layer adjustments, error correction mechanisms, Quality of Service (QoS) and traffic shaping, DNS optimizations, and continuous network monitoring. Combining these strategies makes it possible to mitigate some of the inherent challenges of high-latency satellite links and ensure more effective and efficient IP flows and better utilization of the available satellite link bandwidth. Optimizing control signals and latency-sensitive data flows over GEO and LEO satellite connections may also substantially reduce the sensitivity to the prohibitive long delays experienced on GEO connections, using the lower latency LEO connection (RTT < ~ 50 ms @ 500 km altitude), or, if available as a better alternative a long-haul microwave link or submarine connection.
Tusass, in collaboration with the Spanish satellite company Hispasat, make use of the Greenland geostationary satellite, Greensat. Tusass signed an agreement with Hispasat to lease space capacity (800 MHz @ Ku-band) on the Amazonas Nexus satellite until the end of its lifetime (i.e., 2038+/-). Greensat was taken into operation in the last quarter of 2023 (note: it was launched in February 2023), providing services to the satellite-only settlement areas around Qaanaaq, the northernmost settlement on the west coast of Greenland, and Tasiilaq and Ittoqortormiut (north of Tasiilaq), on the remote east coast. All mobile and fixed traffic from a satellite-only area is routed to a satellite ground station that is connected to the geostationary satellite (see the illustration below). The satellite’s primary mission is to provide broadband services to areas that, due to geography & climate and cost, are impractical to connect by submarine cable or long-haul microwave links. The Greensat satellite closes the connection to the rest of the world and the internet via a ground station on Gran Canaria. It also connects to Greenland via submarine cables in Nuuk (via Canada and Qaqortoq).
Figure 7 The image shows a large geostationary satellite ground-station antenna located in Greenland’s cold and remote area. The antenna’s primary purpose is to facilitate communication with geostationary satellites 36 thousand kilometers away, transmitting and receiving data. It may support various services such as Internet, television broadcasting, weather monitoring, and emergency communications. The components are (1) a parabolic reflector (dish), (2) a feed horn and receiver, (3) a mount and support structure, (4) control and monitoring systems, and (5) a radome (not shown on the picture) which is a structural, weatherproof enclosure that protects the antenna from environmental elements without interfering with the electromagnetic signals it transmits and receives. The LEO satellite ground stations are much smaller as the distance between the ground and the low-earth satellite is much smaller, i.e., ca. 350 – 650 km, resulting in less challenging receive and transmit conditions (compared to the connection to a geostationary satellite).
In addition, Tusass also makes use of UK-based OneWeb (Eutelsat) LEO satellite backhaul services at several locations where an area fixed and mobile traffic is routed to a point-of-presence connected to a satellite ground station that connects to a OneWeb satellite that connects to the central switching center in Nuuk (connected to another ground station).
CRITICAL PROPERTIES FOR RELIABLE AND SECURE TRANSPORT NETWORKS.
A physical transport network comprises many tangible components, such as cables, routers, and switches, which form an interconnected system capable of transmitting data. The network is designed and planned according to a given expected coverage, use and level of targeted quality (e.g., speed, latency, priority and security). Moreover, we are also concerned about such a networks availability as well as reliability. We design the physical and logical (i.e., related to higher levels of the OSI stack than the physical) network according to a given target availability, that is how many hours in a year should the network minimum be operational and available to our customers. You will see availability given in percentage of the total hours in a year (e.g., 8,760 hours in a normal year and 8,784 hours in a leap year). So an availability of 99.9% means that we target a minimum operational time of our network of 8,751 hours, or, alternatively, accept a maximum of 9 hours of downtime. The reliability of a network refers to the probability hat the network will continue to function without failure for a given period. For example, say you have a mean time between failures (MTBF) of 8750 hours and you want to figure out what the likelihood is of operating without failure for 4,380 hours (half a year), you find that there is a ca. 60% chance of operating without a failure (or 40% that a failure may occur within the next 6 months). For a critical infrastructure the availability and reliability metrics are very important to consider in any design and planning process.
In contrast to the physical network depiction, a network graph representation abstracts the physical transport network into a mathematical model where graph nodes (or vertexes) represent the network’s many components and edges (or links) represent the physical and logical connections between these network’s many components. Modellizing the physical (and logical) network allows designers and planners to study in detail a networks robustness against many types of disruptions as well as its general functioning and performance.
Suppose we are using a graph approach in our design of a critical communications network. We then need to carefully consider various graph properties critical for the network’s robustness, security, reliability, and efficiency. To achieve this, one must strive for resilience and fault tolerance by designing for increased redundancy and availability involving multiple paths, edges, or connections between nodes, preventing single points of failure (SPoF). This involves creating a network where the number of independent paths between any two nodes is maximized (often subject to economics and feasibility boundary conditions). An optimal average degree of nodes should also be a design criterion. A higher degree of nodes enhances the graph’s, and thus the underlying network’s, resilience, thus avoiding increased vulnerability.
Scalability is a crucial network property. This is best achieved through a hierarchical structure (or topology) that allows for efficient network management as the network expands. The Modularity, which is another graph KPI, ensures that the network can integrate new nodes and edges without major reconfigurations, supporting civilian expansion and military operations or dual-purpose operations. To meet low-latency and high-throughput requirements, the shortest-path routing algorithms should be applied to allow us to minimize the latency or round-trip time (and thus increase throughput). Moreover, bandwidth management should be implemented, allowing the network to handle large data volumes in a prioritized manner (if required). This also ensures that the network can accommodate peak loads and prioritize critical communication when it is compromised.
Security is a paramount property of any communications network. In today’s environment with many real and dangerous cyber threats, it may be one of the most important topics to consider. Each node and link (or edge) in a network requires robust defenses against cyber threats. In our design, we need to think about encryption, authentication, intrusion, and anomaly detection systems. Network segmentation will help isolate critical defense communications from civilian traffic, preventing breaches from compromising the entire network. Survivability is enhanced by minimizing the Network Diameter, a graph property. A low (or lower) network diameter ensures that a network can quickly reroute traffic in case of failures and is an important design element for robustness against targeted attacks and random failures.
Likewise, interoperability is essential for seamless integration between civilian and military communication systems. Flexible protocols and specifications (e.g., Open API) enable different types of traffic and varying security requirements. These frameworks provide the structure, tools, and best practices needed to build and maintain secure communication systems. Thereby protecting against the various cyber threats we have today and expect in the future. Efficiency is achieved through effective load balancing (e.g., on a logical as well as physical level) to distribute traffic evenly across the network, prevent bottlenecks, optimize performance, and design for energy-efficient operations, particularly in remote or harsh environments or in case a part of the network has been compromised.
In order to support both civilian services and defense operations, accessibility and high availability are very important design requirements to consider when having a network with extensive large-scale coverage, including in very remote areas. Incorporating redundant communication links, such as satellite, fiber optic, and wireless, are design choices that allow for high availability even under adverse and disruptive conditions. It makes good sense in an environment such as Greenland to ensure that long-haul microwave links have a given level of redundancy either by satellite backhaul, submarine cable, or additional MW redundancy. While we always strive for our designs to be cost-effective, it may be a challenge if the circumstances dictate that the best redundancy (availability) solution is solved by non-terrestrial means (e.g., by satellite or submarine means). However, efficiency should be addressed by optimizing resource allocation to balance cost with performance, ensuring civil and defense needs are met without excessive expenditure, and sharing infrastructure where feasible to reduce costs while maintaining security through logical separation.
Ultra-secure transport networks are designed to meet stringent reliability, resilience, and security requirements. These type of networks are critical for civil and defense applications, ensuring continuous operation and protection against various threats. The important graph properties that such networks should exhibit include high connectivity, redundancy, low diameter, high node degree, network segmentation, robustness to attacks, scalability, efficient load balancing, geographical diversity, and adaptive routing.
High connectivity ensures multiple independent paths between any pair of nodes in the network, which is crucial for a communication network’s resilience and fault tolerance. This allows the network to maintain functionality even if several nodes or links fail, making it capable of withstanding targeted attacks or random failures without significant performance degradation. Redundancy, which involves having multiple backup paths and nodes, enhances fault tolerance and high availability by providing alternative routes for data transmission if primary paths fail. Redundancy also applies to critical network components such as switches, routers, and communication links, ensuring no or uncritical single point of failure.
A low diameter, the longest-shortest path between any two nodes, ensures data can travel quickly across the network, minimizing latency. This is especially important in time-sensitive applications. High node degree, meaning nodes are connected to many other nodes, increases the network’s robustness and allows for multiple paths for data to traverse, contributing to security and availability. However, it is essential to manage the trade-off between having a high node degree and the complexity of the network.
Network segmentation and compartmentalization will enhance security by limiting the impact of breaches or failures on a small part of the network. This is of particular importance when having a dual-use network design. Network segmentation divides the network into multiple smaller subnetworks. Each segment may have its own security and access control policies. Network compartmentalization involves designing isolated environments where, for example, data and functionalities are separated based on their criticality and sensitivity (this is, in general, a logical separation). Both strategies help contain cyber threats as well as prevent them from spreading across an entire network. Moreover, it also allows for a more granular control over network traffic and access. With this consideration, we should have a network that is robust against various types of attacks, including both physical and cyber attacks, by using secure protocols, encryption, authentication mechanisms, and intrusion detection systems. The aim of the network topology should be to minimize the impact of potential attacks on critical network nodes and links.
In a country such as Greenland, with settlements spread out over a very long distance and supported by very long and exposed transmission links (e.g., long-haul microwave links), geographical diversity is an essential design consideration that allows us to protect the functioning of services against localized disasters or failures. Typically, this involves distributing switching and management nodes, including data centers, across different geographic locations, ensuring that a failure in one area or with a main transport link does not disrupt the major parts of a network. This is particularly important for disaster recovery and business continuity. Finally, the network should support adaptive and dynamic routing protocols that can quickly respond to changes in the network topology, such as node failures or changes in traffic patterns. Such protocols will enhance the network’s resilience by automatically finding the best real-time data transmission paths.
TUSASS NETWORK AS A GRAPH.
Real maps, such as the Greenland map shown below at the left side of Figure 8, provide valuable geographical context and are essential for understanding the physical layout and extent of, for example, a transport network. A graph representation, as shown on the right side of Figure 8, on the other hand, offers a powerful and complementary perspective of the real-world network topology. It can emphasize the structural properties (and qualities) without those disappearing in geographical details that often are not relevant to the network functioning (if designed appropriately). A graph can contain many layers of network information that pretty much describe the network stack if required (e.g., from physical transport up through IP, TCP/IP, and to the application layers). It also supports many types of advanced analysis, design scenarios, and different types of simulations. A graph representation of a communications network is an invaluable tool for network design, planning, troubleshooting, analysis, and management.
Thus, the network graph approach offers several benefits for planning and operations. Firstly, the approach can often visualize the network’s topology better than a geographical map. It facilitates the understanding of various network (and graph) relationships and interconnections between the various network components. Secondly, the graph algorithms can be applied to the network graph and support the analysis of its characteristics, such as availability and redundancy scores, connectivity in general, the shortest paths, and so forth. This kind of analysis helps us identify critical nodes or links that may be sensitive to network and service disruption. It can also help significantly in maintaining and optimizing a network’s operation.
So, analyzing the our communication network’s graph representation makes it possible to identify potential weaknesses in the physical transport network, such as single points of failure (SPoF), bottlenecks, or areas with limited or weak redundancy. These identified weaknesses can then be addressed to enhance the network’s resilience, e.g., improving our network’s redundancy, availability and thus its overall reliability.
Figure 8 The chart above shows on the left side the topology of the (real) transport network of Tusass with the reference point in the Greenlandic settlements it connects. It should be noted that the actual transport network is slightly different as there are more hops between settlements than is shown here. On the right side is a graph representation of the Tusass transport network, shown on the left. The network graph represents the transport network on the west coast north and southbound. There are three main connection categories: (Black dashed line) Microwave (MW), (Orange dashed line) Submarine Cable, and (Blue solid line) Satellite, of which there are a GEO and a LEO arrangement. The size of the node, or settlements, represents the size of the population, which is also why Nuuk has the largest circle. The graph has been drawn consistent with the Kamada-Kawai layout, which is particularly useful for small to medium graphs, providing a reasonable, intuitive visualization of the structural relationship between nodes.
In the following, it is important to understand that due to Greenland’s specific conditions, such as weather and geography, building a robust transport network regarding reliability and redundancy will always be challenging, particularly when relying on the standard toolbox for designing, planning, and creating such networks. With geographical challenges should for example be understood the resulting lack of civil infrastructure connecting settlements … such as the lack of a road network.
The Table below provides key performance indicators (KPIs) for the Greenlandic (Tusass) transport network graph, as illustrated in Figure 8 above. It represents various aspects of the transport network’s structure and connectivity. This graph consists of 93 vertices (e.g., settlements and other connection points, such as long-haul MW radio sites) and 101 edges (transport connections), and it is fully connected, meaning all nodes are reachable within the network. There is only one subgraph, indicating no isolated segments as expected.
The Average Path Length suggests that it takes on average 39 steps to travel between any two nodes. This is a relatively high number, which may indicate a less efficient network. The Diameter of a network is defined as the longest shortest path between any two nodes. It can be shown that the value of the diameter lies between the value of the radius and twice that value (and not higher;-). The diameter is found to be 32, indicating a quite high maximum distance between the most distant nodes. This suggests that the network has a quite extensive reach, as is also obvious from the various illustrations of the transport network above (Figure 8) and below (Figure 11 & 12). Apart from the fact that such a high diameter may indicate potential inefficiencies, a large diameter can also mean that, in the worst-case scenarios, such as a compromised link or connectivity issues in general, communication between some nodes involves many steps (or hops), potentially leading to higher latency and slower data transmission. Related to the Diameter, the network Radius is the minimum eccentricity of any node, which is the shortest path from the most central node to the farthest node. Here, we find the radius to be 16, which means that even the most centrally located node is relatively far from some other nodes in the network. Something that is also very obvious from the various illustrations of the transport network. This emphasizes that the network has nodes that are significantly far apart. Without sufficient redundancy in place, such a transport network may be more sensitive to disruption of the connectivity.
From the perspective of redundancy, a large diameter and radius may imply that the network has fewer alternative paths between distant nodes (i.e., a lower redundancy score). This is, for example, the case between the northern point of Kullorsuaq and Aasiaat. Aasiaat is the first settlement (from the North) to be connected both by microwave and submarine cable and thus has an alternative connectivity solution to the long-haul microwave chain. If a critical node or link fails, the alternative path latency might be considerably longer than the compromised connectivity, such as would be the case with the alternative connectivity being satellite-based, leading to inefficiencies and possible reduced performance. This can also suggest potential capacity bottlenecks where specific paths are heavily relied upon without having enough capacity to act as the sole connectivity for a given transmission path. Thus, the vulnerability of the network to failures increases, resulting in reduced performance for customers in the affected area.
We find a Graph Density, at 0.024. This value indicates a sparse network with relatively few connections compared to the number of possible connections. The Clustering Coefficient is 0.014 and indicates that there are very few tightly-knit groups of nodes (again easily confirmed by visual inspection of the graph itself, see the various figures). The value of the Average Betweenness (ca. 423) measures how often nodes act as bridges along the shortest path between other nodes, indicating a significant central node (i.e., Nuuk).
The Average Closeness of 0.0003 and the Average Eigenvector Centrality of 0.105 provide insights into settlements’ influence and accessibility within the transport network. The Average Closeness measures of how close, on average, nodes are to each other. A high value indicates that nodes (or settlements) are close to each other meaning that the information (e.g., user data, signaling) being transported over the network spreads quickly and efficiently. And not surprisingly the opposite would be the case for a low average value. For our Tusass network the average closeness is very low and suggests that the network may face challenges in accessibility and efficiency, with nodes (settlements) being relatively far from one another. This typically will have an impact on the speed and effectiveness of communication across the network. The Average Eigenvector Centrality measures the overall importance (or influence) of nodes within a network. The term Eigenvectoris a mathematical concept from linear algebra that represents the stable state of the network and provides insights into the structure of the graph and thus the network. For our Tusass network the average eigenvector value is (very) low and indicates a distribution of influence across several nodes that may actually prevent reliance on a single point of failure and, in general, such structures are thought to enhance a network’s resilience and redundancy. An Average Degree of ca. 2 means that each node has about 2 connections on average, indicating a hierarchical network structure with fewer direct connections and with a somewhat low level of redundancy, consistent with what can be observed from the various illustrations shown in this post. This do indicate that our network may be more vulnerable to disruption and failures and have a relative high latency (thus, a high round trip time).
Say that for some reason, the connection to Ilulissat, a settlement north of Aasiaat on the west coast with a little under 5 thousand people, is disrupted due to a connectivity issue between Ilulissat and Qasigiannguit, a neighboring settlement to Ilulissat with ca. a thousand people. This would today disconnect ca. 11 thousand people from receiving communications services or ca. 20% of Tusass’s customer base as all settlements north of Ilulissat would likewise be disconnected because of the reliance on the broken connection to also transport their data towards Nuuk and the internet using the submarine cables out of Greenland. In the terminology of the network graph, a broken connection (or edge as it is called in graph theory) that breaks up the network into two (or more) disconnected parts is called a Bridge. Thus, the connection between Ilulissat and Qasigiannguit is a bridge, as if it is broken, disconnecting the northern part of the long-haul microwave network above Ilulissat. Similarly, if Ilulissat were a central switching hub disrupted, it would disconnect the upper northern network from the network south of Ilulissat, and we would call Ilulissat an Articulation Point.For example, a submarine cable between Aasiaat and Ilulissat would provide redundancy for this particular event, mitigating a disruption of the microwave long-haul network between Ilulissat and Aasiaat that would disconnect at least 20% of the population from communications services.
The transport network has 44 Articulation Points and 57 Bridges, highlighting vulnerabilities where node or link failures could significantly disrupt the connectivity between parts of the network, disconnecting major parts of the network and thus disrupting services. A Modularity of 0.65 suggests a moderately high presence of distinct communities, with the network divided into 8 such communities (see Figure below).
Figure 9 In network analysis, a “natural” community (or cluster) is a group of nodes that are more densely connected to each other than to nodes outside the group. Natural communities are denser subgraphs within a larger network. Identifying such communities helps in understanding the structure and function of the network. In the above analysis of how Tusass’s transport network connects to the various settlements illustrates quiet well the various categories of connectivity (e.g., long-haul microwaves only, submarine cable redundancy, satellite redundancy, etc..) in the communications network of Tusass,
A Throughput (or Degree) of 202 indicates a network with an overall capacity for data transmission. The Degree is the average number of connections per node for a network graph. In a transport network, the degree indicates how many direct connections it has to other settlements. A higher degree implies better connectivity and potentially a higher resilience and redundancy. In a fully connected network with 93 nodes, the total degree would be 93 multiplied by 92, which equals 8,556. Therefore, a value of 202 is quite low in comparison, indicating that the network is far from fully connected, which anyway would be unusual for a transport network on this side. Our transport network is relatively sparse and, thus, resulting in a lower total degree, suggesting that fewer direct paths exist between nodes. This may potentially also mean less overall network redundancy. In the case of a node or link failure, there might be fewer alternative routes, which, as a consequence, can impact network reliability and resilience. Lower degree values can also indicate limited capacity for data transmission between nodes, potentially leading to congestion or bottlenecks if certain paths become over-utilized. This can, of course, then affect the efficiency and speed of data transfer within the network as traffic congestion levels increase.
The KPIs, shown in Table 1 below, collectively indicate that our Greenlandic transport network has several critical points and connections that could affect redundancy and availability. Particularly if they become compromised or experience outages. The high number of articulation points and bridges indicates possible design weaknesses, with the low density and average degree suggesting a limited level of redundancy. In fact, Tusass has, over several years, improved its transport network resilience, focusing on increasing the level of redundancy and reducing critical single points of failure. However, the changes and additions are costly and, due to the environmental conditions of Greenland, are also time-consuming, having fewer working days available for outdoor civil work projects.
Table 1 illustrates the most important graph KPIs, also described in the text above and below, that are associated with the graph representation of the Tusass transport network represented by the settlement connectivity (approximating but not one-to-one with the actual transport network).
In graph theory, an articulation point(see Figure 10 below) is a node that, if it is removed from the network, would split the network into disconnected parts. In our story, an articulation point would be one of our Greenlandic settlements. These types of points are thus important in maintaining network connectivity and serve as points in the network where alternative redundancy schemes might serve well. Therefore, creating additional redundancy in the network’s routing paths and implementing alternative connections will mitigate the impact of a failure of an articulation point, ensuring continued operations in case of a disruption. Basically, the more redundancy that a network has, the fewer articulation points the network will have; see also the illustration below.
Figure 10 The figure above illustrates the redundancy and availability of 3 simple undirected graphs with 4 nodes. The first graph is fully connected, with no articulation points or bridges, resulting in a redundancy and availability score of 100%. Thus I can remove a Node or a Connection from the graph and the remainder will remain full connected. The second graph, which is partly connected, has one articulation point and one bridge, leading to a redundancy and availability score of 75%. If I remove the third Node or the connection between Node 3 and Node 4, I would end with a disconnected Node 4 and a graph that has been broken up in 2 (e.g., if Node 3 is removed we have 2 sub-graphs {1,2} and {4}), The third graph, also partly connected, contains two articulation points and three bridges, resulting in a redundancy score of 0% and an availability score of 50%. Articulation points and bridges are highlighted in red to emphasize their critical roles in graph connectivity. Note: An articulation point is a node whose removal disconnects the graph and a bridge is an edge whose removal disconnects the graph.
Careful consideration of articulation points is crucial in preventing network partitioning, where removing a single node can disconnect the overall network into multiple sub-segments of the network. The connectivity between different segments is obviously critical for continuous data flow and service availability. Often, design and planning requirements dictate that if a network is broken into parts due to various disruption scenarios, these parts will remain functional and continue to provide a service that is possible with reduced performance. Network designers would make use of different strategies, such as increasing the physical redundancy of the transmission network as well as making use of routing algorithms on a higher level, such as multipath routing and diverse routing paths. Moreover, optimizing the placement of articulation points and routing paths (i.e., how traffic flows through the communications network) also maximizes resource utilization and may ensure optimal network performance and service availability for an operator’s customers.
Figure 11 illustrates the many articulation points of our Greenlandic settlements, represented as red stars in the graph of the Greenlandic transport network. Removing an articulation point (a critical node) would partition the graph into multiple disconnected components and may lead to severe service interruption.
In graph theory, a bridge is a network connection (or edge) whose removal would split the graph into multiple disconnected components. This type of connection is obviously critical for maintaining connectivity and facilitating communication between different network parts. In real life with real networks, the network designers would, in general, spend considerable time to ensure that such critical connections (i.e., so-called bridges) do not have an over-proportional impact on their network availability by, for example, building alternative connections (i.e., redundant connections) or ensuring that the impact of a compromised bridge would have a minimum impact in terms of the number of customers.
For our transport network in Greenland, the long-haul microwave transport network is overall less sensitive to disruption on a settlement level, as the underlying topology is like a long spine at high capacity and reasonable redundancy built-in with branches of MW radios that connect from the spine to a particular settlement. Thus, in most cases in this analysis, the long-haul MW radio site, in proximity to a given settlement, is the actual articulation point (not the settlement itself). The Nuuk data center, a central switching hub, is, by definition, an articulation point of very high criticality.
As discussed above and shown below (Figure 12), in the context of our transport network, bridges may play a crucial role in network resilience and fault tolerance. In our story, bridges represent the transport connections connecting Greenlandic settlements and the core network back in Nuuk (i.e., the master network node). In our representations, a bridge can, for example, be (1) a Microwave connection, (2) A submarine cable connection, and (3) a satellite connection provided by Tusass’s geo stationary satellite (e.g., Greensat) or by the low-earth orbiting OneWeb satellite. By identifying and managing bridges, network designers can mitigate the impact of link failures and disruptions, ensuring continuous operation and availability of services. Moreover, keeping network bridges in mind and minimizing them when planning a transport network will significantly reduce the risk of customer-affecting outages and keep the impact of transport disruption and the subsequent network partitioning to a minimum.
Figure 12 illustrates the many (edge) bridges and transport connections present in the graph of the Greenlandic transport network. Removing a bridge would split the network (graph) into multiple disconnected components, leading to network fragmentation and parts that may no longer sustain services. The above picture is common for long microwave chains with many hops (the connections themselves). The remedy is to make shorter hops, as Tusass is doing, and ensure that the connection itself is redundant equipment-wise (e.g., if one radio fails, there is another to take over). However, such a network would remain sensitive to any disruption of the MW site location and the large MW dish antenna.
Network designers should deploy redundancy mechanisms that would minimize the risk of the disruptive impact of compromised articulation points and bridges. They have several choices to choose from, such as multipath routing (e.g., ring topologies), link aggregation, and diverse routing paths to enhance redundancy and availability. These mechanisms will help minimize the impact of bridge failures and improve the overall network availability by increasing the level of network redundancy on a physical and logical level. Moreover, optimizing the placement of bridges and routing paths in a transport network will maximize resource utilization and ensure optimal network performance and service availability.
Knowing a given networks Articulation Points and Bridges will allow us to define an Availability and a Redundancy Score that we can use to evaluate and optimize a network’s robustness and reliability. Some examples of these concepts for simpler graphs (i.e., 4 nodes) are also shown in Figure 10 above. In the context of the Greenland transport network used here, these metrics can help us understand how resilient the network is to failures.
The Availability Score measures the proportion of nodes that are not articulation points, which might compromise our network’s overall availability if compromised. This score measures the risk of exposure to service disruption in case of a disconnection. As a reminder, the articulation point, or cut-vertex, is a node that, when removed, increases the number of components of the network and, thus, potentially the amount of disconnecting parts. The formula that is used to calculate the availability score is given by the total number of settlements (e.g., 93) minus the number of articulation points (e.g., 44) divided by the total number of settlements (e.g., 93). In this context, a higher availability score indicates a more robust network where fewer nodes are critical points of failure. Suppose we get a score that is close to one. In that case, this indicates that most nodes are not articulation points, suggesting that the network can sustain multiple node failures without significant loss of connectivity (see Figure 10 for a relatively simple illustration of this).
The Redundancy Score measures the proportion of connections that are not bridges, which could result in severe service disruptions to our customers if compromised. When a bridge is compromised or removed, it increases the number of network parts. The formula for the redundancy score is the total number of transport connections (edges, e.g., 101) minus the number of bridges (e.g., 57) divided by the total number of transport connections (edges, e.g., 101). Thus, in this context of redundancy, a higher redundancy score indicates a more resilient network where fewer edges are critical points of failure. If we get a redundancy score that is close to 100%, it would indicate that most of our (transport) connections cannot be categorized as bridges. This also suggests that our network can sustain multiple connectivity failures without it, resulting in a significant loss of overall connectivity and a severe service interruption.
Having more switching centers, or central hubs, can significantly enhance a communications network’s resilience, availability, and redundancy. It also reduces the consequences and impact of disruption to critical bridges in the network. Moreover, by distributing traffic, isolating failures, and providing multiple paths for data transmission, these central hubs may ensure continuous service to our customers and improve the overall network performance. In my opinion, implementing strategies to support multiple switching centers is essential for maintaining a robust and reliable communications infrastructure capable of withstanding various disruptions and enabling scaling to meet any future demands.
For our Greenlandic transport network shown above, we find an Availability Score of 53% and a Redundancy Score of 44%. While the scores may appear on the low side, we need to keep in mind that we are in Greenland with a population of 57 thousand mainly distributed along the west coast (from south to the north) in about 50+ settlements with 30%+ living in Nuuk. Tusass communications network connects to pretty much all settlements in Greenland, covering approximately 3,500+ km on the west coast (e.g., comparable to the distance from the top of Norway all the way down to the most southern point of Sicily), and irrespective of the number of people living in them. This is also a very clear desire, expectation, and direction that has been given by the Greenlandic administration (i.e., via the universal service obligation imposed on Tusass). The Tusass transport network is not designed with strict financial KPIs in mind and with the financial requirement that a given connection to a settlement would need to have a positive return on investment within a few years (as is the prevalent norm in our Industry). The transport network of Tusass has been designed to connect all communities of Greenland to an adequate level of quality and availability, prioritizing the coverage of the Greenlandic population (and the settlements they live in) rather than whether or not it makes hard financial sense. Tusass’s network is continuously upgraded and expanded as the demand for more advanced broadband services increases (as it does anywhere else in the world).
CRITICAL TECHNOLOGIES RELEVANT TO GREENLAND AND THE WIDER ARCTIC.
Greenland’s strategic location in the Arctic and its untapped natural resources, such as rare earth elements, oil, and gas, has increasingly drawn the attention of major global powers like the United States, Russia, and China. The melting Arctic ice due to climate change is opening new shipping routes and making these resources more accessible, escalating the geopolitical competition in the region.
Greenland must establish a defense and security strategy that minimizes its dependency on its natural allies and external actors to mitigate a situation where such may not be available or have the resources to commit to Greenland. An integral part of such a security strategy should be a dual-use, civil, and defense requirement whenever possible. Ensuring that Greenlandic society gets an immediate and sustainable return on investments in establishing a solid security framework.
5G technology offers significant advancements over previous generations of wireless networks, particularly in terms of private networking, speed, reliability, and latency across a variety of coverage platforms, e.g., (normal fixed) terrestrial antennas, vehicle-based (i.e., Cell on Wheels), balloon-based, drone-based, LEO-satellite based. This makes 5G ideal for setting up ad-hoc mobile coverage areas for military and critical civil applications. One of the key capabilities of 5G that supports these use cases is network slicing, which allows for the creation of dedicated virtual networks optimized for specific requirements.
Telia Norway has conducted trials together with the Norwegian Armed Forces in Norway to demonstrate the use of 5G for military applications (note: I think this is one of the best examples of an operator-defense collaboration on deployment innovation and directly applies to Arctic conditions). These trials included setting up ad-hoc 5G networks to support various military scenarios (including in an Arctic-like climate). The key findings demonstrated the ability to provide high-speed, low-latency communications in challenging environments, supporting real-time situational awareness and secure communications for military personnel. Ericsson has also partnered with the UK Ministry of Defense to trial 5G applications for military use. These trials focused on using 5G to support secure communications, enhance situational awareness, and enable the use of autonomous systems in military operations. NATO has conducted exercises incorporating 5G technology to evaluate its potential for improving command and control, situational awareness, and logistics in multi-national military operations. These exercises have shown the potential of 5G to enhance interoperability and coordination among allied forces. It is a very meaningful dual-use technology.
5G private networks offer a dedicated and secure network environment for specific organizations or use cases, which can be particularly beneficial in the Arctic and Greenland. These private networks can provide reliable communication and data transfer in remote and harsh environments, supporting military and civil applications. For instance, in Greenland, 5G private networks can enhance communication for scientific research stations, ensuring that data from environmental monitoring and climate research is transmitted securely and efficiently. They can also support critical infrastructure, such as power grids and transportation networks, by providing a reliable communication backbone. Moreover, in Greenland, the existing public telecommunications network may be designed in such a way that it essentially could operate as a “private” network in case transmission lines connecting settlements would be compromised (e.g., due to natural or unnatural causes), possibly a “thin” LEO satellite connection out of the settlement.
5G provides ultra-fast data speeds and low latency, enabling (near) real-time communication and data processing. This is crucial for military operations and emergency response scenarios where timely information is vital. Network slicing allows a single physical 5G network to be divided into multiple virtual networks, each tailored to specific applications or user groups. This ensures that critical communications are prioritized and reliable even during network congestion. It should be considered that for Greenland, the transport network (e.g., long-haul microwave network, routing choices, and satellite connections) might be limiting how fast the ultra-fast data speeds can become and may, at least along some transport routes, limit the round trip time performance (e.g., GEO satellite connections).
5G Enhanced Mobile Broadband (eMBB) provides high-speed internet access to support applications such as video streaming, augmented reality (AR), and virtual reality (VR) for situational awareness and training. Massive Machine-Type Communications (mMTC) supports a large number of IoT devices for monitoring and controlling equipment, sensors, and vehicles in both military and civil scenarios. Ultra-Reliable (Low-Latency) Communications (URLLC) ensures dependable and timely communication for critical applications such as command and control systems as well as unmanned and autonomous communication platforms (e.g., terrestrial, aerial, and underwater drones). I should note that designing defense and secure systems for ultra-low latency (< 10 ms) requirements would be a mistake as such cannot be guaranteed under all scenarios. The ultra-reliability (and availability) of transport connectivity is a critical challenge as it ensures that a given system has sufficient autonomy. Ultra-low latency of a given connectivity is much less critical.
For military (defense) applications, 5G can be rapidly deployed in the field using portable base stations to create a mobile (private) network. This is particularly useful in remote or hostile environments where traditional infrastructure is unavailable or has been compromised. Network slicing can create a secure, dedicated network for military operations. This ensures that sensitive data and communications are protected from interception and jamming. The low latency of 5G supports (near) real-time video feeds from drones, body cameras, and other surveillance equipment, enhancing situational awareness and decision-making in combat or reconnaissance missions.
Figure 13 The hierarchical coverage architecture shown above is relevant for military or, for example, search and rescue operations in remote areas like Greenland (or the Arctic in general), integrating multiple technological layers to ensure robust communication and surveillance. LEO satellites provide extensive broadband and SIGINT & IMINT coverage, supported by GEO satellites for stable links and data processing through ground stations. High Altitude Platforms (HAPs) offer 5G, IMINT, and SIGINT coverage at mid-altitudes, enhancing communication reach and resolution. The HAP system offers an extremely mobile and versatile platform for civil and defense scenarios. An ad-hoc private 5G network on the ground ensures secure, real-time communication for tactical operations. This multi-layered architecture is crucial for maintaining connectivity and operational efficiency in Greenland’s harsh and remote environments. The multi-layered communications network integrates IOT networks that may have been deployed in the past or in a specific mission context.
In critical civil applications, 5G can provide reliable communication networks for first responders during natural disasters or large-scale emergencies. Network slicing ensures that emergency services have priority access to the network, enabling efficient coordination and response. 5G can support the rapid deployment of communication networks in disaster-stricken areas, ensuring that affected populations can access critical services and information. Network slicing can allocate dedicated resources for smart city applications, such as traffic management, public safety, and environmental monitoring, ensuring that these services remain operational even during peak usage times. Thus, for Greenland, ensuring 5G availability would be through coastal settlements and possibly coastal coverage (outside settlements) of 5G at a lower frequency range (e.g., 600 – 900 MHz), prioritizing 5G coverage rather than 5G enhanced mobile broadband (i.e., any coverage at a high coverage probability is better than no coverage at certainty).
Besides 5G, what other technologies would otherwise be of importance in a Greenland Technology Strategy as it relates to its security and ensuring its investments and efforts also return beneficially to its society (e.g., a dual-use priority):
It would be advisable to increase the number of community networks within the overall network that can continue functioning if cut off from the main communications network. Thus, communications services in smaller and remote settlements depend less on a main or very few central communications control and management hubs. This requires on a local settlement level, or grouping of settlements, self-healing, remote (as opposed to a central hub) management, distributed databases, regional data center (typically a few racks), edge computing, local DNS, CDNs and content hosting, satellite connection, … Most telecom infrastructure manufacturing companies have today network in a box solutions that allow for such designs. Such solutions enable private 5G networks to function isolated from a public PLMN and fixed transport network.
It is essential to develop a (very) highly available and redundant digital transport infrastructure leveraging the existing topology strengthened by additional submarine cables (less critical than some of the other means of connectivity), increased transport ring- & higher-redundancy topologies, multi-level satellite connections (GEO, MEO & LEO, supplier redundancy) with more satellite ground gateways on Greenland (e.g., avoiding “off-Greenland” traffic routing). In addition, a remotely controlled stratospheric drone platform could provide additional connectivity redundancy at very high broadband speeds and low latencies.
Satellite backhaul solutions, operating, for example, from a Low Earth Orbit (LEO), such as shown in Figure below, are extending internet services to the farthest reaches of the globe. These satellites offer many benefits, as already discussed above, in connecting remote, rural, and previously un- and under-served areas with reliable internet services. Many remote regions lack foundational telecom infrastructure, particularly long-haul transport networks for carrying traffic away from remote populated areas. Satellite backhauls do not only offer a substantially better financial solution for enhancing internet connectivity to remote areas but are often the only viable solution for connectivity. The satellite backhaul solution is an important part of the toolkit to improve on redundancy and availability of particular very long and extensive long-haul microwave transport networks through remote areas (e.g., Greenland’s rugged and frequently hostile harsh coastal areas) where increasing the level of availability and redundancy with terrestrial means may be impractical (due to environmental factors) or incredibly costly. – LEO satellites provide several security advantages over GEO satellites when considering resistance to hostile actions to disrupt satellite communications. One significant factor is the altitude at which LEO satellites operate, which is between 500 and 2,000 kilometers, compared to GEO satellites, which are positioned approximately 36,000 kilometers above the equator. The lower altitude makes LEO satellites less vulnerable to long-range anti-satellite (ASAT) missiles. – LEO satellite networks are usually composed of large constellations with many satellites, often numbering in the dozens to hundreds. This extensive LEO network constellation provides some redundancy, meaning the network can still function effectively if some satellites are “taken out.” In contrast, GEO satellites are typically much fewer in number, and each satellite covers a much larger area, so losing even one GEO satellite will have a significant impact. – Another advantage of LEO satellites is their rapid movement across the sky relative to the Earth’s surface, completing an orbit in about 90 to 120 minutes. This constant movement makes it more challenging for hostile actors to track and target individual satellites for extended periods. In comparison, GEO satellites remain stationary relative to a fixed point on Earth, making them easier to locate and target. LEO satellites’ lower altitude also results in lower latency than GEO satellites. This can benefit secure, time-sensitive communications and is less susceptible to interception and jamming due to the reduced time delay. However, any security architecture of the critical transport infrastructure should not only rely on one type of satellite configuration. – Both GEO and LEO satellites have their purpose and benefits. Moreover, a hierarchical multi-dimensional topology, including stratospheric drones and even autonomous underwater vehicles, is worth considering when designing critical communications architecture. It is also worth remembering that public satellite networks may offer a much higher degree of communications redundancy and availability than defense-specific constellations. However, for SIGINT & IMINT collection, the defense-specific satellite constellations are likely much more advanced (unfortunately, they are also not as numerous as their civilian “cousins”). This said, a stratospheric aerial platform (e.g., HAP) would be substantially more powerful in IMINT and possibly also for some SIGINT tasks (or/and less costly & versatile) than a defense-specific satellite solution.
Figure 14 illustrates the architecture of a Low Earth Orbit (LEO) satellite backhaul system used by providers like OneWeb as well as StarLink with their so-called “Community Gateway” (i.e., using their Ka-band). It showcases the connectivity between terrestrial internet infrastructure (i.e., Satellite Gateways) and satellites in orbit, enabling high-speed data transmission. The network consists of LEO satellites that communicate with each other (inter-satellite Comms) using the Ku and Ka frequency bands. These satellites connect to ground-based satellite gateways (GW), which interface with Points of Presence (PoP) and Internet Exchange Points (IXP), integrating the space-based network with the terrestrial internet (WWW). Note: The indicated speeds and frequency bands (e.g., Ku: 12–18 GHz, Ka: 28–40 GHz) and data speeds illustrate the network’s capabilities.
Establish collaboration and agreements with LEO direct to cellular device satellite providers (i.e., there are many more than StarLink (US) around, e.g., AST Spacemobile (US), Lynk Mobile (US), Sateliot (Spain),…) that would offer cellular services across Greenland. A possible concern is to what degree such systems can be relied upon in a crisis, as these are controlled by external commercial companies operating satellites outside the control and influence of Greenlandic interests. For more details about LEO satellites, see my recent article “The Next Frontier: LEO Satellites for Internet Services.”.
Figure 15 illustrates an LEO satellite direct-to-device communication in remote areas without terrestrially-based communications infrastructure. Satellites are the only means of communication by a normal mobile device or classical satellite phone. Courtesy: DALL-E.
Establish an unmanned (remotely operated) stratospheric High Altitude Platform System (HAPS) (i.e., an advanced drone-based platform) or Unmanned Aerial Vehicles (UAV) over Greenland (or The Arctic region) with payload agnostic capabilities. This could easily be run out of existing Greenlandic ground-based aviation infrastructure (e.g., Kangerlussuaq, Nuuk, or many other community airports across Greenland). This platform could eventually become autonomous or require little human intervention. The high-altitude platform could support mission-critical ad-hoc networking for civil and defense applications (over Greenland). Such a multi-purpose platform can be used for IMINT and SIGINT (i.e., for both civil & defense) and civil communication means, including establishing connectivity to the ground-based transport network in case of disruptions. Lastly, a HAPS may also permanently offer high-quality and capacity 5G mobile services or act as a private ultra-secure 5G network in an ad-hoc mission-specific scenario. For a detailed account of stratospheric drones and how these compared with low-earth satellites, see my recent article “Stratospheric Drones & Low Earth Satellites: Revolutionizing Terrestrial Rural Broadband from the Skies?”. – Stratospheric drones, which operate in the stratosphere at altitudes around 20 to 50 kilometers, offer several security advantages over traditional satellite communications and submarine communication cables, especially from a Greenlandic perspective. These drones are less accessible and harder to target due to their altitude, which places them out of reach for most ground-based anti-aircraft systems and well above the range of most manned aircraft. This makes them less vulnerable to hostile actions compared to satellites, which can be targeted by anti-satellite (ASAT) missiles, or submarine cables, which can be physically cut or damaged by underwater operations. The drones would stay over Greenlandic, or NATO, territory while by nature, design, and purpose, submarine communications cables and satellites, in general, are extending far beyond the territory of Greenland. – The mobility and flexibility of stratospheric drones allow them to be quickly repositioned as needed, making it difficult for adversaries to consistently target them. Unlike satellites that follow predictable orbits or submarine cables with fixed routes, these drones can change their location dynamically to respond to threats or optimize their coverage. This is particularly advantageous for Greenland, whose vast and harsh environment makes maintaining and protecting fixed communication infrastructure challenging. – Deploying a fleet of stratospheric drones provides redundancy and scalability. If one drone is compromised or taken out of service, others can fill the gap, ensuring continuous communication coverage. This distributed approach reduces the risk of a single point of failure, which is more pronounced with individual satellites or single submarine cables. For Greenland, this means a more reliable and resilient communication network that can adapt to disruptions. – Stratospheric drones can be rapidly deployed and recovered, making it an easier platform to maintain and upgrade them as needed compared to for example satellite based platforms and even terrestrial deployed networks. This quick deployment capability is crucial for Greenland, where harsh weather conditions can complicate the maintenance and repair of fixed infrastructure. Unlike satellites that require expensive and complex launches or submarine cables that involve extensive underwater laying and maintenance efforts, drones offer a more flexible and manageable solution. – Drones can also establish secure, line-of-sight communication links that are less susceptible to interception and jamming. Operating closer to the ground compared to satellites allows the use of higher frequencies narrower beams that are more difficult to jam. Additionally, drones can employ advanced encryption and frequency-hopping techniques to further secure their communications, ensuring that sensitive data remains protected. Stratospheric drones can also be equipped with advanced surveillance and countermeasure technologies to detect and respond to threats. For instance, they can carry sensors to monitor the electromagnetic spectrum for jamming attempts and deploy countermeasures to mitigate these threats. This proactive defense capability enhances their security profile compared to passive communication infrastructure like satellites or cables. – From a Greenlandic perspective, stratospheric drones offer significant advantages. They can be deployed over specific areas of interest, providing targeted communication coverage for remote or strategically important regions. This is particularly useful for covering Greenland’s vast and sparsely populated areas. Modern stratospheric drones are designed to support multi-dimensional payloads, or as it might also be called, payload agnostic (e.g., SIGINT & IMINT equipment, 5G base station and advanced antenna, laser communication systems, …) and stay operational for extended periods, ranging from weeks to months, ensuring sustained communication coverage without the need for frequent replacements or maintenance. – Last but not least, Greenland may be an ideal safe testing ground due to its vast, remote and thinly populated regions.
Figure 16 illustrates a Non-Terrestrial Network consisting of a stratospheric High Altitude Platform (HAP) drone-based constellation providing terrestrial Cellular broadband services to terrestrial mobile users delivered to their normal 5G terminal equipment that may range from smartphone and tablets to civil and military IOT networks and devices. Each hexagon represents a beam inside the larger coverage area of the stratospheric drone. One could assign three HAPs to cover a given area to deliver very high-availability services to a rural area. The operating altitude of a HAP constellation is between 10 and 50 km, with an optimum of around 20 km. It is assumed that there is inter-HAP connectivity, e.g., via laser links. Of course, it is also possible to contemplate having the gNB (full 5G radio node) in the stratospheric drone entirely, allowing easier integration with LEO satellite backhauls, for example. There might even be applications (e.g., defense, natural & unnatural disaster situations, …) where a standalone 5G SA core is integrated.
Unmanned Underwater Vehicles (UUV), also known as Autonomous Underwater Vehicles (AUV), are obvious systems to deploy for underwater surveillance & monitoring that may also have obvious dual-use purposes (e.g., fisheries & resource management, iceberg tracking and navigation, coastal defense and infrastructure protection such as for submarine cables). Depending on the mission parameters and type of AUV, the range is between up to 100 kilometers (e.g., REMUS100) to thousands of kilometers (e.g., SeaBed2030) and an operational time (endurance) from max. 24 hours (e.g., REMUS100, Bluefin-21), to multiple days (e.g., Boing Echo Voyager), to several months (SeaBed2030). A subset of this kind of underwater solution would be swarm-like AUV constellations. See Figure 17 below for an illustration.
Increase RD&T (Research, Development & Trials) on Arctic Internet of Things (A-IOT) (note: require some level of coverage, minimum satellite) for civil, defense/military (e.g., Military IOTnor M-IOT) and dual-use applications, such as surveillance & reconnaissance, environmental monitoring, infrastructure security, etc… (note: IOTs are not only for terrestrial use cases but also highly interesting for aquatic applications in combination with AUV/UUVs). Military IoT refers to integrating IoT technologies tailored explicitly for military applications. These devices enhance operational efficiency, improve situational awareness, and support decision-making processes in various military contexts. Military IoT encompasses various connected devices, sensors, and systems that collect, transmit, and analyze data to support defense and security operations. In the vast and remote regions of Greenland and the Arctic, military IoT devices can be deployed for continuous surveillance and reconnaissance. This includes using drones, such as advanced HAPS, equipped with cameras and sensors to monitor borders, track the movements of ships and aircraft, and detect any unauthorized activities. Military IoT sensors can also monitor Arctic environmental conditions, tracking ice thickness changes, weather patterns, and sea levels. Such data is crucial for planning and executing military operations in the challenging Arctic environment but is also of tremendous value for the Greenlandic society. The importance of dual-use cases, civil and defense, cannot be understated; here are some examples: – Infrastructure Monitoring and Maintenance: (Military Use Case) IoT sensors can be deployed to monitor the structural integrity of military installations, such as bases and airstrips, ensuring they remain operational and safe for use. These sensors can detect stress, wear, and potential damage due to extreme weather conditions. These IoT devices and networks can also be deployed for perimeter defense and monitoring. (Civil Use Case) The same technology can be applied to civilian infrastructure, including roads, bridges, and public buildings. Continuous monitoring can help maintain these civil infrastructures by providing early warnings about potential failures, thus preventing accidents and ensuring public safety. – Secure Communication Networks – Military Use Case: Military IoT devices can establish secure communication networks in remote areas, ensuring that military units can maintain reliable and secure communications even in the Arctic’s harsh conditions. This is critical for coordinating operations and responding to threats. Civil Use Case: In civilian contexts, these communication networks can enhance connectivity in remote Greenlandic communities, providing essential services such as emergency communications, internet access, and telemedicine. This helps bridge the digital divide and improve residents’ quality of life. – Environmental Monitoring and Maritime Safety – Military Use Case: Military IoT devices, such as underwater sensor networks and buoys, can be deployed to monitor sea conditions, ice movements, and potential maritime threats. These devices can provide real-time data critical for naval operations, ensuring safe navigation and strategic planning. Civil Use Case: The same sensors and buoys can be used for civilian purposes, such as ensuring the safety of commercial shipping lanes, fishing operations, and maritime travel. Real-time monitoring of sea conditions and icebergs can prevent maritime accidents and enhance the safety of maritime activities. – Fisheries Management and Surveillance – Military Use Case: IoT devices can monitor and patrol Greenlandic waters for illegal fishing activities and unauthorized maritime incursions. Drones and underwater sensors can track vessel movements, ensuring that military forces can respond to potential security threats. Civil Use Case: These monitoring systems can support fisheries management by tracking fish populations and movements, helping to enforce sustainable fishing practices and prevent overfishing. This data is important for the local economy, which heavily relies on fishing.
Implement Distributed Acoustic Sensing (DAS) on submarine cables. DAS utilizes existing fiber-optic cables, such as those used for telecommunications, to detect and monitor acoustic signals in the underwater environment. This innovative technology leverages the sensitivity of fiber-optic cables to vibrations and sound waves, allowing for the detection of various underwater activities. This could also be integrated with the AUV and A-IOTs-based sensor systems. It should be noted that jamming a DAS system is considerably more complex than jamming traditional radio-frequency (RF) or wireless communication systems. DAS’s significant security and defense advantages might justify deploying more submarine cables around Greenland. This investment is compelling because of enhanced surveillance and security, improved connectivity, and strategic and economic benefits. By leveraging DAS technology, Greenland could strengthen its national security, support economic development, and maintain its strategic importance in the Arctic region.
Greenland should widely embrace autonomous systems deployment and technologies based on artificial intelligence (AI). AI is a technology that could compensate for the challenges of having a vast geography, a hostile climate, and a small population. This may, by far, be one of the most critical components of a practical security strategy for Greenland. Getting experience with autonomous systems in a Greenlandic and Arctic setting should be prioritized. Collaboration & knowledge exchange with Canadian and American universities should be structurally explored, as well as other larger (friendly) countries with Arctic interests (e.g., Norway, Iceland, …).
Last but not least, cybersecurity is an essential, even foundational, component of the securitization of Greenland and the wider Arctic, addressing the protection of critical infrastructure, the integrity of surveillance and monitoring systems, and the defense against geopolitical cyber threats. The present state and level of maturity of cybersecurity and defense (against cyber threats) related to Greenland’s critical infrastructure has to improve substantially. Prioritizing cybersecurity may have to be at the expense of other critical activities due to limited resources with relevant expertise available to businesses in Greenland). Today, international collaboration is essential for Greenland to develop strong cyber defense capabilities, ensure secure communication networks, and implement effective incident response plans. However, it is essential for Greenland’s security that a cybersecurity architecture is tailor-made to the particularities of Greenland and allows Greenland to operate independently should friendly actors and allies not be in a position to provide assistance.
Figure 17 Above illustrates an Unmanned Underwater Vehicle (UUV) near the coast of Greenland inspecting a submarine cable. The UUV is a robotic device that operates underwater without a human onboard, controlled either autonomously or remotely. In and around Greenland’s coastline, UUVs may serve both defense and civilian purposes. For defense, they can patrol for submarines, monitor underwater traffic, and detect potential threats, enhancing maritime security. Civilian applications include search & rescue missions, scientific research, where UUVs map the seabed, study marine life, and monitor environmental changes, crucial for understanding climate change impacts. Additionally, they inspect underwater infrastructure like submarine cables, ensuring their integrity and functionality. UUVs’ versatility makes them invaluable for comprehensive underwater exploration and security along Greenland’s long coast line. Integrated defense architectures may combine the UUV, Distributed Acoustic Sensor (DAS) networks deployed at submarine cables, and cognitive AI-based closed-loop security solutions (e.g., autonomous operation). Courtesy: DALL-E.
How do we frame some of the above recommendations into a context of securitization in the academic sense of the word aligned with the Copenhagen School (as I understand it)? I will structure this as the “Securitizing Actor(s),” “Extraordinary Measures Required,” and the “Geopolitical Implications”:
Example 1:Improving Communications networks as a security priority.
Securitizing Actor(s): Greenland’s government, possibly supported by Denmark and international allies (e.g., The USA’s Pituffik Space Base on Greenland), frames the lack of higher availability and reliable communication networks as an existential threat to national security, economic development, and stability, including the ability to defend Greenland effectively during a global threat or crisis.
Extraordinary Measures Required: Greenland can invest in advanced digital communication technologies to address the threat. This includes upgrading infrastructure such as fiber-optic cables, satellite communication systems, stratospheric high-altitude platform (HAP) with IMINT, SIGINT, and broadband communications payload, and 5G wireless networks to ensure they are reliable and can handle increased data traffic. Implementing advanced cybersecurity measures to protect these networks from cyber threats is also crucial. Additionally, investments in broadband expansion to remote areas ensure comprehensive coverage and connectivity.
Geopolitical Implications: By framing the reliability and availability of digital communications networks as a national security issue, Greenland ensures that significant resources are allocated to upgrade and maintain these critical infrastructures. Greenland may also attract European Union investments to leapfrogging the critical communications infrastructure. This improves Greenland’s day-to-day communication and economic activities and enhances its strategic importance by ensuring secure and efficient information flow. Reliable digital networks are essential for attracting international investments, supporting digital economies, and maintaining social cohesion.
Example 2: Geopolitical Competition in the Arctic
Securitizing Actor(s): The Greenland government, aligned with Danish and international allies’ interests, views the increasing presence of Russian and Chinese activities in the Arctic as a direct threat to Greenland’s sovereignty and security.
Extraordinary Measures Required: In response, Greenland can adopt advanced surveillance and defense technologies, such as Distributed Acoustic Sensing (DAS) systems to monitor underwater activities and Unmanned Aerial & Underwater Vehicles (UAVs & UUVs) for continuous aerial surveillance. Additionally, deploying advanced communication networks, including satellite-based systems, ensures secure and reliable information flow.
Geopolitical Implications: By framing foreign powers’ increased activities as a security threat (e.g., Russia and China), Greenland can attract NATO and European Union investments and support for deploying cutting-edge surveillance and defense technologies. This enhances Greenland’s security infrastructure, deters potential adversaries, and solidifies its strategic importance within the alliance.
Example 3: Cybersecurity as a National Security Priority.
Securitizing Actor(s): Greenland, aligned with its allies, frames the potential for cyber-attacks on critical infrastructure (such as power grids, communication networks, and military installations) as an existential threat to national security.
Extraordinary Measures Required: To address this threat, Greenland can invest in state-of-the-art cybersecurity technologies, including artificial intelligence-driven threat detection systems, encrypted communication channels, and comprehensive incident response frameworks. Establishing partnerships with global cybersecurity firms and participating in international cybersecurity exercises can also be part of the strategy.
Geopolitical Implications: By securitizing cybersecurity, Greenland ensures that significant resources are allocated to protect its digital infrastructure. This safeguards its critical systems and enhances its attractiveness as a secure location for international investments, reinforcing its geopolitical stability and economic growth.
Example 4: Arctic IoT and Dual-Use Military IoT Networks as a Security Priority.
Securitizing Actor(s): Greenland’s government, supported by Denmark and international allies, frames the lack of Arctic IoT and dual-use military IoT networks as an existential threat to national security, economic development, and environmental monitoring.
Extraordinary Measures Required: Greenland can invest in deploying Arctic IoT and dual-use military IoT networks to address the threat. These networks involve a comprehensive system of interconnected sensors, devices, and communication technologies designed to operate in the harsh Arctic environment. This includes deploying sensors for environmental monitoring, enhancing surveillance capabilities, and improving communication and data-sharing across military and civilian applications.
Geopolitical Implications: By framing the lack of Arctic IoT and dual-use military IoT networks as a national security issue, Greenland ensures that significant resources are allocated to develop and maintain these advanced technological infrastructures. This improves situational awareness and operational efficiency and enhances Greenland’s strategic importance by providing real-time data and robust monitoring capabilities. Reliable IoT networks are essential for protecting critical infrastructure, supporting economic activities, and maintaining environmental and national security.
THE DANISH DEFENSE & SECURITY AGREEMENT COVERING THE PERIOD 2024 TO 2033.
Recently, Denmark approved its new defense and security agreement for the period 2024-2033. This strongly emphasizes Denmark’s strategic reorientation in response to the new geopolitical realities. A key element in the Danish commitment to NATO’s goals includes a spending level approaching and possibly superseding the 2% of GDP on defense by 2030. It is not 2% for the sake of 2%. There really is a lot to be done, and as soon as possible. The agreement entails significant financial investments totaling approximately 190 billion DKK (or ca. 25+ billion euros) over the next ten years to quantum leap defense capabilities and critical infrastructure.
The defense agreement emphasizes the importance of enhancing security in the Arctic region, including, of course, Greenland. Thus, Greenland’s strategic significance in the current geopolitical landscape is recognized, particularly in light of Russian activities and Chinese expressed intentions (e.g., re: the “Polar Silk Road”). The agreement aims to strengthen surveillance, sovereignty enforcement, and collaboration with NATO in the Arctic. As such, we should expect investments to improve surveillance capabilities that would strengthen the enforcement of Greenland’s sovereignty. Ensuring that Greenland and Denmark can effectively monitor and protect its Arctic territories (together with its allies). The defense agreement stresses the importance of supporting NATO’s mission in the Arctic region, contributing to collective defense and deterrence efforts.
What I very much like in the new defense agreement is the expressed focus on dual-use infrastructure investments that benefit Greenland’s defense (& military) and civilian sectors. This includes upgrading existing facilities and enhancing operational capabilities in the Arctic that allow a rapid response to security threats. The agreement ensures that defense investments also bring economic and social benefits to Greenlandic society, consistent with a dual-use philosophy. In order for this to become a reality, it will involve a close collaboration with local authorities, businesses, and research institutions to support the local economy and create new job opportunities (as well as ensure that there is a local emphasis on relevant education to ensure that such investments are locally sustainable and not relying on an “army” of Danes and others of non-Greenlandic origin).
The defense agreement unsurprisingly expresses a strong commitment to enhancing cybersecurity measures as well as addressing hybrid threats in Greenland. This reflects the broader security challenges of the new technology introduction required, the present cyber-maturity level, and, of course, the current (and future expected) geopolitical tensions. The architects behind the agreement have also realized that there is a big need to improve recruitment, retention, and appropriate training within the defense forces, ensuring that personnel are well-prepared to operate in the Arctic environment in general and in Greenland in particular.
It is great to see that the Danish “Defense and Security Agreement” for 2024-2033 reflects the principles of securitization by framing Greenland’s security as an existential threat and justifying substantial investments and strategic initiatives in response. The focus of the agreement is on enhancing critical infrastructure, surveillance platforms, and international cooperation while ensuring that the benefits of the local economy align with the concept of securitization. That is to ensure that Greenland is well-prepared to address current and future security challenges and anticipated threats in the Arctic region.
The agreement underscores the importance of advanced surveillance systems, such as, for example, satellite-based monitoring and sophisticated radar systems as mentioned in the agreement. These technologies are deemed important for maintaining situational awareness and ensuring the security of Denmark’s territories, including Greenland and the Arctic region in general. In order to improve response times as well as effectiveness, enhanced surveillance capabilities are essential for detecting and tracking potential threats. Moreover, such capabilities are also important for search and rescue, and many other civilian use cases are consistent with the intention to ensure that applied technologies for defense purposes have dual-use capabilities and can also be used for civilian purposes.
There are more cyber threats than ever before. These threats are getting increasingly sophisticated with the advance of AI and digitization in general. So, it is not surprising that cybersecurity technologies are also an important topic in the agreement. The increasing threat of cyber attacks, particularly against critical infrastructure and often initiated by hostile state actors, necessitates a robust cybersecurity defense in order to protect our critical infrastructure and the sensitive information it typically contains. This includes implementing advanced encryption, intrusion detection systems, and secure communication networks to safeguard against cyber threats.
The defense agreement also highlights the importance of having access to unmanned systems or drones. There are quite a few examples of such systems as discussed in some detail above, and can be found in my more extensive article “Stratospheric Drones & Low Earth Satellites: Revolutionizing Terrestrial Rural Broadband from the Skies?“. There are two categories of drones that may be interesting. One is the unmanned version that typically is remotely controlled in an operations center at a distance from the actual unmanned platform. The other is the autonomous (or semi-autonomous) drone version that is enabled by AI and many integrated sensors to operate independently of direct human control or at least largely without real-time human intervention. Examples such as Unmanned Vehicles (UVs) and Autonomous Vehicles (AVs) are typically associated with underwater (UUV/UAV) or aerial (UAV/AAV) platforms. This kind of technology provides versatile, very flexible surveillance & reconnaissance, and defense platforms that are not reliant on a large staff of experts to operate. They are particularly valuable in the Arctic region, where harsh environmental conditions can limit the effectiveness of manned missions.
The development and deployment of dual-use technologies are also emphasized in the agreement. These technologies, which have both civilian and military applications, are necessary for maximizing the return on investment in defense infrastructure. It may also, at the moment, be easier to find funding if it is defense-related. Technology examples include advancements in satellite communications and broadband networks, enhancing military capabilities, and civilian connectivity, particularly how those various communications technologies can seamlessly integrate with one another is very important.
Furthermore, artificial intelligence (AI) has been identified as a transformative technology for defense and security. While AI is often referred to as a singular technology. However, it is actually an umbrella term that encompasses a broad spectrum of frameworks, tools, and techniques that have a common basis in models that are being trained on large (or very large) sets of data in order to offer various predictive capabilities of increasing sophistication. This leads to the expectation that, for example, AI-driven analytics and decision-making applications will enhance the operational efficiency and, not unimportantly, the quality of real-time decision-making in the field (which may or may not be correct and for sure may be somewhat optimistic expectations at least at a basic level). AI-enabled defense platforms or applications are likely to result in improved threat detection as well as being able to support strategic planning. As long as the risk of false outcomes is acceptable, such a system will enrich the defense systems and provide significant advantages in managing complex and highly dynamic security environments and time-critical threat scenarios.
Lastly, the agreement stresses the need for advanced logistics and supply chain technologies. Efficient logistics are critical for sustaining military operations and ensuring the timely delivery of equipment and supplies. Automation, real-time tracking, and predictive analytics in logistics management can significantly improve the resilience and responsiveness of defense operations.
AT THIS POINT IN MY GREENLANDIC JOURNEY.
In my career, I have designed, planned, built, and operated telecommunications networks in many places under vastly different environmental conditions (e.g., geography and climate). The more I think about building robust and highly reliable communication networks in Greenland, including all the IT & compute enablers required, the more I appreciate how challenging and different it is to do so in Greenland. Tusass has built a robust and reliable transport network connecting nearly all settlements in Greenland down to the smallest size. Tusass operates and maintains this network under some of the harshest environmental conditions in the world, with an incredible dedication to all those settlements that depend on being connected to the outside world and where a compromised connection may have dire consequences for the unconnected community.
Figure 18 Shows a coastal radio site in Greenland. It illustrates one of the frequent issues of the critical infrastructure being covered by ice as well as snow. Courtesy: Tusass A/S (Greenland),
Comparing the capital spending level of Tusass in Greenland with the averages of other Western European countries, we find that Tusass does not invest significantly more of its revenue than the telco industry’s country averages of many other Western European countries. In fact, its 5-year average Capex to Revenue ratio is close to the Western European country average (19% over the period 2019 to 2023). In terms of capital investments compared to the revenue generating units (RGUs), Tusass does have the highest level of 18.7 euros per RGU per month, based on a 5-year average over the period 2019 to 2023, in comparison with the average of several Western European markets, coming out at 6.6 euros per RGU per month, as shown in the chart below. This difference is not surprising when considering the available population in Greenland compared to the populations in the countries considered in the comparison. The variation of capital investments for Tusass also shows a much larger variation than other countries due to substantially less population to bear the burden of financing big capital-intensive projects, such as the deployment of new submarine cables (e.g., typically coming out at 30 to 50 thousand euros per km), new satellite connections (normally 10+ million euros depending on the asset arrangement), RAN modernization (e.g., 5G), and so forth … For example, the average absolute capital spend was 14.0±1.5 million euros between 2019 and 2022, while 2023 was almost 40 million euros (a little less than 4% of the annual defense and security budget of Denmark) due to, according with Tusass annual report, RAN modernization (e.g., 5G), satellite (e.g., Greensat) and submarine cable investments (initial seabed investigation). All these investments bring better quality through higher reliability, integrity, and availability of Greenland’s critical communications infrastructure although there are not a large population (e.g., millions) to spread such these substantial investments over.
Figure 19 In a Western European context, Greenland does not, on average, invest substantially more in telecom infrastructure relative to its revenues and revenue-generating units (i.e., its customer service subscriptions) despite having a very low population of about 57 thousand and an area of 2.2 million square kilometers, the size of Alaska and only 33% smaller than India. The chart shows the country’s average Capex to Revenue ratio and the Capex in euros per RGU per month over the last 5 years (2019 to 2023) for Greenland (e.g., Tusass annual reports) and Western Europe (using data from New Street Research).
The capital investments required to leapfrog Greenland’s communications network availability and redundancy scores beyond 70% (versus 53% and 44%, respectively, in 2023) would be very substantial, requiring both additional microwave connections (including redesigns), submarine cables, and new satellite arrangements, and new ground stations (e.g., to or in settlements with more than a population of 1,000 inhabitants).
Those investments would serve the interests of the Greenlandic society and that of Denmark and NATO in terms of boosting the defense and security of Greenland, which is also consistent with all the relevant parties’ expressed intent of securitization of Greenland. The required capital investments related to further leapfrogging the safety, availability, and reliability, above and beyond the current plans, of the critical communications infrastructure would be far higher than previously capital spend levels by Tusass (and Greenland) and unlikely to be economically viable using conventional business financial metrics (e.g., net present value NPV > 0 and internal rate of return IRR > a given hurdle rate). The investment needs to be seen as geopolitical relevant for the security & safety of Greenland, and with a strong focus on dual-use technologies, also as beneficial to the Greenlandic society.
Even with unlimited funding and financing to enhance Greenland’s safety and security, the challenging weather conditions and limited availability of skilled resources mean that it will take considerable time to successfully complete such an extensive program. Designing, planning and building a solid defense and security architecture meaningful to Greenlandic conditions will take time. Though, I am also convinced that there are already pieces of the puzzle operational today that is important any future work.
Figure 18 An aerial view of one of Tusass’s west coast sites supporting coastal radio as well as hosting one of the many long-haul microwave sites along the west coast of Greenland. Courtesy: Tusass A/S (Greenland).
RECOMMENDATIONS.
A multifaceted approach is essential to ensure that Greenland’s strategic and infrastructure development aligns with its unique geographical and geopolitical context.
Firstly, Greenland should prioritize the development of dual-use critical infrastructure and the supporting architectures that can serve both civilian and defense (& military) purposes. For example expanding and upgrading airport facilities (e.g., as is happening with the new airport in Nuuk), enhancing broadband internet access (e.g., as Tusass is very much focusing on adding more submarine cables and satellite coverage), and developing advanced integrated communication platforms like satellite-based and unmanned aerial systems (UAS), such as payload agnostic stratospheric high altitude platforms (HAPs). Such dual-use infrastructure platforms could bolster the national security. Moreover it could support economic activities that would improve community connectivity, and enhance the quality of life for Greenland’s residents irrespective of where they live in Greenland. There is little doubt that securing funding from international allies (e.g., European Union, NATO, …) and public-private partnerships will be crucial in supporting the financing of these projects. Also ensuring that civil and defense needs are met efficiently and with the right balance.
Additionally, it is important to invest in critical enablers like advanced monitoring and surveillance technologies for the security & safety. Greenland should in particular focus on satellite monitoring, Distributed Acoustic Sensing (DAS) on its submarine cables, and Unmanned Vehicles for Underwater and Aerial applications (e.g., UUVs & UAVs). Such systems will enable a more comprehensive monitoring of activities around and over Greenland. This would allow Greenland to secure its maritime routes, and protecting Greenland’s natural resources (among other things). Enhanced surveillance capabilities will also provide multi-dimensional real-time data for national security, environmental monitoring, and disaster response scenarios. Collaborating with NATO and other international partners should focus on sharing technology know-how, expertise in general, and intelligence that will ensure that Greenland’s surveillance capabilities are on par with global standards.
Tusass’s transport network connecting (almost) all of Greenland’s settlements is an essential and critical asset for Greenland. It should be the backbone for any dual-use enhancement serving civil as well as defense scenarios. Adding additional submarine cables and more satellite connections are important (on-going) parts of those enhancements and will substantially increase both the network availability, resilience and hardening to disruptions natural as well as man-made kinds. However, increasing the communications networks ability to fully, or even partly, function in case of network parts being cut off from a few main switching centers may be something that could be considered. With todays technologies might also be affordable to do and fit well with Tusass’s multi-dimensional connectivity strategy using terrestrial means (e.g., microwave connections), sub-marine cables and satellites.
Last but not least, considering Greenland’s limited human resources, the technologies and advanced platforms implemented must have a large degree of autonomy and self-reliance. This will likely only be achieved with solid partnerships and strong alliances with Denmark and other natural allies, including the Nordic countries in and near the Arctic Circle (e.g., Island, Faroe Island, Norway, Sweden, Finland, The USA, and Canada). In particular, Norway has had recent experience with the dual use of ad-hoc and private 5G networking for defense applications. Joint operation of UUV and UAVs integrated with DAS and satellite constellation could be operated within the Arctic Circle. Developing and implementing advanced AI-based technologies should be a priority. Such collaborations could also make these advanced technologies much more affordable than if only serving one country. These technologies can compensate for the sparse population and vast geographical challenges that Greenland and the larger Arctic Circle pose, providing efficient and effective infrastructure management, surveillance, and economic development solutions. Achieving a very high degree of autonomous operation of the multi-dimensional technology landscape required for leapfrogging the security of Greenland, the Greenlandic Society, and its critical infrastructure would be essential for Greenland to be self-reliant and less dependent on substantial external resources that may be problematic to guaranty in times of crisis.
By focusing on these recommendations, Greenland can enhance its strategic importance, improve its critical infrastructure resilience, and ensure sustainable economic growth while maintaining its unique environmental heritage.
Being a field technician in Greenland poses some occupational hazards that is unknown in most other places. Apart from the harsh weather, remoteness of many of the infrastructure locations, on many occasions field engineers have encountered hungry polar bears in the field. The polar bear is a very dangerous predator that is always on the look out for its next protein-rich meal.
Trym Eiterjord, “What the 14th Five-Year Plan says about China’s Arctic Interests”, The Arctic Institute, (November 2023). The link also includes references to several other articles related to the China-Arctic relationship from the Arctic Institute China Series 2023.
Deo, Narsingh. “Graph Theory with Applications to Engineering and Computer Science,” Dover Publications. This book is a reasonably accessible starting point for learning more about graphs. If this is new to you, I recommend going for the following Geeks for Geeks ” Introduction to Graph Data Structure” (April 2024), which provides a quick intro to the world of graphs.
The State Council Information Office of the People’s Republic of China, “China’s Arctic Policy”, (January 2018).
ACKNOWLEDGEMENT.
I greatly acknowledge my wife, Eva Varadi, for her support, patience, and understanding during the creative process of writing this article. I am incredible thankful to Tusass for providing many great pictures used in the post that illustrates the (good weather!) conditions that Tusass field technicians are faced with in the field working tirelessly on the critical communications infrastructure throughout Greenland. While the pictures shown in this post are really beautiful and breathtaking, the weather is unforgiven frequently stranding field workers for days at some of those remote site locations. Add to this picture the additional dangers of a hungry polar bear that will go to great length getting its weekly protein intake.
“From an economic and customer experience standpoint, deploying stratospheric drones may be significantly more cost effective than establishing extra terrestrial infrastructures”.
As a mobile cellular industry expert and a techno-economist, the first time I was presented with the concept of stratospheric drones, I feel the butterflies in my belly. That tingling feeling that I was seeing something that could be a huge disruptor of how mobile cellular networks are being designed and built. Imagine getting rid of the profitability-challenged rural cellular networks (i.e., the towers, the energy consumption, the capital infrastructure investments), and, at the same time, offering much better quality to customers in rural areas than is possible with the existing cellular network we have deployed there. A technology that could fundamentally change the industry’s mobile cellular cost structure for the better at a quantum leap in quality and, in general, provide economical broadband services to the unconnected at a fraction of the cost of our traditional ways of building terrestrial cellular coverage.
Back in 2015, I got involved with Deutsche Telekom AG Group Technology, under the leadership of Bruno Jacobfeuerborn, in working out the detailed operational plans, deployment strategies, and, of course, the business case as well as general economics of building a stratospheric cellular coverage platform from scratch with the UK-based Stratospheric Platform Ltd [2] in which Deutsche Telekom is an investor. The investment thesis was really in the way we expected the stratospheric high-altitude platform to make a large part of mobile operators’ terrestrial rural cellular networks obsolete and how it might strengthen mobile operator footprints in countries where rural and remote coverage was either very weak or non-existing (e.g., The USA, an important market for Deutsche Telekom AG).
At the time, our thoughts were to have an operational stratospheric coverage platform operationally by 2025, 10 years after kicking off the program, with more than 100 high-altitude platforms covering a major Western European country serving rural areas. As it so often is, reality is unforgiving, as it often is with genuinely disruptive ideas. Getting to a stage of deployment and operation at scale of a high-altitude platform is still some years out due to the lack of maturity of the flight platform, including regulatory approvals for operating a HAP network at scale, increasing the operating window of the flight platform, fueling, technology challenges with the advanced antenna system, being allowed to deployed terrestrial-based cellular spectrum above terra firma, etc. Many of these challenges are progressing well, although slowly.
Globally, various companies are actively working on developing stratospheric drones to enhance cellular coverage. These include aerospace and defense giants like Airbus, advancing its Zephyr drone, and BAE Systems, collaborating with Prismatic for their PHASA-35 UAV. One of the most exciting HAPS companies focusing on developing world-leading high-altitude aircraft that I have come across during my planning work on how to operationalize a Stratospheric cellular coverage platform is the German company Leichtwerk AG, which has their hydrogen-fueled StratoStreamer as well as a solar-powered platform under development with the their StratoStreamer being close to production-ready. Telecom companies like Deutsche Telekom AG and BT Group are experimenting with hydrogen-powered drones in partnership with Stratospheric Platforms Limited. Through its subsidiary HAPSMobile, SoftBank is also a significant player with its Sunglider project. Additionally, entities like China Aerospace Science and Technology Corporation and Cambridge Consultants contribute to this field by co-developing enabling technologies (e.g., advanced phased-array antenna, fuel technologies, material science, …) critical for the success and deployability of high-altitude platforms at scale, aiming to improve connectivity in rural, remote, and underserved areas.
The work on integrating High Altitude Platform (HAP) networks with terrestrial cellular systems involves significant coordination with international regulatory bodies like the International Telecommunication Union Radiocommunication Sector (ITU-R) and the World Radiocommunication Conference (WRC). This process is crucial for securing permission to reuse terrestrial cellular spectrum in the stratosphere. Key focus areas include negotiating the allocation and management of frequency bands for HAP systems, ensuring they don’t interfere with terrestrial networks. These efforts are vital for successfully deploying and operating HAP systems, enabling them to provide enhanced connectivity globally, especially in rural areas where terrestrial cellular frequencies are already in use and remote and underserved regions. At the latest WRC-2023 conference, Softbank successfully gained approval within the Asia-Pacific region to use mobile spectrum bands for stratospheric drone-based mobile broadband cellular services.
Most mobile operators have at least 50% of their cellular network infrastructure assets in rural areas. While necessary for providing the coverage that mobile customers have come to expect everywhere, these sites carry only a fraction of the total mobile traffic. Individually, rural sites have poor financial returns due to their proportional operational and capital expenses.
In general, the Opex of the cellular network takes up between 50% and 60% of the Technology Opex, and at least 50% of that can be attributed to maintaining and operating the rural part of the radio access network. Capex is more cyclical than Opex due to, for example, the modernization of radio access technology. Nevertheless, over a typical modernization cycle (5 to 7 years), the rural network demands a little bit less but a similar share of Capex overall as for Opex. Typically, the Opex share of the rural cellular network may be around 10% of the corporate Opex, and its associated total cost is between 12% and 15% of the total expenses.
The global telecom towers market size in 2023 is estimated at ca. 26+ billion euros, ca. 2.5% of total telecom turnover, with a projected growth of CAGR 3.3% from now to 2030. The top 10 Tower management companies manage close to 1 million towers worldwide for mobile CSPs. Although many mobile operators have chosen to spin off their passive site infrastructure, there are still some remaining that may yet to spin off their cellular infrastructure to one of many Tower management companies, captive or independent, such as American Tower (224,019+ towers), Cellnex Telecom (112,737+ towers), Vantage Towers (46,100+ towers), GD Towers (+41,600 towers), etc…
IMAGINE.
Focusing on the low- or no-profitable rural cellular coverage.
Imagine an alternative coverage technology to the normal cellular one all mobile operators are using that would allow them to do without the costly and low-profitable rural cellular network they have today to satisfy their customers’ expectations of high-quality ubiquitous cellular coverage.
For the alternative technology to be attractive, it would need to deliver at least the same quality and capacity as the existing terrestrial-based cellular coverage for substantially better economics.
If a mobile operator with a 40% EBITDA margin did not need its rural cellular network, it could improve its margin by a sustainable 5% and increase its cash generation in relative terms by 50% (i.e., from 0.2×Revenue to 0.3×Revenue), assuming a capex-to-revenue ratio of 20% before implementing the technology being reduced to 15% after due to avoiding modernization and capacity investments in the rural areas.
Imagine that the alternative technology would provide a better cellular quality to the consumer for a quantum leap reduction of the associated cost structure compared to today’s cellular networks.
Such an alternative coverage technology might also impact the global tower companies’ absolute level of sustainable tower revenues, with a substantial proportion of revenue related to rural site infrastructure being at risk.
Figure 1 An example of an unmanned autonomous stratospheric coverage platform. Source: Cambridge Consultants presentation (see reference [2]) based on their work with Stratospheric Platforms Ltd (SPL) and SPL’s innovative high-altitude coverage platform.
TERRESTRIAL CELLULAR RURAL COVERAGE – A MATTER OF POOR ECONOMICS.
When considering the quality we experience in a terrestrial cellular network, a comprehensive understanding of various environmental and physical factors is crucial to predicting the signal quality accurately. All these factors generally work against cellular signal propagation regarding how far the signal can reach from the transmitting cellular tower and the achievable quality (e.g., signal strength) that a customer can experience from a cellular service.
Firstly, the terrain plays a significant role. Rural landscapes often include varied topographies such as hills, valleys, and flat plains, each affecting signal reach differently. For instance, hilly or mountainous areas may cause signal shadowing and reflection, while flat terrains might offer less obstruction, enabling signals to travel further.
At higher frequencies (i.e., above 1 GHz), vegetation becomes an increasingly critical factor to consider. Trees, forests, and other dense foliage can absorb and scatter radio waves, attenuating signals. The type and density of vegetation, along with seasonal changes like foliage density in summer versus winter, can significantly impact signal strength.
The height and placement of transmitting and receiving antennas are also vital considerations. In rural areas, where there are fewer tall buildings, the height of the antenna can have a pronounced effect on the line of sight and, consequently, on the signal coverage and quality. Elevated antennas mitigate the impact of terrain and vegetation to some extent.
Furthermore, the lower density of buildings in rural areas means fewer reflections and less multipath interference than in urban environments. However, larger structures, such as farm buildings or industrial facilities, must be factored in, as they can obstruct or reflect signals.
Finally, the distance between the transmitter and receiver is fundamental to signal propagation. With typically fewer cell towers spread over larger distances, understanding how signal strength diminishes with distance is critical to ensuring reliable coverage at a high quality, such as high cellular throughput, as the mobile customer expects.
The typical way for a cellular operator to mitigate the environmental and physical factors that inevitably result in loss of signal strength and reduced cellular quality (i.e., sub-standard cellular speed) is to build more sites and thus incur increasing Capex and Opex in areas that in general will have poor economical payback associated with any cellular assets. Thus, such investments make an already poor economic situation even worse as the rural cellular network generally would have very low utilization.
Figure 2 Cellular capacity or quality measured by the unit or total throughput is approximately driven by the amount of spectrum (in MHz) times the effective spectral efficiency (in Mbps/MHz/units) times the number of cells or capacity units deployed. When considering the effective spectral efficiency, one needs to consider the possible “boost” that a higher order MiMo or Advanced Antenna System will bring over and above the Single In Single Out (SISO) antenna would result in.
As our alternative technology also would need to provide at least the same quality and capacity it is worth exploring what can be expected in terms of rural terrestrial capacity. In general, we have that the cellular capacity (and quality) can be written as (also shown in Figure 2 above):
Throughput (in Mbps)= Spectral Bandwidth in MHz × Effective Spectral Efficiency in Mbps/MHz/Cell × Number of Cells
We need to keep in mind that an additional important factor when considering quality and capacity is that the higher the operational frequency, the lower the radius (all else being equal). Typically, we can improve the radius at higher frequencies by utilizing advanced antenna beam forming, that is, concentrate the radiated power per unit coverage area, which is why you will often hear that the 3.6 GHz downlink coverage radius is similar to that of 1800 MHz (or PCS). This 3.6 GHz vs. 1.8 GHz coverage radius comparison is made when not all else is equal. Comparing a situation where the 1800 MHz (or PCS) radiated power is spread out over the whole coverage area compared to a coverage situation where the 3.6 GHz (or C-band in general) solution makes use of beamforming, where the transmitted energy density is high, allowing to reach the customer at a range that would not be possible if the 3.6 GHz radiated power would have been spread out over the cell like the example of the 1800 MHz.
As an example, take an average Western European rural 5G site with all cellular bands between 700 and 2100 MHz activated. The site will have a total of 85 MHz DL and 75 MHz UL, with a 10 MHz difference between DL and UL due to band 38 Supplementary Downlink SDL) operational on the site. In our example, we will be optimistic and assume that the effective spectral efficiency is 2 Mbps per MHz per cell (average over all bands and antenna configurations), which would indicate a fair amount of 4×4 and 8×8 MiMo antenna systems deployed. Thus, the unit throughput we would expect to be supplied by the terrestrial rural cell would be 170 Mbps (i.e., 85 MHz × 2.0 Mbps/MHz/Cell). With a rural cell coverage radius between 2 and 3 km, we then have an average throughput per square kilometer of 9 Mbps/km2. Due to the low demand and high-frequency bandwidth per active customer, DL speeds exceeding 100+ Mbps should be relatively easy to sustain with 5G standalone, with uplink speeds being more compromised due to larger coverage areas. Obviously, the rural quality can be improved further by deploying advanced antenna systems and increasing the share of higher-order MiMo antennas in general, as well as increasing the rural site density. However, as already pointed out, this would not be an economically reasonable approach.
THE ADVANTAGE OF SEEING FROM ABOVE.
Figure 3 illustrates the difference between terrestrial cellular coverage from a cell tower and that of a stratospheric drone or high-altitude platform (“Antenna-in-the-Sky”). The benefit of seeing the world from above is that environmental and physical factors have substantially less impact on signal propagation and quality primarily being impacted by distance as it approximates free space propagation. This situation is very different for a terrestrial-based cellular tower with its radiated signal being substantially impacted by the environment as well as physical factors.
It may sound silly to talk about an alternative coverage technology that could replace the need for the cellular tower infrastructure that today is critical for providing mobile broadband coverage to, for example, rural areas. What alternative coverage technologies should we consider?
If, instead of relying on terrestrial-based tower infrastructure, we could move the cellular antenna and possibly the radio node itself to the sky, we would have a situation where most points of the ground would be in the line of sight to the “antenna-in-the-sky.” The antenna in the sky idea is a game changer in terms of coverage itself compared to conventional terrestrial cellular coverage, where environmental and physical factors dramatically reduce signal propagation and signal quality.
The key advantage of an antenna in the sky (AIS) is that the likelihood of a line-of-sight to a point on the ground is very high compared to establishing a line-of-sight for terrestrial cellular coverage that, in general, would be very low. In other words, the cellular signal propagation from an AIS closely approximates that of free space. Thus, all the various environmental signal loss factors we must consider for a standard terrestrial-based mobile network do not apply to our antenna in the sky.
Over the last ten years, we have gotten several technology candidates for our antenna-in-the-sky solution, aiming to provide terrestrial broadband services as a substitute, or enhancement, for terrestrial mobile and fixed broadband services. In the following, I will describe two distinct types of antenna-in-the-sky solutions: (a) Low Earth Orbit (LEO) satellites, operating between 500 to 2000 km above Earth, that provide terrestrial broadband services such as we know from Starlink (SpaceX), OneWeb (Eutelsat Group), and Kuiper (Amazon), and (b) So-called, High Altitude Platforms (HAPS), operating at altitudes between 15 to 30 km (i.e., in the stratosphere). Such platforms are still in the research and trial stages but are very promising technologies to substitute or enhance rural network broadband services. The HAP is supposed to be unmanned, highly autonomous, and ultimately operational in the stratosphere for an extended period (weeks to months), fueled by green hydrogen and possibly solar. The high-altitude platform is thus also an unmanned aerial vehicle (UAV), although I will use the term stratospheric drone and HAP interchangeably in the following.
Low Earth Orbit (LEO) satellites and High Altitude Platforms (HAPs) represent two distinct approaches to providing high-altitude communication and observation services. LEO satellites, operating between 500 km and 2,000 km above the Earth, orbit the planet, offering broad global coverage. The LEO satellite platform is ideal for applications like satellite broadband internet, Earth observation, and global positioning systems. However, deploying and maintaining these satellites involves complex, costly space missions and sophisticated ground control. Although, as SpaceX has demonstrated with the Starlink LEO satellite fixed broadband platform, the unitary economics of their satellites significantly improve by scale when the launch cost is also considered (i.e., number of satellites).
Figure 4 illustrates a non-terrestrial network architecture consisting of a Low Earth Orbit (LEO) satellite constellation providing fixed broadband services to terrestrial users. Each hexagon represents a satellite beam inside the larger satellite coverage area. Note that, in general, there will be some coverage overlap between individual satellites, ensuring a continuous service including interconnected satellites. The user terminal (UT) dynamically aligns itself, aiming at the best quality connection provided by the satellites within the UT field of vision.
Figure 4 Illustrating a Non-Terrestrial Network consisting of a Low Earth Orbit (LEO) satellite constellation providing fixed broadband services to terrestrial users (e.g., Starlink, Kuiper, OneWeb,…). Each hexagon represents a satellite beam inside the larger satellite coverage area. Note that, in general, there will be some coverage overlap between individual satellites, ensuring a continuous service. The operating altitude of a LEO satellite constellation is between 300 and 2,000 km. It is assumed that the satellites are interconnected, e.g., laser links. The User Terminal antenna (UT) is dynamically orienting itself after the best line-of-sight (in terms of signal quality) to a satellite within UT’s field-of-view (FoV). The FoV has not been shown in the picture above so as not to overcomplicate the illustration. It should be noted just like with the drone it is possible to integrate the complete gNB on the LEO satellite. There might even be applications (e.g., defense, natural & unnatural disaster situations, …) where a standalone 5G SA core is integrated.
On the other hand, HAPs, such as unmanned (autonomous) stratospheric drones, operate at altitudes of approximately 15 km to 30 km in the stratosphere. Unlike LEO satellites, the stratospheric drone can hover or move slowly over specific areas, often geostationary relative to the Earth’s surface. This characteristic makes them more suitable for localized coverage tasks like regional broadband, surveillance, and environmental monitoring. The deployment and maintenance of the stratospheric drones are managed from the Earth’s surface and do not require space launch capabilities. Furthermore, enhancing and upgrading the HAPs is straightforward, as they will regularly be on the ground for fueling and maintenance. Upgrades are not possible with an operational LEO satellite solution where any upgrade would have to wait on a subsequent generation and new launch.
Figure 5 illustrates the high-level network architecture of an unmanned autonomous stratospheric drone-based constellation providing terrestrial cellular broadband services to terrestrial mobile users delivered to their normal 5G terminal equipment. Each hexagon represents a beam arising from the phased-array antenna integrated into the drone’s wingspan. To deliver very high-availability services to a rural area, one could assign three HAPs to cover a given area. The drone-based non-terrestrial network is drawn consistent with the architectural radio access network (RAN) elements from Open RAN, e.g., Radio Unit (RU), Distributed Unit (DU), and Central Unit (CU). It should be noted that the whole 5G gNB (the 5G NodeB), including the CU, could be integrated into the stratospheric drone, and in fact, so could the 5G standalone (SA) packet core, enabling full private mobile 5G networks for defense and disaster scenarios or providing coverage in very remote areas with little possibility of ground-based infrastructure (e.g., the arctic region, or desert and mountainous areas).
Figure 5 illustrates a Non-Terrestrial Network consisting of a stratospheric High Altitude Platform (HAP) drone-based constellation providing terrestrial Cellular broadband services to terrestrial mobile users delivered to their normal 5G terminal equipment. Each hexagon represents a beam inside the larger coverage area of the stratospheric drone. To deliver very high-availability services to a rural area, one could assign three HAPs to cover a given area. The operating altitude of a HAP constellation is between 10 to 50 km with an optimum of around 20 km. It is assumed that there is inter-HAP connectivity, e.g., via laser links. Of course, it is also possible to contemplate having the gNB (full 5G radio node) in the stratospheric drone entirely, which would allow easier integration with LEO satellite backhauls, for example. There might even be applications (e.g., defense, natural & unnatural disaster situations, …) where a standalone 5G SA core is integrated.
The unique advantage of the HAP operating in the stratosphere is (1) The altitude is advantageous for providing wider-area cellular coverage with a near-ideal quality above and beyond what is possible with conventional terrestrial-based cellular coverage because of very high line-of-sight likelihood due to less environment and physical issues that substantially reduces the signal propagation and quality of a terrestrial coverage solution, and (2) More stable atmospheric conditions characterize the stratosphere compared to the troposphere below it. This stability allows the stratospheric drone to maintain a consistent position and altitude with less energy expenditure. The stratosphere offers more consistent and direct sunlight exposure for a solar-powered HAP with less atmospheric attenuation. Moreover, due to the thinner atmosphere at stratospheric altitudes, the stratospheric drone will experience a lower air resistance (drag), increasing the energy efficiency and, therefore, increasing the operational airtime.
Figure 6 illustrates Leichtwerk AG’s StratoStreamer HAP design that is near-production ready. Leichtwerk AG works closely together with AESA towards the type certificate that would make it possible to operationalize a drone constellation in Europe. The StratoStreamer has a wingspan of 65 meter and can carry a payload of 100+ kg. Courtesy: Leichtwerk AG.
Each of these solutions has its unique advantages and limitations. LEO satellites provide extensive coverage but come with higher operational complexities and costs. HAPs offer more focused coverage and are easier to manage, but they need the global reach of LEO satellites. The choice between these two depends on the specific requirements of the intended application, including coverage area, budget, and infrastructure capabilities.
In an era where digital connectivity is indispensable, stratospheric drones could emerge as a game-changing technology. These unmanned (autonomous) drones, operating in the stratosphere, offer unique operational and economic advantages over terrestrial networks and are even seen as competitive alternatives to low earth orbit (LEO) satellite networks like Starlink or OneWeb.
STRATOSPHERIC DRONES VS TERRESTRIAL NETWORKS.
Stratospheric drones positioned much closer to the Earth’s surface than satellites, provide distinct signal strength and latency benefits. The HAP’s vantage point in the stratosphere (around 20 km above the Earth) ensures a high probability of line-of-sight with terrestrial user devices, mitigating the adverse effects of terrain obstacles that frequently challenge ground-based networks. This capability is particularly beneficial in rural areas in general and mountainous or densely forested areas, where conventional cellular towers struggle to provide consistent coverage.
Why the stratosphere? The stratosphere is the layer of Earth’s atmosphere located above the troposphere, which is the layer where weather occurs. The stratosphere is generally characterized by stable, dry conditions with very little water vapor and minimal horizontal winds. It is also home to the ozone layer, which absorbs and filters out most of the Sun’s harmful ultraviolet radiation. It is also above the altitude of commercial air traffic, which typically flies at altitudes ranging from approximately 9 to 12 kilometers (30,000 to 40,000 feet). These conditions (in addition to those mentioned above) make operating a stratospheric platform very advantageous.
Figure 6 illustrates the coverage fundamentals of (a) a terrestrial cellular radio network with the signal strength and quality degrading increasingly as one moves away from the antenna and (b) the terrestrial coverage from a stratospheric drone (antenna in the sky) flying at an altitude of 15 to 30 km. The stratospheric drone, also called a High-Altitude Platform (HAP), provides near-ideal signal strength and quality due to direct line-of-sight (LoS) with the ground, compared to the signal and quality from a terrestrial cellular site that is influenced by its environment and physical factors and the fact that LoS is much less likely in a conventional terrestrial cellular network. It is worth keeping in mind that the coverage scenarios where a stratospheric drone and a low earth satellite may excel in particular are in rural areas and outdoor coverage in more dense urban areas. In urban areas, the clutter, or environmental features and objects, will make line-of-site more challenging, impacting the strength and quality of the radio signals.
Figure 6 The chart above illustrates the coverage fundamentals of (a) a terrestrial cellular radio network with the signal strength and quality degrading increasingly as one moves away from the antenna and (b) the terrestrial coverage from a stratospheric drone (antenna in the sky) flying at an altitude of 15 to 30 km. The stratospheric drone, also called a High Altitude Platform (HAP), provides near-ideal signal strength and quality due to direct line-of-sight (LoS) with the ground, compared to the signal & quality from a terrestrial cellular site that is influenced by its environment and physical factors and the fact that LoS is much less likely in a conventional terrestrial cellular network.
From an economic and customer experience standpoint, deploying stratospheric drones may be significantly more cost-effective than establishing extensive terrestrial infrastructure, especially in remote or rural areas. The setup and operational costs of cellular towers, including land acquisition, construction, and maintenance, are substantially higher compared to the deployment of stratospheric drones. These aerial platforms, once airborne, can cover vast geographical areas, potentially rendering numerous terrestrial towers redundant. At an operating height of 20 km, one would expect a coverage radius ranging from 20 km up to 500 km, depending on the antenna system, application, and business model (e.g., terrestrial broadband services, surveillance, environmental monitoring, …).
The stratospheric drone-based coverage platform, and by platform, I mean the complete infrastructure that will replace the terrestrial cellular network, will consist of unmanned autonomous drones with a considerable wingspan (e.g., 747-like of ca. 69 meters). For example, European (German) Leichtwerk’s StratoStreamer has a wingspan of 65 meters and a wing area of 197 square meters with a payload of 120+ kg (note: in comparison a Boing 747 has ca. 500+ m2 wing area but its payload is obviously much much higher and in the range of 50 to 60 metric tons). Leichtwerk AG work closely together with AESA in order to achieve the European Union Aviation Safety Agency (EASA) type certificate that would allow the HAPS to integrate into civil airspace (see refs. [34] for what that means).
An advanced antenna system is positioned under the wings (or the belly) of the drone. I will assume that the coverage radius provided by a single drone is 50 km, but it can dynamically be made smaller or larger depending on the coverage scenario and use case. The drone-based advanced antenna system breaks up the coverage area (ca. six thousand five hundred plus square kilometers) into 400 patches (i.e., a number that can be increased substantially), averaging approx. 16 km2 per patch and a radius of ca. 2.5 km. Due to its near-ideal cellular link budget, the effective spectral efficiency is expected to be initially around 6 Mbps per MHz per cell. Additionally, the drone does not have the same spectrum limitations as a rural terrestrial site and would be able to support frequency bands in the downlink from ~900 MHz up to 3.9 GHz (and possibly higher, although likely with different antenna designs). Due to the HAP altitude, the Earth-to-HAP uplink signal will be limited to a lower frequency spectrum to ensure good signal quality is being received at the stratospheric antenna. It is prudent to assume a limit of 2.1 GHz to possibly 2.6 GHz. All under the assumption that the stratospheric drone operator has achieved regulatory approval for operating the terrestrial cellular spectrum from their coverage platform. It should be noted that today, cellular frequency spectrum approved for terrestrial use cannot be used at an altitude unless regulatory permission has been given (more on this later).
Let’s look at an example. We would need ca. 46 drones to cover the whole of Germany with the above-assumed specifications. Furthermore, if we take the average spectrum portfolio of the 3 main German operators, this will imply that the stratospheric drone could be functioning with up to 145 MHz in downlink and at least 55 MHz uplink (i.e., limiting UL to include 2.1 GHz). Using the HAP DL spectral efficiency and coverage area we get a throughput density of 70+ Mbps/km2 and an effective rural cell throughput of 870 Mbps. In terrestrial-based cellular coverage, the contribution to quality at higher frequencies is rapidly degrading as a function of the distance to the antenna. This is not the case for HAP-based coverage due to its near-ideal signal propagation.
In comparison, the three incumbent German operators have on average ca. 30±4k sites per operator with an average terrestrial coverage area of 12 km2 and a coverage radius of ca. 2.0 km (i.e., smaller in cities, ~1.3 km, larger in rural areas, ~2.7 km). Assume that the average cost of ownership related only to the passive part of the site is 20+ thousand euros and that 50% of the 30k sites (expect a higher number) would be redundant as the rural coverage would be replaced by stratospheric drones. Such a site reduction quantum conservatively would lead to a minimum gross monetary reduction of 300 million euros annually (not considering the cost of the alternative technology coverage solution).
In our example, the question is whether we can operate a stratospheric drone-based platform covering rural Germany for less than 300 million euros yearly. Let’s examine this question. Say the stratospheric drone price is 1 million euros per piece (similar to the current Starlink satellite price, excluding the launch cost, which would add another 1.1 million euros to the satellite cost). For redundancy and availability purposes, we assume we need 100 stratospheric drones to cover rural Germany, allowing me to decommission in the radius of 15 thousand rural terrestrial sites. The decommissioning cost and economical right timing of tower contract termination need to be considered. Due to the standard long-term contracts may be 5 (optimistic) to 10+ years (realistic) year before the rural network termination could be completed. Many Telecom businesses that have spun out their passive site infrastructure have done so in mutual captivity with the Tower management company and may have committed to very “sticky” contracts that have very little flexibility in terms of site termination at scale (e.g., 2% annually allowed over total portfolio).
We have a capital expense of 100 million for the stratospheric drones. We also have to establish the support infrastructure (e.g., ground stations, airfield suitability rework, development, …), and consider operational expenses. The ballpark figure for this cost would be around 100 million euros for Capex for establishing the supporting infrastructure and another 30 million euros in annual operational expenses. In terms of steady-state Capex, it should be at most 20 million per year. In our example, the terrestrial rural network would have cost 3 billion euros, mainly Opex, over ten years compared to 700 million euros, a little less than half as Opex, for the stratospheric drone-based platform (not considering inflation).
The economical requirements of a stratospheric unmanned and autonomous drone-based coverage platform should be superior compared to the current cellular terrestrial coverage platform. As the stratospheric coverage platform scales and increasingly more stratospheric drones are deployed, the unit price is also likely to reduce accordingly.
Spectrum usage rights yet another critical piece.
It should be emphasized that the deployment of cellular frequency spectrum in stratospheric and LEO satellite contexts is governed by a combination of technical feasibility, regulatory frameworks, coordination to prevent interference, and operational needs. The ITU, along with national regulatory bodies, plays a central role in deciding the operational possibilities and balancing the needs and concerns of various stakeholders, including satellite operators, terrestrial network providers, and other spectrum users. Today, there are many restrictions and direct regulatory prohibitions in repurposing terrestrially assigned cellular frequencies for non-terrestrial purposes.
The role of the World Radiocommunications Conference (WRC) role is pivotal in managing the global radio-frequency spectrum and satellite orbits. Its decisions directly impact the development and deployment of various radiocommunication services worldwide, ensuring their efficient operation and preventing interference across borders. The WRC’s work is fundamental to the smooth functioning of global communication networks, from television and radio broadcasting to cellular networks and satellite-based services. The WRC is typically held every three to four years, with the latest one, WRC-23, held in Dubai at the end of 2023, reference [13] provides the provisional final acts of WRC-23 (December 2023). In landmark recommendation, WRC-23 relaxed the terrestrial-only conditions for the 698 to 960 MHz and 1,71 to 2.17 GHz, and 2.5 to 2.69 GHz frequency bands to also apply for high-altitude platform stations (HAPS) base stations (“Antennas-in -Sky”). It should be noted that there are slightly different frequency band ranges and conditions, depending on which of the three ITU-R regions (as well as exceptions for particular countries within a region) the system will be deployed in. Also the HAPS systems do not enjoy protection or priority over existing use of those frequency bands terrestrially. It is important to note that the WRC-23 recommendation only apply to coverage platforms (i.e., HAPS) in the range from 20 to 50 km altitude. These WRC-23 frequency-bands relaxation does not apply to satellite operation. With the recognized importance of non-terrestrial networks and the current standardization efforts (e.g., towards 6G), it is expected that the fairly restrictive regime on terrestrial cellular spectrum may be relaxed further to also allow mobile terrestrial spectrum to be used in “Antenna-in-the-Sky” coverage platforms. Nevertheless, HAPS and terrestrial use of cellular frequency spectrum will have to be coordinated to avoid interference and resulting capacity and quality degradation.
SoftBank announced recently (i.e., 28 December 2023 [11]), after deliberations at the WRC-23, that they had successfully gained approval within the Asia-Pacific region (i.e., ITU-R region 3) to use mobile spectrum bands, namely 700-900MHz, 1.7GHz, and 2.5GHz, for stratospheric drone-based mobile broadband cellular services (see also refs. [13]). As a result of this decision, operators in different countries and regions will be able to choose a spectrum with greater flexibility when they introduce HAPS-based mobile broadband communication services, thereby enabling seamless usage with existing smartphones and other devices.
Another example of re-using terrestrial licensed cellular spectrum above ground is SpaceX direct-to-cell capable 2nd generation Starlink satellites.
On January 2nd, 2024, SpaceX launched their new generation of Starlink satellites with direct-to-cell capabilities to close a connection to a regular mobile cellular phone (e.g., smartphone). The new direct-to-cell Starlink satellites use T-Mobile US terrestrial licensed cellular frequency band (i.e., 2×5 MHz Band 25, PCS G-block) and will work, according to T-Mobile US, with most of their existing mobile phones. The initial direct-to-cell commercial plans will only support low-bandwidth text messaging and no voice or more bandwidth-heavy applications (e.g., streaming). Expectations are that the direct-to-cell system would deliver up to 18.3 Mbps (3.66 Mbps/MHz/cell) downlink and up to 7.2 Mbps (1.44 Mbps/MHz/cell) uplink over a channel bandwidth of 5 MHz (maximum).
Given that terrestrial 4G LTE systems struggle with such performance, it will be super interesting to see what the actual performance of the direct-to-cell satellite constellation will be.
COMPARISON WITH LEO SATELLITE BROADBAND NETWORKS.
When juxtaposed with LEO satellite networks such as Starlink (SpaceX), OneWeb (Eutelsat Group), or Kuiper (Amazon), stratospheric drones offer several advantages. Firstly, the proximity to the Earth’s surface (i.e., 300 – 2,000 km) results in lower latency, a critical factor for real-time applications. While LEO satellites, like those used by Starlink, have reduced latency (ca. 3 ms round-trip-time) compared to traditional geostationary satellites (ca. 240 ms round-trip-time), stratospheric drones can provide even quicker response times (one-tenth of an ms in round-trip-time), making the stratospheric drone substantially more beneficial for applications such as emergency services, telemedicine, and high-speed internet services.
A stratospheric platform operating at 20 km altitude and targeting surveillance, all else being equal, would be 25 times better at distinguishing objects apart than an LEO satellite operating at 500 km altitude. The global aerial imaging market is expected to exceed 7 billion euros by 2030, with a CAGR of 14.2% from 2021. The flexibility of the stratospheric drone platform allows for combining cellular broadband services and a wide range of advanced aerial imaging services. Again, it is advantageous that the stratospheric drone regularly returns to Earth for fueling, maintenance, and technology upgrades and enhancements. This is not possible with an LEO satellite platform.
Moreover, the deployment and maintenance of stratospheric drones are, in theory, less complex and costly than launching and maintaining a constellation of satellites. While Starlink and similar projects require significant upfront investment for satellite manufacturing and rocket launches, stratospheric drones can be deployed at a fraction of the cost, making them a more economically viable option for many applications.
The Starlink LEO satellite constellation currently is the most comprehensive satellite (fixed) broadband coverage service. As of November 2023, Starlink had more than 5,000 satellites in low orbit (i.e., ca. 550 km altitude), and an additional 7,000+ are planned to be deployed, with a total target of 12+ thousand satellites. The current generation of Starlink satellites has three downlink phased-array antennas and one uplink phase-array antenna. This specification translates into 48 beams downlink (satellite to ground) and 16 beams uplink (ground to satellite). Each Starlink beam covers approx. 2,800 km2 with a coverage range of ca. 30 km, over which a 250 MHz downlink channel (in the Ku band) has been assigned. According to Portillo et al. [14], the spectral efficiency is estimated to be 2.7 Mbps per MHz, providing a total throughput of a maximum of 675 Mbps in the coverage area or a throughput density of ca. 0.24 Mbps per km2.
According to the latest Q2-2023 Ookla speed test it is found that “among the 27 European countries that were surveyed, Starlink had median download speeds greater than 100 Mbps in 14 countries, greater than 90 Mbps in 20 countries, and greater than 80 in 24 countries, with only three countries failing to reach 70 Mbps” (see reference [18]). Of course, the actual customer experience will depend on the number of concurrent users demanding resources from the LEO satellite as well as weather conditions, proximity of other users, etc. Starlink themselves seem to have set an upper limit of 220 Mbps download speed for their so-called priority service plan or otherwise 100 Mbps (see [19] below). Quite impressive performance if there are no other broadband alternatives available.
According to Elon Musk, SpaceX aims to reduce each Starlink satellite’s cost to less than one million euros. However, according to Elon Musk, the unit price will depend on the design, capabilities, and production volume. The launch cost using the SpaceX Falcon 9 launch vehicle starts at around 57 million euros, and thus, the 50 satellites would add a launch cost of ca. 1.1 million euros per satellite. SpaceX operates, as of September 2023, 150 ground stations (“Starlink Gateways”) globally that continue to connect the satellite network with the internet and ground operations. At Starlink’s operational altitude, the estimated satellite lifetime is between 5 and 7 years due to orbital decay, fuel and propulsion system exhaustion, and component durability. Thus, a LEO satellite business must plan for satellite replacement cycles. This situation differs greatly from the stratospheric drone-based operation, where the vehicles can be continuously maintained and upgraded. Thus, they are significantly more durable, with an expected useful lifetime exceeding ten years and possibly even 20 years of operational use.
Let’s consider our example of Germany and what it would take to provide LEO satellite coverage service targeting rural areas. It is important to understand that a LEO satellite travels at very high speeds (e.g., upwards of 30 thousand km per hour) and thus completes an orbit around Earth in between 90 to 120 minutes (depending on the satellite’s altitude). It is even more important to remember that Earth rotates on its axis (i.e., 24 hours for a full rotation), and the targeted coverage area will have moved compared to a given satellite orbit (this can easily be several hundreds to thousands of kilometers). Thus, to ensure continuous satellite broadband coverage of the same area on Earth, we need a certain number of satellites in a particular orbit and several orbits to ensure continuous coverage at a target area on Earth. We would need at least 210 satellites to provide continuous coverage of Germany. Most of the time, most satellites would not cover Germany, and the operational satellite utilization will be very low unless other areas outside Germany are also being serviced.
Economically, using the Starlink numbers above as a guide, we incur a capital expense of upwards of 450 million euros to realize a satellite constellation that could cover Germany. Let’s also assume that the LEO satellite broadband operator (e.g., Starlink) must build and launch 20 satellites annually to maintain its constellation and thus incur an additional Capex of ca. 40+ million euros annually. This amount does not account for the Capex required to build the ground network and the operations center. Let’s say all the rest requires an additional 10 million euros Capex to realize and for miscellaneous going forward. The technology-related operational expenses should be low, at most 30 million euros annually (this is a guesstimate!) and likely less. So, covering Germany with an LEO broadband satellite platform over ten years would cost ca. 1.3 billion euros. Although substantially more costly than our stratospheric drone platform, it is still less costly than running a rural terrestrial mobile broadband network.
Despite being favorable compared in economic to the terrestrial cellular network, it is highly unlikely to make any operational and economic sense for a single operator to finance such a network, and it would probably only make sense if shared between telecom operators in a country and even more so over multiple countries or states (e.g., European Union, United States, PRC, …).
Despite the implied silliness of a single mobile operator deploying a satellite constellation for a single Western European country (irrespective of it being fairly large), the above example serves two purposes; (1) To illustrates how economically in-efficient rural mobile networks are that a fairly expansive satellite constellation could be more favorable. Keep in mind that most countries have 3 or 4 of them, and (2) It also shows that the for operators to share the economics of a LEO satellite constellation over larger areal footprint may make such a strategy very attractive economically,
Due to the path loss at 550 km (LEO) being substantially higher than at 20 km (stratosphere), all else being equal, the signal quality of the stratospheric broadband drone would be significantly better than that of the LEO satellite. However, designing the LEO satellite with more powerful transmitters and sensitive receivers can compensate for the factor of almost 30 in altitude difference to a certain extent. Clearly, the latency performance of the LEO satellite constellation would be inferior to that of the stratospheric drone-based platform due to the significantly higher operating altitude.
It is, however, the capacity rather than shared cost could be the stumbling block for LEOs: For a rural cellular network or stratospheric drone platform, we see the MNOs effectively having “control” over the capex costs of the network, whether it be the RAN element for a terrestrial network, or the cost of whole drone network (even if it in the future, this might be able to become a shared cost).
However, for the LEO constellation, we think the economics of a single MNO building a LEO constellation even for their own market is almost entirely out of the question (ie multiple €bn capex outlay). Hence, in this situation, the MNOs will rely on a global LEO provider (ie Starlink, or AST Space Mobile) and will “lend” their spectrum to their in their respective geography in order to provide service. Like the HAPs, this will also require further regulatory approvals in order to free up terrestrial spectrum for satellites in rural areas.
We do not yet have the visibility of the payments the LEOs will require, so there is the potential that this could be a lower cost alternative again to rural networks, but as we show below, we think the real limitation for LEOs might not be the shared capacity rental cost, but that there simply won’t be enough capacity available to replicate what a terrestrial network can offer today.
However, the stratospheric drone-based platform provides a near-ideal cellular performance to the consumer, close to the theoretical peak performance of a terrestrial cellular network. It should be emphasized that the theoretical peak cellular performance is typically only experienced, if at all, by consumers if they are very near the terrestrial cellular antenna and in a near free-space propagation environment. This situation is a very rare occurrence for the vast majority of mobile consumers.
Figure 7 summarizes the above comparison between a rural terrestrial cellular network with the non-terrestrial cellular networks such as LEO satellites and Stratospheric drones.
Figure 7 Illustrating a comparison between terrestrial cellular coverage with stratospheric drone-based (“Antenna-in-the-sky”) cellular coverage and Low Earth Orbit (LEO) satellite coverage options.
While the majority of the 5,500+ Starlink constellation is 13 GHz (Ku-band), at the beginning of 2024, Space X launched a few 2nd generation Starlink satellites that support direct connections from the satellite to a normal cellular device (e.g., smartphone), using 5 MHz of T-Mobile USA’s PCS band (1900 MHz). The targeted consumer service, as expressed by T-Mobile USA, is providing texting capabilities over areas with no or poor existing cellular coverage across the USA. This is fairly similar to services at similar cellular coverage areas presently offered by, for example, AST SpaceMobile, OmniSpace, and Lynk Global LEO satellite services with reported maximum speed approaching 20 Mbps. The so-called Direct-2-Device, where the device is a normal smartphone without satellite connectivity functionality, is expected to develop rapidly over the next 10 years and continue to increase the supported user speeds (i.e., utilized terrestrial cellular spectrum) and system capacity in terms of smaller coverage areas and higher number of satellite beams.
Table 1 below provides an overview of the top 10 LEO satellite constellations targeting (fixed) internet services (e.g., Ku band), IoT and M2M services, and Direct-to-Device (or direct-to-cell) services. The data has been compiled from the NewSpace Index website, which should be with data as of 31st of December 2023. The Top-10 satellite constellation rank has been based on the number of launched satellites until the end of 2023. Two additional Direct-2-Cell (D2C or Direct-to-Device, D2D) LEO satellite constellations are planned for 2024-2025. One is SpaceX Starlink 2nd generation, which launched at the beginning of 2024, using T-Mobile USA’s PCS Band to connect (D2D) to normal terrestrial cellular handsets. The other D2D (D2C) service is Inmarsat’s Orchestra satellite constellation based on L-band (for mobile terrestrial services) and Ka for fixed broadband services. One new constellation (Mangata Networks) targeting 5G services. With two 5G constellations already launched, i.e., Galaxy Space (Yinhe) launched 8 LEO satellites, 1,000 planned using Q- and V-bands (i.e., not a D2D cellular 5G service), and OmniSpace launched two satellites and have planned 200 in total. Moreover, currently, there is one planned constellation targeting 6G by the South Korean Hanwha Group (a bit premature, but interesting nevertheless) with 2,000 6G LEO Satellites planned. Most currently launched and planned satellite constellations offering (or plan to provide) Direct-2-Cell services, including IoT and M2M, are designed for low-frequency bandwidth services that are unlikely to compete with terrestrial cellular networks’ quality of service where reasonable good coverage (or better) exists.
In Table 1 below, we then show 5 different services with the key input variables as cell radius, spectral efficiency and downlink spectrum. From this we can derive what the “average” capacity could be per square kilometer of rural coverage.
We focus on this metric as the best measure of capacity available once multiple users are on the service the spectrum available is shared. This is different from “peak” speeds which are only relevant in the case of very few users per cell.
We start with terrestrial cellular today for bands up to 2.1GHz and show that assuming a 2.5km cell radius, the average capacity is equivalent to 11Mbps per sq.km.
For a LEO service using Ku-band, i.e., with 250MHz to an FWA dish, the capacity could be ca. 2Mbps per sq.km.
For a LEO-based D2D device, what is unknown is what the ultimate spectrum allowance could be for satellite services with cellular spectrum bands, and spectral efficiency. Giving the benefit of the doubt on both, but assuming the beam radius is always going to be larger, we can get to an “optimistic” future target of 2Mbps per sq. km, i.e., 1/5th of a rural terrestrial network.
Finally, we show for a stratospheric drone, that given similar cell radius to a rural cell today, but with higher downlink available and greater spectral efficiency, we can reach ca. 55Mbps per sq. km, i.e. 5x what a current rural network can offer.
INTEGRATING WITH 5G AND BEYOND.
The advent of 5G, and eventually 6G, technology brings another dimension to the utility of stratospheric drones delivering mobile broadband services. The high-altitude platform’s ability to seamlessly integrate with existing 5G networks makes them an attractive option for expanding coverage and enhancing network capacity at superior economics, particularly in rural areas where the economics for terrestrial-based cellular coverage tend to be poor. Unlike terrestrial networks that require extensive groundwork for 5G rollout, the non-terrestrial network operator (NTNO) can rapidly deploy stratospheric drones to provide immediate 5G coverage over large areas. The high-altitude platform is also incredibly flexible compared to both LEO satellite constellations and conventional rural cellular network flexibility. The platform can easily be upgraded during its ground maintenance window and can be enhanced as the technology evolves. For example, upgrading to and operationalizing 6G would be far more economical with a stratospheric platform than having to visit thousands or more rural sites to modernize or upgrade the installed active infrastructure.
SUMMARY.
Stratospheric drones represent a significant advancement in the realm of wireless communication. Their strategic positioning in the stratosphere offers superior coverage and connectivity compared to terrestrial networks and low-earth satellite solutions. At the same time, their economic efficiency makes them an attractive alternative to ground-based infrastructures and LEO satellite systems. As technology continues to evolve, these high-altitude platforms (HAPs) are poised to play a crucial role in shaping the future of global broadband connectivity and ultra-high availability connectivity solutions, complementing the burgeoning 5G networks and paving the way for next-generation three-dimensional communication solutions. Moving away from today’s flat-earth terrestrial-locked communication platforms.
The strategic as well as the disruptive potential of the unmanned autonomous stratospheric terrestrial coverage platform is enormous, as shown in this article. It has the potential to make most of the rural (at least) cellular infrastructure redundant, resulting in substantial operational and economic benefits to existing mobile operators. At the same time, the HAPs could, in rural areas, provide much better service overall in terms of availability, improved coverage, and near-ideal speeds compared to what is the case in today’s cellular networks. It might also, at scale, become a serious competitive and economical threat to LEO satellite constellations, such as, for example, Starlink and Kuipers, that would struggle to compete on service quality and capacity compared to a stratospheric coverage platform.
Although the strategic, economic, as well as disruptive potential of the unmanned autonomous stratospheric terrestrial coverage platform is enormous, as shown in this article, the flight platform and advanced antenna technology are still in a relatively early development phase. Substantial regulatory work remains in terms of permitting the terrestrial cellular spectrum to be re-used above terra firma at the “Antenna-in-the-Sky. The latest developments out of WRC-23 for Asia Pacific appear very promising, showing that we are moving in the right direction of re-using terrestrial cellular spectrum in high-altitude coverage platforms. Last but not least, operating an unmanned (autonomous) stratospheric platform involves obtaining certifications as well as permissions and complying with various flight regulations at both national and international levels.
Terrestrial Mobile Broadband Network – takeaway:
It is the de facto practice for mobile cellular networks to cover nearly 100% geographically. The mobile consumer expects a high-quality, high-availability service everywhere.
A terrestrial mobile network has a relatively low area coverage per unit antenna with relatively high capacity and quality.
Mobile operators incur high and sustainable infrastructure costs, especially in rural areas with low or no return on that cost.
Physical obstructions and terrain limit performance (i.e., non-free space characteristics).
Well-established technology with high reliability.
The potential for high bandwidth and low latency in urban areas with high demand may become a limiting factor for LEO satellite constellations and stratospheric drone-based platforms. Thus, it is less likely to provide operational and economic benefits covering high-demand, dense urban, and urban areas.
LEO Satellite Network – takeaway:
The technology is operational and improving. There is currently some competition (e.g., Starlink, Kuiper, OneWeb, etc.) in this space, primarily targeting fixed broadband and satellite backhaul services. Increasingly, new LEO satellite-based business models are launched providing lower-bandwidth cellular-spectrum based direct-to-device (D2D) text, 4G and 5G services to regular consumer and IoT devices (i.e., Starlink, Lynk Global, AST SpaceMobile, OmniSpace, …).
Broader coverage, suitable for global reach. It may only make sense when the business model is viewed from a worldwide reach perspective (e.g., Starlink, OneWeb,…), resulting in much-increased satellite network utilization.
An LEO satellite broadband network can cover a vast area per satellite due to its high altitude. However, such systems are in nature capacity-limited, although beam-forming antenna technologies (e.g., phased array antennas) allow better capacity utilization.
The LEO satellite solutions are best suited for low-population areas with limited demand, such as rural and largely unpopulated areas (e.g., sea areas, deserts, coastlines, Greenland, polar areas, etc.).
Much higher latency compared to terrestrial and drone-based networks.
Less flexible once in orbit. Upgrades and modernization only via replacement.
The LEO satellite has a limited useful operational lifetime due to its lower orbital altitude (e.g., 5 to 7 years).
Lower infrastructure cost for rural coverage compared to terrestrial networks, but substantially higher than drones when targeting regional areas (e.g., Germany or individual countries in general).
Complementary to the existing mobile business model of communications service providers (CSPs) with a substantial business risk to CSPs in low-population areas where little to no capacity limitations may occur.
Requires regulatory permission (authorization) to operate terrestrial frequencies on the satellite platform over any given country. This process is overseen by national regulatory bodies in coordination with the International Telecommunication Union (ITU) as well as national regulators (e.g., FCC in the USA). Satellite operators must apply for frequency bands for uplink and downlink communications and coordinate with the ITU to avoid interference with other satellites and terrestrial systems. In recent years, however, there has been a trend towards more flexible spectrum regulations, allowing for innovative uses of the spectrum like integrating terrestrial and satellite services. This flexibility is crucial in accommodating new technologies and service models.
Operating a LEO satellite constellation requires a comprehensive set of permissions and certifications that encompass international and national space regulations, frequency allocation, launch authorization, adherence to space debris mitigation guidelines, and various liability and insurance requirements.
Both LEO and MEO satellites is likely going to be complementary or supplementary to stratospheric drone-based broadband cellular networks offering high-performing transport solutions and possible even acts as standalone or integrated (with terrestrial networks) 5G core networks or “clouds-in-the-sky”.
Stratospheric Drone-Based Network – takeaway:
It is an emerging technology with ongoing research, trials, and proof of concept.
A stratospheric drone-based broadband network will have lower deployment costs than terrestrial and LEO satellite broadband networks.
In rural areas, the stratospheric drone-based broadband network offers better economics and near-ideal quality than terrestrial mobile networks. In terms of cell size and capacity, it can easily match that of a rural mobile network.
The solution offers flexibility and versatility and can be geographically repositioned as needed. The versatility provides a much broader business model than “just” an alternative rural coverage solution (e.g., aerial imaging, surveillance, defense scenarios, disaster area support, etc.).
Reduced latency compared to LEO satellites.
Also ideal for targeted or temporary coverage needs.
Complementary to the existing mobile business model of communications service providers (CSPs) with additional B2B and public services business potential from its application versatility.
Potential substantial negative impact on the telecom tower business as the stratospheric drone-based broadband network would make (at least) rural terrestrial towers redundant.
May disrupt a substantial part of the LEO satellite business model due to better service quality and capacity leaving the LEO satellite constellations revenue pool to remote areas and specialized use cases.
Requires regulatory permission to operate terrestrial frequencies (i.e., frequency authorization) on the stratospheric drone platform (similar to LEO satellites). Big steps have are already been made at the latest WRC-23, where the frequency bands 698 to 960 MHz, 1710 to 2170 MHz, and 2500 to 2690 MHz has been relaxed to allow for use in HAPS operating at 20 to 50 km altitude (i.e., the stratosphere).
Operating a stratospheric platform in European airspace involves obtaining certifications as well as permissions and (of course) complying with various regulations at both national and international levels. This includes the European Union Aviation Safety Agency (EASA) type certification and the national civil aviation authorities in Europe.
Leichtwerk AG, “High Altitude Platform Stations (HAPS) – A Future Key Element of Broadband Infrastructure” (2023). I recommend to closely follow Leichtwerk AG which is a world champion in making advanced gliding planes. The hydrogen powered StratoStreamer HAP is near-production ready, and they are currently working on a solar-powered platform. Germany is renowned for producing some of the best gliding planes in the world (after WWII Germany was banned from developing and producing aircrafts, military as well as civil. These restrictions was only relaxed in the 60s). Germany has a long and distinguished history in glider development, dating back to the early 20th century. German manufacturers like Schleicher, Schempp-Hirth, and DG Flugzeugbau are among the world’s leading producers of high-quality gliders. These companies are known for their innovative designs, advanced materials, and precision engineering, contributing to Germany’s reputation in this field.
ITU Publication, World Radiocommunications Conference 2023 (WRC-23), Provisional Final Acts, (December 2023). Note1: The International Telecommunication Union (ITU) divides the world into three regions for the management of radio frequency spectrum and satellite orbits: Region 1: includes Europe, Africa, the Middle East west of the Persian Gulf including Iraq, the former Soviet Union, and Mongolia, Region 2: covers the Americas, Greenland, and some of the eastern Pacific Islands, and Region 3: encompasses Asia (excl. the former Soviet Union), Australia, the southwest Pacific, and the Indian Ocean’s islands.
Geoff Huston, “Starlink Protocol Performance” (November 2023). Note 2: The recommendations, such as those designated with “ADD” (additional), are typically firm in the sense that they have been agreed upon by the conference participants. However, they are subject to ratification processes in individual countries. The national regulatory authorities in each member state need to implement these recommendations in accordance with their own legal and regulatory frameworks.
Lynk Global website: https://lynk.world/ (see also FCC Order and Authorization). It should be noted that Lynk can operate within 617 to 960 MHz (Space-to-Earth) and 663 to 915 MHz (Earth-to-Space). However, only outside the USA. Constellation Area: IoT / M2M, Satellite-to-Cellphone, Internet, Direct-to-Cell. 8 LEO satellites out of 10 planned.
Omnispace website: https://omnispace.com/Constellation Area: IoT / M2M, 5G. World’s first global 5G non terrestrial network. Initial support 3GPP-defined Narrow-Band IoT radio interface. Planned 200 LEO and <15 MEO satellites. So far only 2 satellites launched.
NewSpace Index: https://www.newspace.im/ I find this resource having excellent and up-to date information of commercial satellite constellations.
LEOLABS Space visualization – SpaceX Starlink mapping. (deselect “Debris”, “Beams”, and “Instruments”, and select “Follow Earth”). An alternative visualization service for Starlink & OneWeb satellites is the website Satellitemap.space (you might go to settings and turn on signal Intensity which will give you the satellite coverage hexagons).
European Union Aviation Safety Agency (EASA). Note that an EASA-type Type Certificate is a critical document in the world of aviation. This certificate is a seal of approval, indicating that a particular type of aircraft, engine, or aviation component meets all the established safety and environmental standards per EASA’s stringent regulations. When an aircraft, engine, or component is awarded an EASA Type Certificate, it signifies a thorough and rigorous evaluation process that it has undergone. This process assesses everything from design and manufacturing to performance and safety aspects. The issuance of the certificate confirms that the product is safe for use in civil aviation and complies with the necessary airworthiness requirements. These requirements are essential to ensure aircraft operating in civil airspace safety and reliability. Beyond the borders of the European Union, an EASA Type Certificate is also highly regarded globally. Many countries recognize or accept these certificates, which facilitate international trade in aviation products and contribute to the global standardization of aviation safety.
ACKNOWLEDGEMENT.
I greatly acknowledge my wife, Eva Varadi, for her support, patience, and understanding during the creative process of writing this article.
I also greatly appreciate my past collaboration and the many discussions on the topic of Stratospheric Drones in particular and advanced antenna designs and properties in general that I have had with Dr. Jaroslav Holis, Senior R&D Manager (Group Technology, Deutsche Telekom AG) over the last couple of years. When it comes to my early involvement in Stratospheric Drones activities with Group Technology Deutsche Telekom AG, I have to recognize my friend, mentor, and former boss, Dr. Bruno Jacobfeuerborn, former CTO Deutsche Telekom AG and Telekom Deutschland, for his passion and strong support for this activity since 2015. My friend and former colleague Rachid El Hattachi deserves the credit for “discovering” and believing in the opportunities that a cellular broadband-based stratospheric drone brings to the telecom industry.
Many thanks to CEO Dr. Reiner Kickert of Leichtwerk AG for providing some high resolution pictures of his beautiful StratoStreamer.
Thanks to my friend Amit Kerenfor suggesting a great quote that starts this article.
Any errors or unclarities are solely due to myself and not the collaborators and colleagues that have done their best to support this piece.
To my friend Rudolf van der Berg this story is not about how volumetric demand (bytes or bits) results in increased energy consumption (W·h). That notion is silly, as we both “violently” agree on ;-). I recommend that readers also check out Rudolf’s wonderful presentation, “Energy Consumption of the Internet (May 2023),” which he delivered at the RIPE86 student event this year in 2023.
Recently, I had the privilege to watch a presentation by a seasoned executive talk about what his telco company is doing for the environment regarding sustainability and CO2 reduction in general. I think the company is doing something innovative beyond compensating shortfalls with buying certificates and (mis)use of green energy resources.
They replace (reasonably) aggressively their copper infrastructure (country stat for 2022: ~90% of HH/~16% subscriptions) with green sustainable fiber (country stat for 2022: ~78%/~60%). This is an obvious strategy that results in a quantum leap in customer experience potential and helps reduce overall energy consumption resulting from operating the ancient copper network.
Missing a bit imo, was the consideration of and the opportunity to phase out the HFC network (country stat for 2022: ~70%/~60%) and reduce the current HFC+Fibre overbuild of 1.45 and, of course, reduce the energy consumption and operational costs (and complexity) of operating two fixed broadband technologies (3 if we include the copper). However, maybe understandably enough, substantial investments have been made in upgrading to Docsis 3.1. An investment that possibly still is somewhat removed from having been written off.
The “wtf-moment” (in an otherwise very pleasantly and agreeable session) came when the speaker alluded that as part of their sustainability and CO2 reduction strategy, the telco was busy migrating from 4G LTE to 5G with the reasoning that 5G is 90% more energy efficient compared to 4G.
Firstly, it is correct that 5G is (in apples-for-apples comparisons!) ca. 90% more efficient in delivering a single bit compared to 4G. The metric we use is Joules-per-bit or Watts-seconds-per-bit. It is also not uncommon at all to experience Telco executives hinting at the relative greenness of 5G (it is, in my opinion, decidedly not a green broadband communications technology … ).
Secondly, so what! Should we really care about relative energy consumption? After all, we pay for absolute energy consumption, not for whatever relativized measure of consumed energy.
I think I know the answer from the CFO and the in-the-know investors.
If the absolute energy consumption of 5G is higher than that of 4G, I will (most likely) have higher operational costs attributed to that increased power consumption with 5G. If I am not in an apples-for-apples situation, which rarely is the case, and I am anyway really not in, the 5G technology requires substantially more power to provide for new requirements and specifications. I will be worse off regarding the associated cost in absolute terms of money. Unless I also have a higher revenue associated with 5G, I am economically worse off than I was with the older technology.
Having higher information-related energy efficiency in cellular communications systems is a feature of the essential requirement of increasingly better spectral efficiency all else being equal. It does not guarantee that, in absolute monetary terms, a Telco will be better off … far from it!
THE ENERGY OF DELIVERING A BIT.
Energy, which I choose to represent in Joules, is equal to the Power (in Watt or W) that I need to consume per time-unit for a given output unit (e.g., a bit) times the unit of time (e.g., a second) it took to provide the unit.
Take a 4G LTE base station that consumes ca. 5.0kW to deliver a maximum throughput of 160 Mbps per sector (@ 80 MHz per sector). The information energy efficiency of the specific 4G LTE base station (e.g., W·s per bit) would be ca. 10 µJ/bit. The 4G LTE base station requires 10 micro (one millionth) Joules to deliver 1 bit (in 1 second).
In the 5G world, we would have a 5G SA base station, using the same frequency bands as 4G and with an additional 10 MHz @ 700MHz and 100 MHz @ 3.5 GHz included. The 3.5 GHz band is supported by an advanced antenna system (AAS) rather than a classical passive antenna system used for the other frequency bands. This configuration consumes 10 kW with ~40% attributed to the 3.5 GHz AAS, supporting ~1 Gbps per sector (@ 190 MHz per sector). This example’s 5G information energy efficiency would be ca. 0.3 µJ/bit.
In this non-apples-for-apples comparison, 5G is about 30 times more efficient in delivering a bit than 4G LTE (in the example above). Regarding what an operator actually pays for, 5G is twice as costly in energy consumption compared to 4G.
It should be noted that the power consumption is not driven by the volumetric demand but by the time that demand exists and the load per unit of time. Also, base stations will have a power consumption even when idle with the degree depending on the intelligence of the energy management system applied.
So, more formalistic, we have
E per bit = P (in W) · time (in sec) per bit, or in the basic units
J / bit = W·s / bit = W / (bit/s) = W / bps = W / [ MHz · Mbps/MHz/unit · unit-quantity ]
E per bit = P (in W) / [ Bandwidth (in MHz) · Spectral Efficiency (in Mbps/MHz/unit) · unit-quantity ]
It is important to remember that this is about the system spec information efficiency and that there is no direct relationship between the Power that you need and the outputted information your system will ultimately support bit-wise.
and
Thus, the relative efficiency between 4G and 5G is
Currently (i.e., 2023), the various components of the above are approximately within the following ranges.
The power consumption of a 5G RAT is higher than that of a 4G RAT. As we add higher frequency spectrum (e.g., C-band, 6GHz, 23GHz,…) to the 5G RAT, increasingly more spectral bandwidth (B) will be available compared to what was deployed for 4G. This will increase the bit-wise energy efficiency of 5G compared to 4G, although the power consumption is also expected to increase as higher frequencies are supported.
If the bandwidth and system power consumption is the same for both radio access technologies (RATs), then we have the relative information energy efficiency is
Depending on the relative difference in spectral efficiency. 5G is specified and designed to have at least ten times (10x) the spectral efficiency of 4G. If you do the math (assuming apples-to-apples applies), it is no surprise that 5G is specified to be 90% more efficient in delivering a bit (in a given unit of time) compared to 4G LTE.
And just to emphasize the obvious,
RAT refers to the radio access technology, BB is the baseband, freq the cellular frequencies, and idle to the situation where the system is not being utilized.
Volume in Bytes (or bits) does not directly relate to energy consumption. As frequency bands are added to a sector (of a base station), the overall power consumption will increase. Moreover, the more computing is required in the antenna, such as for advanced antenna systems, including massive MiMo antennas, the more power will be consumed in the base station. The more the frequency bands are being utilized in terms of time, the higher will the power consumption be.
Indirectly, as the cellular system is being used, customers consume bits and bytes (=8·bit) that will depend on the effective spectral efficiency (in bps/Hz), the amount of effective bandwidth (in Hz) experienced by the customers, e.g., many customers will be in a coverage situation where they may not benefit for example from higher frequency bands), and the effective time they make use of the cellular network resources. The observant reader will see that I like the term “effective.” The reason is that customers rarely enjoy the maximum possible spectral efficiency. Likely, not all the frequency spectrum covering customers is necessarily being applied to individual customers, depending on their coverage situation.
In the report “A Comparison of the Energy Consumption of Broadband Data Transfer Technologies (November 2021),” the authors show the energy and volumetric consumption of mobile networks in Finland over the period from 2010 to 2020. To be clear, I do not support the author’s assertion of causation between volumetric demand and energy consumption. As I have shown above, volumetric usage does not directly cause a given power consumption level. Over the 10-year period shown in the report, they observe a 70% increase in absolute power consumption (from 404 to 686 GWh, CAGR ~5.5%) and a factor of ~70 in traffic volume (~60 TB to ~4,000 TB, CAGR ~52%). Caution should be made in resisting the temptation to attribute the increase in energy over the period to be directly related to the data volume increase, however weak it is (i.e., note that the authors did not resist that temptation). Rudolf van der Berg has raised several issues with the approach of the above paper (as well as with many other related works) and indicated that the data and approach of the authors may not be reliable. Unfortunately, in this respect, it appears that systematic, reliable, and consistent data in the Telco industry is hard to come by (even if that data should be available to the individual telcos).
Technology change from 2G/3G to 4G, site densification, and more frequency bands can more than easily explain the increase in energy consumption (and all are far better explanations than data volume). It should be noted that there will also be reasons that decrease power consumption over time, such as more efficient electronics (e.g., via modernization), intelligent power management applications, and, last but not least, switching off of older radio access technologies.
The factors that drive a cell site’s absolute energy consumption is
Radio access technology with new technologies generally consumes more energy than older ones (even if the newer technologies have become increasingly more spectrally efficient).
The antenna type and configuration, including computing requirements for advanced signal processing and beamforming algorithms (that will improve the spectral efficiency at the expense of increased absolute energy consumption).
Equipment efficiency. In general, new generations of electronics and systems designs tend to be more energy-efficient for the same level of performance.
Intelligent energy management systems that allow for effective power management strategies will reduce energy consumption compared to what it would have been without such systems.
The network optimization goal policy. Is the cellular network planned and optimized for meeting the demands and needs of the customers (i.e., the economic design framework) or for providing the peak performance to as many customers as possible (i.e., the Umlaut/Ookla performance-driven framework)? The Umlaut/Ookla-optimized network, maxing out on base station configuration, will observe substantially higher energy consumption and associated costs.
The absolute cellular energy consumption has continued to rise as new radio access technologies (RAT) have been introduced irrespective of the leapfrog in those RATS spectral (bits per Hz) and information-related (Joules per bit) efficiencies.
WHY 5G IS NOT A GREEN TECHNOLOGY?
Let’s first re-acquaint ourselves with the 2015 vision of the 5G NGMN whitepaper;
“5G should support a 1,000 times traffic increase in the next ten years timeframe, with energy consumption by the whole network of only half that typically consumed by today’s networks. This leads to the requirement of an energy efficiency increase of x2000 in the next ten years timeframe.” (Section 4.2.2 Energy Efficiency, 5G White Paper by NGMN Alliance, February 2015).
The bold emphasis is my own and not in the paper itself. There is no doubt that the authors of the 5G vision paper had the ambition of making 5G a sustainable and greener cellular alternative than historically had been the case.
So, from the above statement, we have two performance figures that illustrate the ambition of 5G relative to 4G. Firstly, we have a requirement that the 5G energy efficiency should be 2000x higher than 4G (as it was back in the beginning of 2015).
or
if
Getting more spectrum bandwidth is relatively trivial as you go up in frequency and into, for example, the millimeter wave range (and beyond). However, getting 20+ GHz (e.g., 200+x100 MHz @ 4G) of additional practically usable spectrum bandwidth would be rather (=understatement) ambitious.
And that the absolute energy consumption of the whole 5G network should be half of what it was with 4G
If you think about this for a moment. Halfing the absolute energy consumption is an enormous challenge, even if it would have been with the same RAT. It requires innovation leapfrogs across the RAT electronic architecture, design, and material science underlying all of it. In other words, fundamental changes are required in the RF frontend (e.g., Power amplifiers, transceivers), baseband processing, DSP, DAC, ADC, cooling, control and management systems, algorithms, compute, etc…
But reality eats vision for breakfast … There really is no sign that the super-ambitious goal set by the NGMN Alliance in early 2015 is even remotely achievable even if we would give it another ten years (i.e., 2035). We are more than two orders of magnitude away from the visionary target of NGMN, and we are almost at the 10-year anniversary of the vision paper. We more or less get the benefit of the relative difference in spectral efficiency (x10), but no innovation beyond that has contributed very much to quantum leap cellular energy efficiency bit-wise.
I know many operators who will say that from a sustainability perspective, at least before the energy prices went through the roof, it really does not matter that 5G, in absolute terms, leads to substantial increases in energy consumption. They use green energy to supply the energy demand from 5G and pay off $CO_2$ deficits with certificates.
First of all, unless the increased cost can be recovered with the customers (e.g., price plan increase), it is a doubtful economic venue to pursue (and has a bit of a Titanic feel to it … going down together while the orchestra is playing).
Second, we should ask ourselves whether it is really okay for any industry to greedily consume sustainable and still relatively scarce green resources without being incentivized (or encouraged) to pursue alternatives and optimize across mobile and fixed broadband technologies. Particularly when fixed broadband technologies, such as fiber, are available, that would lead to a very sizable and substantial reduction in energy consumption … as customers increasingly adapt to fiber broadband.
Fiber is the greenest and most sustainable access technology we can deploy compared to cellular broadband technologies.
SO WHAT?
5G is a reality. Telcos are and will continue to invest substantially into 5G as they migrate their customers from 4G LTE to what ultimately will be 5G Standalone. The increase in customer experience and new capabilities or enablers are significant. By now, most Telcos will (i.e., 2023) have a very good idea of the operational expense associated with 5G (if not … you better do the math). Some will have been exploring investing in their own green power plants (e.g., solar, wind, hydrogen, etc.) to mitigate part of the energy surge arising from transitioning to 5G.
I suspect that as Telcos start reflecting on Open RAN as they pivot towards 6G (-> 2030+), above and beyond what 6G, as a RAT, may bring of additional operational expense pain, there will be new energy consumption and sustainability surprises to the cellular part of Telcos P&L. In general, breaking up an electronic system into individual (non-integrated) parts, as opposed to being integrated into a single unit, is likely to result in an increased power consumption. Some of the operational in-efficiencies that occur in breaking up a tightly integrated design can be mitigated by power management strategies. Though in order to get such power management strategies to work at the optimum may force a higher degree of supplier uniformity than the original intent of breaking up the tightly integrated system.
However, only Telcos that consider both their mobile and fixed broadband assets together, rather than two silos apart, will gain in value for customers and shareholders. Fixed-mobile (network) conversion should be taken seriously and may lead to very different considerations and strategies than 10+ years ago.
With increasing coverage of fiber and with Telcos stimulating aggressive uptake, it will allow those to redesign the mobile networks for what they were initially supposed to do … provide convenience and service where there is no fixed network present, such as when being mobile and in areas where the economics of a fixed broadband network makes it least likely to be available (e.g., rural areas) although LEO satellites (i.e., here today), maybe stratospheric drones (i.e., 2030+), may offer solid economic alternatives for those places. Interestingly, further simplifying the cellular networks supporting those areas today.
TAKE AWAY.
Volume in Bytes (or bits) does not directly relate to the energy consumption of the underlying communications networks that enable the usage.
The duration, the time scale, of the customer’s usage (i.e., the use of the network resources) does cause power consumption.
The bit-wise energy efficiency of 5G is superior to that of 4G LTE. It is designed that way via its spectral efficiency. Despite this, a 5G site configuration is likely to consume more energy than a 4G LTE site in the field and, thus, not a like-for-like in terms of number of bands and type of antennas deployed.
The absolute power consumption of a 5G configuration is a function of the number of bands deployed, the type of antennas deployed, intelligent energy management features, and the effective time 5G resources that customers have demanded.
Due to its optical foundation, Fiber is far more energy efficient in both bit-wise relative terms and absolute terms than any other legacy fixed (e.g., xDSL, HFC) or cellular broadband technology (e.g., 4G, 5G).
Looking forward and with the increasing challenges of remaining sustainable and contributing to CO2 reduction, it is paramount to consider an energy-optimized fixed and mobile converged network architecture as opposed to today’s approach of optimizing the fixed network separately from the cellular network. As a society, we should expect that the industry works hard to achieve an overall reduction in energy consumption, relaxing the demand on existing green energy infrastructures.
With 5G as of today, we are orders of magnitude from the original NGMN vision of energy consumption of only half of what was consumed by cellular networks ten years ago (i.e., 2014), requiring an overall energy efficiency increase of x2000.
Be aware that many Telcos and Infrastructure providers will use bit-wise energy efficiency when they report on energy consumption. They will generally report impressive gains over time in the energy that networks consume to deliver bits to their customers. This is the least one should expect.
Last but not least, the telco world is not static and is RAT-wise not very clean, as mobile networks will have several RATs deployed simultaneously (e.g., 2G, 4G, and 5G). As such, we rarely (if ever) have apples-to-apples comparisons on cellular energy consumption.
ACKNOWLEDGEMENT.
I greatly acknowledge my wife, Eva Varadi, for her support, patience, and understanding during the creative process of writing this article. I also greatly appreciate the discussion on this topic that I have had with Rudolf van der Berg over the last couple of years. I thank him for pointing out and reminding me (when I forget) of the shortfalls and poor quality of most of the academic work and lobbying activities done in this area.
PS
If you are aiming at a leapfrog in absolute energy reduction of your cellular network, above and beyond what you get with your infrastructure suppliers (e.g., Nokia, Ericsson, Huawei…), I really recommend you take a look at Opanga‘s machine learning-based Joule ML solution. The Joules ML has been proven to reduce RAN energy costs by 20% – 40% on top of what the RAT supplier’s (e.g., Ericsson, Nokia, Huawei, etc.) own energy management solutions may bring.
Disclosure: I am associated with Opanga and on their Industry Advisory Board.
I am getting a bit sentimental as I haven’t written much about cellular data consumption for the last 10+ years. At the time, it did not take long for most folks in and out of our industry to realize that data traffic and, thereby, so many believed, the total cost of providing the cellular data would be growing far beyond the associated data revenues, e.g., remember the famous scissor chart back in the early two thousand tens. Many believed (then) that cellular data growth would be the undoing of the cellular industry. In 2011 many believed that the Industry only had a few more years before the total cost of providing cellular data would exceed the revenue rendering cellular data unprofitable. Ten years after, our industry remains alive and kicking (though they might not want to admit it too loudly).
Much of the past fear was due to not completely understanding the technology drivers, e.g., bits per second is a driver, and bytes that price plans were structured around not so much. The initial huge growth rates of data consumption that were observed did not make the unease smaller, i.e., often forgetting that a bit more can be represented as a huge growth rate when you start with almost nothing. Moreover, we also did have big scaling challenges with 3G data delivery. It became quickly clear that 3G was not what it had been hyped to be by the industry.
And … despite the historical evidence to the contrary, there are still to this day many industry insiders that believe that a Byte lost or gained is directly related to a loss or gain in revenue in a linear fashion. Our brains prefer straight lines and linear thinking, happily ignoring the unpleasantries of the non-linear world around us, often created by ourselves.
Figure 1 illustrates linear or straight-line thinking (left side), preferred by our human brains, contrasting the often non-linear reality (right side). It should be emphasized that horizontal and vertical lines, although linear, are not typically something that instinctively enters the cognitive process of assessing real-world trends.
Of course, if the non-linear price plans for cellular data were as depicted above in Figure 1, such insiders would be right even if anchored in linear thinking (i.e., even in the non-linear example to the right, an increase in consumption (GBs) leads to an increase in revenue). However, when it comes to cellular data price plans, the price vs. consumption is much more “beastly,” as shown below (in Figure 2);
Figure 2 illustrates the two most common price plan structures in Telcoland; (a, left side) the typical step function price logic that associates a range of data consumption with a price point, i.e., the price is a constant independent of the consumption over the data range. The price level is presented as price versus the maximum allowed consumption. This is by far the most common price plan logic in use. (b, right side) The “unlimited” price plan logic has one price level and allows for unlimited data consumption. T-Mobile US, Swisscom, and SK Telecom have all endorsed the unlimited with good examples of such pricing logic. The interesting fact is that most of those operators have several levels of unlimited tied to the consumptive behavior where above a given limit, the customer may be throttled (i.e., the speed will be reduced compared to before reaching the limit), or (and!) the unlimited plan is tied to either radio access technology (e.g., 4G, 4G+5G, 5G) or a given speed (e.g., 50 Mbps, 100 Mbps, 1Gbps, ..).
Most cellular data price plans follow a step function-like pricing logic as shown in Figure 2 (left side), where within each level, the price is constant up to the nominal data consumption value (i.e., purple dot) of the given plan, irrespective of the consumption. The most extreme version of this logic is the unlimited price plan, where the price level is independent of the volumetric data consumption. Although, “funny” enough, many operators have designed unlimited price plans that, in one way or another, depend on the customers’ consumption, e.g., after a certain level of unlimited consumption (e.g., 200 GB), cellular speed is throttled substantially (at least if the cell under which the customer demand resources are congested). So the “logic” is that if you wanted true unlimited, you still need to pay more than if you only require “unlimited”. Note that for the mathematically inclined, the step function is regarded as (piece-wise) linear … Although our linear brains might not appreciate that finesse very much. Maybe a heuristic that “The brain thinks in straight lines” would be more precisely restated as “The brain thinks in continuous non-constant monotonous straight lines”.
Any increase in consumption within a given pricing-consumption level will not result in any additional revenue. Most price plans allow for considerable growth without incurring additional associated revenues.
NETHERLANDS vs INDONESIA – BRIEFLY.
I like to keep informed and updated about markets I have worked in, with operators I have worked for, and with. I have worked across the globe in many very diverse markets and with operators in vastly different business cycles gives an interesting perspective on our industry. Throughout my career, I have been super interested in the difference between Telco operations and strategies in so-called mature markets versus what today may be much more of a misnomer than 10+ years ago, emerging markets.
The average cellular, without WiFi, consumption per customer in Indonesia was ca. 8 GB per month in 2022. That consumption would cost around 50 thousand Rp (ca. 3 euros) per month. For comparison, in The Netherlands, that consumption profile would cost a consumer around 16 euros per month. As of May 2023, the median cellular download speed was 106 Mbps (i.e., helped by countrywide 5G deployment, for 4G only, the speed would be around 60 to 80 Mbps) compared with 22 Mbps in Indonesia (i.e., where 5G has just been launched. Interestingly, although most likely coincidental, in Indonesia, a cellular data customer would pay ca. 5 times less than in the Netherlands for the same volumetric consumption. Note that for 2023, the average annual income in Indonesia is about one-quarter of that in the Netherlands. However, the Indonesian cellular consumer would also have one-fifth of the quality measured by downlink speed from the cellular base station to the consumer’s smartphone.
Let’s go deeper into how effective consumptive growth of cellular data is monetized… what may impact the consumptive growth, positively and negatively, and how it relates to the telco’s topline.
CELLULAR BUSINESS DYNAMICS.
Figure 3 Between 2016 and 2021, Western European Telcos lost almost 7% of their total cellular turnover (ca. 7+ billion euros over the markets I follow). This corresponds to a total revenue loss of ca. 1.4% per year over the period. To no surprise, the loss of cellular voice-based revenue has been truly horrendous, with an annual loss ca. 30%, although the Covid year (2021 and 2022, for that matter) was good to voice revenues (as we found ourselves confined to our homes and a call away from our colleagues). On the positive side, cellular data-based revenues have “positively” contributed to the revenue in Western Europe over the period (we don’t really know the counterfactual), with an annual growth of ca. 4%. Since 2016 cellular data revenues have exceeded that of cellular voice revenues and are 2022 expected to be around 70% of the total cellular revenue (for Western Europe). Cellular revenues have been and remain under pressure, even with a positive contribution from cellular data. The growth of cellular data volume (not including the contribution generated from WiFi usage) has continued to grow with a 38% annualized growth rate and is today (i.e., 2023) more than five times that of 2016. The annual growth rate of cellular data consumption per customer is somewhat lower ranging from the mid-twenties to the end-thirties percent. Needless to say that the corresponding cellular ARPU has not experienced anywhere near similar growth. In fact, cellular ARPU has generally been lowered over the period.
Some, in my opinion, obvious observations that are worth making on cellular data (I come to realize that although I find these obvious, I am often confronted with a lack of awareness or understanding of those);
Cellular data consumption grows much (much) faster than the corresponding data revenue (i.e., 38% vs 4% for Western Europe).
The unit growth of cellular data consumption does not lead to the same unit growth in the corresponding cellular data revenues.
Within most finite cellular data plans (thus the not unlimited ones), substantial data growth potential can be realized without resulting in a net increase of data-related revenues. This is, of course, trivial for unlimited plans.
The anticipated death of the cellular industry back in the twenty-tens was an exaggeration. The Industry’s death by signaling, voluptuous & unconstrained volumes of demanded data, and ever-decreasing euros per Bytes remains a fading memory and, of course, in PowerPoints of that time (I have provided some of my own from that period below). A good scare does wonders to stimulate innovation to avoid “Armageddon.” The telecom industry remains alive and well.
Figure 4 The latest data (up to 2022) from OECD on mobile data consumption dynamics. Source data can be found at OECD Data Explorer. The data illustrates the slowdown in cellular data growth from a customer perspective and in terms of total generated mobile data. Looking over the period, the 5-year cumulative growth rate between 2016 and 2021 is higher than 2017 to 2022 as well as the growth rate between 2022 and 2021 was, in general, even lower. This indicates a general slowdown in mobile data consumption as 4G consumption (in Western Europe) saturates and 5G consumption still picks up. Although this is not an account of the observed growth dynamics over the years, given the data for 2022 was just released, I felt it was worth including these for completeness. Unfortunately, I have not yet acquired the cellular revenue structure (e.g., voice and data) for 2022, it is work in progress.
WHAT DRIVES CONSUMPTIVE DATA GROWTH … POSITIVE & NEGATIVE.
What drives the consumer’s cellular data consumption? As I have done with my team for many years, a cellular operator with data analytics capabilities can easily check the list of positive and negative contributors driving cellular data consumption below.
Positive Growth Contributors:
Customer or adopter uptake. That is, new or old, customers that go from non-data to data customers (i.e., adopting cellular data).
Increased data consumption (i.e., usage per adopter) within the cellular data customer base that is driven by a lot of the enablers below;
Affordable pricing and suitable price plans.
More capable Radio Access Technology (RAT), e.g., HSDPA → HSPA+ → LTE → 5G, effectively higher spectral efficiency from advanced antenna systems. Typically will drive up the per-customer data consumption to the extent that pricing is not a barrier to usage.
More available cellular frequency spectrum is provisioned on the best RAT (regarding spectral efficiency).
Good enough cellular network consistent with customer demand.
Affordable and capable device ecosystem.
Faster mobile device CPU leads to higher consumption.
Faster & more capable mobile GPUs lead to higher consumption.
Device screen size. The larger the screen, the higher the consumption.
Access to popular content and social media.
Figure 5 illustrates the description of data growth as depending on the uptake of Adopters and the associated growth rate α(t) multiplied by the Usage per Adopter and the associated growth rate of usage μ(t). The growth of the Adopters can typically be approximated by an S-curve reaching its maximum as there are few more customers left to adopt a new service or product or RAT (i.e., α(t)→0%). As described in this section, the growth of usage per adopter, μ(t), will depend on many factors. Our intuition of μ is that it is positive for cellular data and historically has exceeded 30%. A negative μ would be an indication of consumptive churn. It should not be surprising that overall cellular data consumption growth can be very large as the Adopter growth rate is at its peak (i.e., around the S-curve inflection point), and Usage growth is high as well. It also should not be too surprising that after Adopter uptake has reached the inflection point, the overall growth will slow down and eventually be driven by the Usage per Adopter growth rate.
Figure 6 Using the OECD data (OECD Data Explorer) for the Western European mobile data per customer consumptive growth from 2011 to 2022, the above illustrates the annual growth rate of per-customer data mobile consumption. Mobile data consumption is a blend of usage across the various RATs enabling packet data usage. There is a clear increased annual growth after introducing LTE (4G) followed by a slowdown in annual growth, possibly due to reaching saturation in 4G adaptation, i.e., α3G→4G(t) → 0% leaving μ4G(t) driving the cellular data growth. There is a relatively weak increase in 2021, and although the timing coincides with 5G non-standalone (NSA) introduction (typically at 700 MHz or dynamics spectrum share (DSS) with 4G, e.g., Vodafone-Ziggo NL using their 1800 MHz for 4G and 5G) the increase in 2020 may be better attributed to Covid lockdown than a spurt in data consumption due to 5G NSA intro.
Anything that creates more capacity and quality (e.g., increased spectral efficiency, more spectrum, new, more capable RAT, better antennas, …) will, in general, result in an increased usage overall as well as on a per-customer basis (remember most price plans allow for substantial growth within the plans data-volume limit without incurring more cost for the customer). If one takes the above counterfactual, it should not be surprising that this would result in slower or negative consumption growth.
Negative growth contributors:
Cellular congestion causes increased packet loss, retransmissions, and deteriorating latency and speed performance. All in all, congestion may have a substantial negative impact on the customer’s service experience.
Throttling policies will always lower consumption and usage in general, as quality is intentionally lowered by the Telco.
Increased share of QUIC content on the network. The QUIC protocol is used by many streaming video providers (e.g., Youtube, Facebook, TikTok, …). The protocol improves performance (e.g., speed, latency, packet delivery, network changes, …) and security. Services using QUIC will “bully” other applications that use TCP/IP, encouraging TCP/IP to back off from using bandwidth. In this respect, QUIC is not a fair protocol.
Elephant flow dynamics (e.g., few traffic flows causing cell congestion and service degradation for the many). In general, elephant flows, particularly QUIC based, will cause an increase in TCP/IP data packet retransmissions and timing penalties. It is very much a situation where a few traffic flows cause significant service degradation for many customers.
One of the manifestations of cell congestion is packet loss and packet retransmission. Packet loss due to congestion ranges from 1% to 5%. or even several times higher at moments of peak traffic or if the user is in a poor cellular coverage area. The higher the packet loss, the worse the congestion, and the worse the customer experience. The underlying IP protocols will attempt to recover a lost packet by retransmission. The retransmission rate can easily exceed 10% to 15% in case of congestion. Generally, for a reliable and well-operated network, the packet loss should be well below 1% and even as low as 0.1%. Likewise, one would expect a packet retransmission rate of less than 2% (I believe the target should be less than 1%).
Thus, customers that happen to be under a given congested cell (e.g., caused by an elephant flow) would incur a substantially higher rate of retransmitted data packages (i.e., 10% to 15% or higher) as the TCP/IP protocol tries to make up for lost data packages. The customer may experience substantial service quality degradation and, as a final (unintended) “insult”, often be charged for those additional retransmitted data volumes.
From a cellular perspective, as the congestion has been relieved, the cellular operator may observe that the volume on the congested cell actually drops. The reason is that the packet loss and retransmission drops to a level far below the congested one (e.g., typically below 1%). As the quality improves for all customers demanding service from the previously overloaded (i.e., congested) cell, sustainable volume growth will commence in total and as well as will the average consumption on a customer basis. As will be shown below for normal cellular data consumption and most (if not all) price plans, a few percentage points drop in data volume will not have any meaningful effect on revenues. Either because the (temporary) drop happens within the boundaries of a given price plan level and thus has no effect on revenue, or because the overall gainful consumptive growth, as opposed to data volume attributed to poor quality, far exceeds the volume loss due to improved capacity and quality of a congested cell.
Well-balanced and available cellular sites will experience positive and sustainable data traffic growth.
Congested and over-loaded cellular sites will experience a negative and persistent reduction of data traffic.
Actively managing the few elephant flows and their negative impact on the many will increasecustomer satisfaction, reduce consumptive churn, and increase data growth, easily compensating for the congestion-induced increases due to packet retransmission. And unless an operator consistently is starved for radio access investments, or has poor radio access capacity management processes, most cell congestion can be attributed to the so-called elephant flows.
CELLULAR DATA CONSUMPTION IN REAL NETWORKS – ON A SECTOR LEVEL.
And irrespective of whatever drives positive and negative growth, it is worth remembering that daily traffic variations on a sector-by-sector basis and an overall cellular network level are entirely natural. An illustration of such natural sector variation over a (non-holiday) week is shown below in Figure 7 (c) for a sector in the top-20% of busiest sectors. In this example, the median variation over all sectors in the same week, as shown below, was around 10%. I often observe that even telco people (that should know better) find this natural variation quite worrisome as it appears counterintuitive to their linear growth expectations. Proper statistical measurement & analysis methodologies must be in place if inferences and solid analysis are required on a sector (or cell) basis over a relatively short time period (e.g., day, days, week, weeks,…).
Figure 7 illustrates the cellular data consumption daily variation over a (non-holiday) week. In the above, there are three examples (a) a sector from the bottom 20% in terms of carried volume, (b) a sector with a median data volume, and (c) a sector taken from the top 20% of carried data volume. Over the three different sectors (low, median, high) we observe very different variations over weekdays. From the top-20%, we have an almost 30% variation between the weekly minimum (Tuesday) and the weekly maximum (Thursday) to the bottom-20% with a variation in excess of 200% over the week. The charts above show another trend we observe in cellular networks regarding consumptive variations over time. Busy sectors tend to have a lower weekly variation than less busy sectors. I should point out that I have made no effort to select particular sectors. I could easily find some (of the less busy sectors) with even more wild variations than shown above.
The day-to-day variation is naturally occurring based on the dynamic behavior of the customers served by a given sector or cell (in a sector). I am frequently confronted with technology colleagues (whom I respect for their deep technical knowledge) that appear to expect (data) traffic on all levels monotonously increase with a daily growth rate that amounts to the annual CAGR observed by comparing the end-of-period volume level with the beginning of period volume level. Most have not bothered to look at actual network data and do not understand (or, to put it more nicely, simply ignore) the naturally statistical behavior of traffic that drives hourly, daily, weekly, and monthly variations. If you let statistical variations that you have no control over drive your planning & optimization decisions. In that case, you will likely fail to decide on the business-critical ones you can control.
An example of a high-traffic (top-20%) sector’s complete 365 day variations of data consumption is shown below in Figure 8. We observe that the average consumption (or traffic demand) increases nicely over the year with a bit of a slowdown (in this European example) during the summer vacation season (same around official holidays in general). Seasonal variations is naturally occurring and often will result in a lower-than-usual daily growth rate and a change in daily variations. In the sector traffic example below, Tuesdays and Saturdays are (typically) lower than the average, and Thursdays are higher than average. The annual growth is positive despite the consumptive lows over the year, which would typically freak out my previously mentioned industry colleagues. Of course, every site, sector, and cell will have a different yearly growth rate, most likely close to a normal distribution around the gross annual growth rate.
Figure 8 illustrates a top-20% sector’s data traffic growth dynamics (in GB) over a calendar year’s 365 days. Tuesdays and Saturdays are likely below the weekly average data consumption, and Thursdays are more likely to be above. Furthermore, the daily traffic growth is slowing around national holidays and in the summer vacation (i.e., July & August for this particular Western European country).
And to nail down the message. As shown in the example in Figure 9 below, every sector in your cellular network from one time period to the other will have a different positive and negative growth rate. The net effect over time (in terms of months more than days or weeks) is positive as long as customers adopt the supplied RAT (i.e., if customers are migrating from 4G to 5G, it may very well be that 4G consumed data will decline while the 5G consumed data will increase) and of course, as long as the provided quality is consistent with the expected and demanded quality, i.e., sectors with congestion, particular so-called elephant-flow induced congestion, will hurt the quality of the many that may reduce their consumptive behavior and eventually churn.
Figure 9 illustrates the variation in growth rates across 15+ thousand sectors in a cellular network comparing the demanded data volume between two consecutive Mondays per sector. Statistical analysis of the above data shows that the overall average value is ca. 0.49% and slightly skewed towards the positive growths rates (e.g., if you would compare a Monday with a Tuesday, the histogram would typically be skewed towards the negative side of the growth rates as Tuesday are a lower traffic day compared to Monday). Also, with the danger of pointing out the obvious, the daily or weekly growth rates expected from an annual growth rate of, for example, 30% are relatively minute, with ca. 0.07% and 0.49%, respectively.
The examples above (Figures 7, 8, and 9) are from a year in the past when Verstappen had yet to win his first F1 championship. That particular weekend also did not show F1 (or Sunday would have looked very different … i.e., much higher) or any other big sports event.
CELLULAR DATA PRICE PLAN LOGIC.
Figure 10 above is an example of the structure of a price plan. Possibly represented slightly differently from how your marketeer would do (and I am at peace with that). We observe the illustration of a price level of 8 data volume intervals on the upper left chart. This we can also write as (following the terminology of the lower right corner);
Thus, for the package allowing the customer to consume up to 3 GB is priced at 20 (irrespective of whether the customer would consume less). For package a consumer would pay 100 for a data consumption allowance up to 35 GB. Of course, we assume that the consumer choosing this package would generally consume more than 24 GB, which is the next cheaper package (i.e., ).
The price plan example above clearly shows that each price level offers customers room to grow before upgrading to the next level. For example, a customer consuming no more than 8 GB per month, fitting into , could increase consumption with 4 GB (+50%) before considering the next level price plan (i.e., ). This is just to illustrate that even if the customer’s consumption may grow substantially, one should not per se be expecting more revenue.
Even though it should be reasonably straightforward that substantial growth of a customer base data consumption cannot be expected to lead to an equivalent growth in revenue, many telco insiders instinctively believe this should be the case. I believe that the error may be due to many mentally linearizing the step-function price plans (see Figure 2 upper right side) and simply (but erroneously) believing that any increase (decrease) in consumption directly results in an increase (or decrease) in revenue.
DATA PRICING LOGIC & USAGE DISTRIBUTION.
If we want to understand how consumptive behavior impacts cellular operators’ toplines, we need to know how the actual consumption distributes across the pricing logic. As a high-level illustration, Figure 11 (below) shows the data price step-function logic from Figure 9 with an overall consumptive distribution superimposed (orange solid line). It should be appreciated that while this provides a fairly clear way of associating consumption with pricing, it is an oversimplification at best. It will nevertheless allow me to estimate crudely the number of customers that are likely to have chosen a particular price plan matching their demand (and affordability). In reality, we will have customers that have chosen a given price plan but either consume less than the limit of the next cheaper plan (thus, if consistently so, could save but go to that plan). We will also have customers that consume more than their allowed limit. Usually, this would result in the operator throttling the speed and sending a message to the customer that the consumption exceeds the limit of the chosen price plan. If a customer would consistently overshoots the limits (with a given margin) of the chosen plan, it is likely that eventually, the customer will upgrade to the next more expensive plan with a higher data allowance.
Figure 11 above illustrates on the left side a consumptive distribution (orange line) identified by its mean and standard deviation superimposed on our price plan step-function logic example. The right summarizes the consumptive distribution across the eight price plan levels. Note that there is a 9th level in case the 200 GB limit is breached (0.2% in this example). I am assuming that such customers pay twice the price for the 200 GB price plan (i.e., 320).
In the example of an operator with 100 million cellular customers, the consumptive distribution and the given price plan lead to a fiat of 7+ billion per month. However, with a consumptive growth rate of 30% to 40% annually per active cellular data user (on average), what kind of growth should we expect from the associated cellular data revenues?
Figure 12 In the above illustration, I have mapped the consumptive distribution to the price plan levels and then developed the begin-of-period consumptive distribution (i.e., the light green curve) month by month until month 12 has been reached (i.e., the yellow curve). I assume the average monthly consumptive cellular data growth is 2.5% or ca. 35% after 12 months. Furthermore, I assume that for the few customers falling outside the 200 GB limit that they will purchase another 200 GB plan. For completeness, the previous 12 months (previous year) need to be carried out to compare the total cumulated cellular data revenue between the current and previous periods.
Within the current period (shown in Figure 12 above), the monthly cellular data revenue CAGR comes out at 0.6% or a total growth of 7.4% of monthly revenue between the beginning period and the end period. Over the same period, the average data consumption (per user) grew by ca. 34.5%. In terms of the current year’s total data revenue to the previous year’s total data revenue, we get an annual growth rate of 8.3%. This illustrates that it should not be surprising that the revenue growth can be far smaller than the consumptive growth given price plans such as the above.
It should be pointed out that the above illustration of consumptive and revenue growth simplifies the growth dynamics. For example, the simulation ignores seasonal swings over a 12-month period. Also, it attributes 1-to-1 all consumption falling within the price range to that particular price level when there is always spillover on both upper and lower levels of a price range that will not incur higher or lower revenues. Moreover, while mapping the consumptive distribution to the price-plan giga-byte intervals makes the simulation faster (and setup certainly easier), it is also not a very accurate approach to the coarseness of the intervals.
A LEVEL DEEPER.
While working with just one consumptive distribution, as in Figure 11 and Figure 12 above, allows for simpler considerations, it does not fully reflect the reality that every price plan level will have its own consumptive distribution. So let us go that level deeper and see whether it makes a difference.
Figure 13 above, illustrates the consumptive distribution within a given price plan range, e.g., the “5 GB @ 30” price-plan level for customers with a consumption higher than 3 GB and less than or equal to 5 GB. It should come as no surprise that some customers may not reach even the 3 GB, even though they pay for (up to) 5 GB, and some may occasionally exceed the 5 GB limit. In the example above, 10% of customers have a consumption below 3 GB (and could have chosen the next cheaper plan of up to 3 GB), and 3% exceed the limits of the chosen plan (an event that may result in the usage speed being throttled). As the average usage within a given price plan level approaches the ceiling (e.g., 5 GB in the above illustration), in general, the standard deviation will reduce accordingly as customers will jump to the Next Expensive Plan to meet their consumptive needs (e.g., “12 GB @ 50” level in the illustration above).
Figure 14 generalizes Figure 11 to the full price plan and, as illustrated in Figure 12, let the consumption profiles develop in time over a 12-month period (Initial and +12 month shown in the above illustration). The difference between the initial and 12 months can be best appreciated with the four smaller figures that break up the price plan levels in 0 to 40 GB and 40 to 200 GB.
The result in terms of cellular data revenue growth is comparable to that of the higher-level approach of Figure 12 (ca. 8% annual revenue growth vs 34 % overall consumptive annual growth rate). The detailed approach of Figure 11 is, however, more complicated to get working and requires much more real data to work with (which obviously should be available to operators in this time and age). One should note that in the illustrated example price plan (used in the figures above) that at a 2.5% monthly consumptive growth rate (i.e., 34% annually), it would take a customer an average of 24 months (spread of 14 to 35 month depending on level) to traverse a price plan level from the beginning of the level (e.g., 5 GB) to the end of the level (12 GB). It should also be clear that as a customer enters the highest price plan levels (e.g., 100 GB and 200 GB), little additional can be expected to be earned on those customers over their consumptive lifetime.
The illustrated detailed approach shown above is, in particular, useful to test a given price plan’s profitability and growth potential, given the particularities of the customers’ consumptive growth dynamics.
The additional finesse that could be considered in the analysis could be an affordability approach because the growth within a given price level slows down as the average consumption approaches the limit of the given price level. This could be considered by slowing the mean growth rate and allowing for the variance to narrow as the density function approaches the limit. In my simpler approach, the consumptive distributions will continue to grow at a constant growth rate. In particular, one should consider more sophisticated approaches to modeling the variance that determines the spillover into less and more expensive levels. An operator should note that consumption that reduces or consistently falls into the less expensive level expresses consumptive churn. This should be monitored on a customer level as well as on a radio access cell level. Consumptive churn often reflects the supplied radio access quality is out of sync with the customer demand dynamics and expectations. On a radio access cell level, the diligent operator will observe a sharp increase in retransmitted data packages and increased latency on a flow (and active customer basis) hallmarks of a congested cell.
WRAPPING UP.
To this day, 20+ odd years after the first packet data cellular price plans were introduced, I still have meetings with industry colleagues where they state that they cannot implement quality-enhancing technologies for the fear that data consumption may reduce and by that their revenues. Funny enough, often the fear is that by improving the quality for typically many of their customers being penalized by a few customers’ usage patterns (e.g., the elephants in the data pipe), the data packet loss and TCP/IP retransmissions are reducing as the quality is improving and more customers are getting the service they have paid for. It is ignoring the commonly established fact of our industry that improving the customer experience leads to sustainable growth in consumption that consequently may also have a positive topline impact.
I am often in situations where I am surprised with how little understanding and feeling Telco employees have for their own price plans, consumptive behavior, and the impact these have on their company’s performance. This may be due to the fairly complex price plans telcos are inventing, and our brain’s propensity for linear thinking certainly doesn’t make it easier. It may also be because Telcos rarely spend any effort educating their employees about their price plans and products (after all, employees often get all the goodies for “free”, so why bother?). Do a simple test at your next town hall meeting and ask your CXOs about your company’s price plans and their effectiveness in monetizing consumption.
So what to look out for?
Many in our industry have an inflated idea (to a fault) about how effective consumptive growth is being monetized within their company’s price plans.
Most of today’s cellular data plans can accommodate substantial growth without leading to equivalent associated data revenue growth.
The apparent disconnect between the growth rate of cellular data consumption (CAGR ~30+%), in its totality as well on an average per-customer basis, and cellular data revenues growth rate (CAGR < 10%) is simply due to the industry’s price plan structures allowing for substantial growth without a proportion revenue growth.
ACKNOWLEDGEMENT.
I greatly acknowledge my wife, Eva Varadi, for her support, patience, and understanding during the creative process of writing this Blog.
Tellabs “End of Profit” study executive summary (wordpress.com), (2011). This study very much echoed the increasing Industry concern back in 2010-2012 that cellular data growth would become unprofitable and the industry’s undoing. The basic premise was that the explosive growth of cellular data and, thus, the total cost of maintaining the demand would lead to a situation where the total cost per GB would exceed the revenue per GB within the next couple of years. This btw. was also a trigger point for many cellular-focused telcos to re-think their strategies towards the integrated telco having internal access to fixed and mobile broadband.
B. de Langhe et al., “Linear Thinking in a Nonlinear World”, Harvard Business Review, (May-June, 2017). It is a very nice and compelling article about how difficult it is to get around linear thinking in a non-linear world. Our brains prefer straight lines and linear patterns and dependencies. However, this may lead to rather amazing mistakes and miscalculations in our clearly nonlinear world.
OECD Data Explorer A great source of telecom data, for example, cellular data usage per customer, and the number of cellular data customers, across many countries. Recently includes 2022 data.
I have used Mobile Data – Europe | Statista Market Forecast to better understand the distribution between cellular voice and data revenues. Most Telcos do not break out their cellular voice and data revenues from their total cellular revenues. Thus, in general, such splits are based on historical information where it was reported, extrapolations, estimates, or more comprehensive models.
K.-C. Lan and J. Heidemann, “A measurement study of correlations of Internet flow characteristic” (February 2006). This seminal paper has inspired many other research works on elephant flows. A flow should be understood as an unidirectional series of IP packets with the same source and destination addresses, port numbers, and protocol numbers. The authors define elephant flows as flows with a size larger than the mean plus three standard deviations of the sampled data. Though it is important to point out that the definition is less important. Such elephant flows are typically few (less than 20%) but will cause cell congestion by reducing the quality of many requiring a service in such an affected cell.
Opanga Networks is a fascinating and truly innovative company. Using AI, they have developed their solution around the idea of how to manage data traffic flows, reduce congestion, and increase customer quality. Their (N2000) solution addresses particular network situations where a limited number of customer data usage takes up a disproportionate amount of resources within the cellular network (i.e., the problem with elephant flows). Opanga’s solution optimizes those traffic congestion-impacting flows and results in an overall increase in service quality and customer experience. Thus, the beauty of the solution is that the few traffic patterns, causing the cellular congestion, continue without degradation, allowing the many traffic patterns that were impacted by the few to continue at their optimum quality level. Overall, many more customers are happy with their service. The operator avoids an investment of relatively poor return and can either save the capital or channel it into a much higher IRR (internal rate of return) investment. I have seen tangible customer improvements exceeding 30+ percent improvement to congested cells, avoiding substantial RAN Capex and resulting Opex. And the beauty is that it does not involve third-party network vendors and can be up and running within weeks with an investment that is easily paid back within a few months. Opanga’s product pipeline is tailor-made to alleviate telecom’s biggest and thorniest challenges. Their latest product, with the appropriate name Joules, enables substantial radio access network energy savings above and beyond what features the telcos have installed from their Radio Access Network suppliers. Disclosure:I am associated with Opanga as an advisor to their industrial advisory board.
I built my first Telco technology Capex model back in 1999. I had just become responsible for what then was called Fixed Network Engineering with a portfolio of all technology engineering design & planning except for the radio access network but including all transport aspects from access up to Core and out to the external world. I got a bit frustrated that every time an assumption changed (e.g., business/marketing/sales), I needed to involve many people in my organization to revise their Capex demand. People that were supposed to get our greenfield network rolled out to our customers. Thus, I built my first Capex model that would take the critical business assumptions, size my network (including the radio access network), and consistently assign the right Capex amounts to each category. The model allowed for rapid turnaround on revised business assumptions and a highly auditable track of changes, planning drivers, and unit prices. Since then, I have built best-practice Capex (and technology Opex) models for many Deutsche Telekom AGs and Ooredoo Group entities. Moreover, I have been creating numerous network and business assessment and valuation models (with an eye on M&A), focusing on technology drivers behind Capex and Opex for many different types of telco companies (30+) operating in an extensive range of market environments around the world (20+). Creating and auditing techno-economical models, making those operational and of high quality, it has (for me) been essential to be extensively involved operationally in the telecom sector.
PRELUDE TO CAPEX.
Capital investments, or Capital Expenditures, or just Capex for short, make Telcos go around. Capex is the monetary means used by your Telco to acquire, develop, upgrade, modernize, and maintain tangible, as well as, in some instances, intangible, assets and infrastructure. We can find Capex back under “Property, Plants, and Buildings” (or PPB) in a company’s balance sheet or directly in the profit & loss (or income) statement. Typically for an investment to be characterized as a capital expense, it needs to have a useful lifetime of at least 2 years and be a physical or tangible asset.
What about software? A software development asset is, by definition, intangible or non-physical. However, it can, and often is, assigned Capex status, although such an assignment requires a bit more judgment (and auditorial approvals) than for a real physical asset.
The “Modern History of Telecom” (in Europe) is well represented by Figure 1, showing the fixed-mobile total telecom Capex-to-Revenue ratio from 1996 to 2025.
From 1996 to 2012, most of the European Telco Capex-to-Revenue ratio was driven by investment into mobile technology introductions such as 2G (GSM) in 1996 and 3G (UMTS) in 2000 to 2002 as well as initial 4G (LTE) investments. It is clear that investments into fixed infrastructure, particularly modernizing and enhancing, have been down-prioritized only until recently (e.g., up to 2010+) when incumbents felt obliged to commence investing in fiber infrastructure and urgent modernization of incumbents’ fixed infrastructures in general. For a long time, the investment focus in the telecom industry was mobile networks and sweating the fixed infrastructure assets with attractive margins.
Figure 1 illustrates the “Modern History of Telecom” in Europe. It shows the historical development of Western Europe Telecom Capex to Revenue ratio trend from 1996 to 2025. The maximum was about 28% at the time 2G (GSM) was launched and at minimum after the cash crunch after ultra-expensive 3G licenses and the dot.com crash of 2020. In recent years, since 2008, Capex to Revenue has been steadily increasing as 4G was introduced and fiber deployment started picking up after 20210. It should be emphasized that the Capex to Revenue trend is for both Mobile and Fixed. It does not include frequency spectrum investments.
Across this short modern history of telecom, possibly one of the worst industry (and technology) investments have been the investments we did into 3G. In Europe alone, we invested 100+ billion Euro (i.e., not included in the Figure) into 2100 MHz spectrum licenses that were supposed to provide mobile customers “internet-in-their-pockets”. Something that was really only enabled with the introduction of 4G from 2010 onwards.
Also, from 2010 onwards, telecom companies (in Europe) started to invest increasingly in fiber deployment as well as upgrading their ailing fixed transport and switching networks focusing on enabling competitive fixed broadband services. But fiber investments have picked up in a significant way in the overall telecom Capex, and I suspect it will remain so for the foreseeable future.
Figure 2 When we take the European Telco revenue (mobile & fixed) over the period 1996 to 2025, it is clear that the mobile business model quantum leaped revenue from its inception to around 2008. After this, it has been in steady decline, even if improvement has been observed in the fixed part of the telco business due to the transition from voice-dominated to broadband. Source:https://stats.oecd.org/
As can be observed from Figure 1, since the telecom credit crunch between 2000 and 2003, the Capex share of revenue has steadily increased from just around 12% in 2004, right after the credit crunch, to almost 20% in 2021. Over the period from 2008 to 2021, the industry’s total revenue has steadily declined, as can be seen in Figure 2. Taking the last 10 years (2011-2021) of mobile and fixed revenue data has, on average, reduced by 4+ billion euros a year. The cumulative annual growth rate (CAGR) was at a great +6% from the inception of 2G services in 1996 to 2008, the year of the “great recession.” From 2008 until 2021, the CAGR has been almost -2% in annual revenue loss for Western Europe.
What does that mean for the absolute total Capex spend over the same period? Figure 3 provides the trend of mobile and fixed Capex spending over the period. Since the “happy days” of 2G and 3G Capex spending, Capex rapidly declined after the industry spent 100+ billion Euro on 3G spectrum alone (i.e., 800+ million euros per MHz or 4+ euros per MHz-pop) before the required multi-billion Euro in 3G infrastructure. Though, after 2009, which was the lowest Capex spend after the 3G licenses were acquired, the telecom industry has steadily grown its annual total Capex spend with ca. +1 billion Euro per year (up to 2021) financing new technology introductions (4G and 5G), substantial mobile radio and core modernizations (a big refresh ca. every 6 -7 years), increasing capacity to continuously cope with consumer demand for broadband, fixed transport, and core infrastructure modernization, and last but not least (since the last ~ 8 years) increasing focus on fiber deployment. Over the same period from 2009 to 2021, the total revenue has declined by ca. 5 billion euros per year in Western Europe.
Figure 3 Using the above “Total Capex to Revenue” (Figure 1) and “Total Revenue” (Figure 2) allows us to estimate the absolute “Total Capex” over the same period. Apart from the big Capex swing around the introduction of 2G and 3G and the sharp drop during the “credit crunch” (2000 – 2003), Capex has grown steadily whilst the industry revenue has declined.
It will be very interesting to see how the next 10 years will develop for the telecom industry and its capital investment. There is still a lot to be done on 5G deployment. In fact, many Telcos are just getting started with what they would characterize as “real 5G”, which is 5G standalone at mid-band frequencies (e.g., > 3 GHz for Europe, 2.5 GHz for the USA), modernizing antenna structures from standard passive (low-order) to active antenna systems with higher-order MiMo antennas, possible mmWave deployments, and of course, quantum leap fiber deployment in laggard countries in Europe (e.g., Germany, UK, Greece, Netherlands, … ). Around 2028 to 2030, it would be surprising if the telecoms industry would not commence aggressively selling the consumer the next G. That is 6G.
At this moment, the next 3 to 5 years of Capital spending are being planned out with the aim of having the 2024 budgets approved by November or December. In principle, the long-term plans, that is, until 2027/2028, have agreed on general principles. Though, with the current financial recession brewing. Such plans would likely be scrutinized as well.
I have, over the last year since I published this article, been asked whether I had any data on Ebitda over the period for Western Europe. I have spent considerable time researching this, and the below chart provides my best shot at such a view for the Telecom industry in Western Europe from the early days of mobile until today. This, however, should be taken with much more caution than the above Caex and Revenues, as individual Telco’ s have changed substantially over the period both in their organizational structure and how results have been represented in their annual reports.
Figure 4 illustrates the historical development of the EBITDA margin over the period from 1995 to 2022 and a projection of the possible trends from 2023 onwards. Caution: telcos’ corporate and financial structures (including reporting and associated transparency into details) have substantially changed over the period. The early first 10+ years are more uncertain concerning margin than the later years. Directionally it is representative of the European Telco industry. Take Deutsche Telekom AG, it “lost” 25% of its revenue between 2005 and 2015 (considering only German & European segments). Over the same period, it shredded almost 27% of its Opex.
CAVEATS
Of course, Capex to Revenue ratios, any techno-economical ratio you may define, or cost distributions of any sort are in no way the whole story of a Telco life-and-budget cycle. Over time, due to possible structural changes in how Telcos operate, the past may not reflect the present and may even be less telling in the future.
Telcos may have merged with other Telcos (e.g., Mobile with Fixed), they may have non-Telco subsidiaries (i.e., IT consultancies, management consultancies, …), they may have integrated their fixed and mobile business units, they may have spun off their infrastructure, making use of towercos for their cell site needs (e.g., GD Towers, Vantage, Cellnex, American Towers …), open fibercos (e.g., Fiberhost Poland, Open Dutch Fiber, …) for their fiber needs, hyperscale cloud providers (e.g., AWS, Amazon, Microsoft Azure, ..) for their platform requirements. Capex and Opex will go left and right, up and down, depending on each of the above operational elements. All that may make comparing one Telco’s Capex with another Telco’s investment level and operational state-of-affairs somewhat uncertain.
I have dear colleagues who may be much more brutal. In general, they are not wrong but not as brutally right as their often high grounds could indicate. But then again, I am not a black-and-white guy … I like colors.
So, I believe that investment levels, or more generally, cost levels, can be meaningfully compared between Telcos. Cost, be it Opex or Capex, can be estimated or modeled with relatively high accuracy, assuming you are in the know. It can be compared with other comparables or non-comparables. Though not by your average financial controller with no technology knowledge and in-depth understanding.
Alas, with so many things in this world, you must understand what you are doing, including the limitations.
IT’S THAT TIME OF THE YEAR … CAPEX IS IN THE AIR.
It is the time of the year when many telcos are busy updating their business and financial planning for the following years. It is not uncommon to plan for 3 to 5 years ahead. It involves scenario planning and stress tests of those scenarios. Scenarios would include expectations of how the relevant market will evolve as well as the impact of the political and economic environment (e.g., covid lockdowns, the war in Ukraine, inflationary pressures, supply-chain challenges, … ) and possible changes to their asset ownership (e.g., infrastructure spin-offs).
Typically, between the end of the third or beginning of the fourth quarter, telecommunications businesses would have converged upon a plan for the coming years, and work will focus on in-depth budget planning for the year to come, thus 2024. This is important for the operational part of the business, as work orders and purchase orders for the first quarter of the following year would need to be issued within the current year.
The planning process can be sophisticated, involving many parts of the organization considering many scenarios, and being almost mathematical in its planning nature. It can be relatively simple with the business’s top-down financial targets to adhere to. In most instances, it’s likely a combination of both. Of course, if you are a publicly-traded company or part of one, your past planning will generally limit how much your new planning can change from the old. That is unless you improve upon your old plans or have no choice but to disappoint investors and shareholders (typically, though, one can always work on a good story). In general, businesses tend to be cautiously optimistic about uncertain business drivers (e.g., customer growth, churn, revenue, EBITDA) and conservatively pessimistic on business drivers of a more certain character (e.g., Capex, fixed cost, G&A expenses, people cost, etc..). All that without substantially and negatively changing plans too much between one planning horizon to the next.
Capital expense, Capex, is one of the foundations, or enablers, of the telco business. It finances the building, expansion, operation, and maintenance of the telco network, allowing customers to enjoy mobile services, fixed broadband services, TV services, etc., of ever-increasing quality and diversity. I like to look at Capex as the investments I need to incur in order to sustain my existing revenues, grow my revenues (preferably beating inflationary pressures), and finance any efficiency activities that will reduce my operational expenses in the future.
If we want to make the value of Capex to the corporation a little firmer, we need a little bit of financial calculus. We can write a company’s value (CV) as
With g being the expected growth rate in free cash flow in perpetuity, WACC is the Weighted Average Cost of Capital, and FCFF is the Free Cash Flow to the Firm (i.e., company) that we can write as follows;
FCFF = NOPLAT + Depreciation & Amortization (DA) – ∆ Working Capital – Capex,
with NOPLAT being the Net Operating Profit Less Adjusted Taxes (i.e., EBIT – Cash Taxes). So if I have two different Capex budgets with everything else staying the same despite the difference in Capex (if true life would be so easy, right?);
assuming that everything except the proposed Capex remains the same. With a difference of, for example, 10 Million euros, a future growth rate g = 0% (maybe conservative), and a WACC of 5% (note: you can find the latest average WACC data for the industry here, which is updated regularly by New York University Leonard N. Stern School of Business. The 5% chosen here serves as an illustration only (e.g., this was approximately representative of Telco Europe back in 2022, as of July 2023, it was slightly above 6%). You should always choose the weighted average cost of capital that is applicable to your context). The above formula would tell us that the investment plan having 10 Million euros less would be 200 Million euros more valuable (20× the Capex not spent). Anyone with a bit of (hands-on!) experience in budget business planning would know that the above valuation logic should be taken with a mountain of salt. If you have two Capex plans with no positive difference in business or financial value, you should choose the plan with less Capex (and don’t count yourself rich on what you did not do). Of course, some topics may require Capex without obvious benefits to the top or bottom line. Such examples are easy to find, e.g., regulatory requirements or geo-political risks force investments that may appear valueless or even value destructive. Those require meticulous considerations, and timing may often play a role in optimizing your investment strategy around such topics. In some cases, management will create a narrative around a corporate investment decision that fits an optimized valuation, typically hedging on one-sided inflated risks to the business if not done. Whatever decision is made, it is good to remember that Capex, and resulting Opex, is in most cases a certainty. The business benefits in terms of more revenue or more customers are uncertain as is assuming your business will be worth more in a number of years if your antennas are yellow and not green. One may call this the “Faith-based case of more Capex.”
Figure 5 provides an overview of Western Europe of annual Fixed & Mobile Capex, Total and Service Revenues, and Capex to Revenue ratio (in %). Source: New Street Research Western Europe data.
Figure 5 provides an overview of Western European telcos’ revenue, Capex, and Capex to Revenue ratio. Over the last five years, Western European telcos have been spending increasingly higher Capex levels. In 2021 the telecom Capex was 6 billion euros higher than what was spent in 2017, about 13% higher. Fixed and mobile service revenue increased by 14 billion euros, yielding a Capex to Service revenue ratio of 23% in 2021 compared to 20.6% in 2017. In most cases, the total revenue would be reported, and if luck has its way (or you are a subscriber to New Street Research), the total Capex. Thus, capturing both the mobile and the fixed business, including any non-service-related revenues from the company. As defined in this article, non-service-related revenues would comprise revenues from wholesales, sales of equipment (e.g., mobile devices, STB, and CPEs), and other non-service-specific revenues. As a rule of thumb, the relative difference between total and service-related revenues is usually between 1.1 to 1.3 (e.g., the last 5-year average for WEU was 1.17).
One of the main drivers for the Western European Capex has firstly been aggressive fiber-to-the-premise (FTTP) deployment and household fiber connectivity, typically measured in homes passed across most of the European metropolitan footprint as well as urban areas in general. As fiber covers more and more residential households, increased subscription to fiber occurs as well. This also requires substantial additional Capex for a fixed broadband business. Figure 6 illustrates the annual FTTP (homes passed) deployment volume in Western Europe as well as the total household fiber coverage.
Figure 6 above shows the fiber to the premise (FTTP) home passed deployment per anno from 2018 to 2021 Actual (source: European Commission’s “Broadband Coverage in Europe 2021” authored by Omdia et al.) and 2021 to 2025 projected numbers (i.e., this author’s own assessment). During the period from 2018 to 2021, household fiber coverage grew from 27% to 43% and is expected to grow to at least 71% by 2026 (not including overbuilt, thus unique household covered). The overbuilt data are based on a work in progress model and really should be seen as directional (it is difficult to get data with respect to the overbuilt).
A large part of the initial deployment has been in relatively dense urban areas as well as relying on aerial fiber deployment outside bigger metropolitan centers. For example, in Portugal, with close to 90% of households covered with fiber as of 2021, the existing HFC infrastructure (duct, underground passageways, …) was a key enabler for the very fast, economical, and extensive household fiber coverage there. Although many Western European markets will be reaching or exceeding 80% of fiber coverage in their urban areas, I would expect to continue to see a substantial amount of Capex being attributed. In fact, what is often overlooked in the assessment of the Capex volume being committed to fiber deployment, is that the unit-Capex is likely to increase substantially as countries with no aerial deployment option pick up their fiber rollout pace (e.g., Germany, the UK, Netherlands) and countries with an already relatively high fiber coverage go increasingly suburban and rural.
Figure 7 above shows the total fiber to the premise (FTTP) home remaining per anno from 2018 to 2021 Actual (source: European Commission’s “Broadband Coverage in Europe 2021” authored by Omdia et al.). The 2022 to 2030 projected remaining households are based on the author’s own assessment and does not consider overbuilt numbers.
The second main driver is in the domain of mobile network investment. The 5G radio access deployment has been a major driver in 2020 and 2021. It is expected to continue to contribute significantly to mobile operators Capex in the coming 5 years. For most Western European operators, the initial 5G deployment was at 700 MHz, which provides a very good 5G coverage. However, due to limited frequency spectral bandwidth, there are not very impressive speeds unless combined with a solid pre-existing 4G network. The deployment of 5G at 700 MHz has had a fairly modest effect on Mobile Capex (apart from what operators had to pay out in the 5G spectrum auctions to acquire the spectrum in the first place). Some mobile networks would have been prepared to accommodate the 700 MHz spectrum being supported by existing lower-order or classical antenna infrastructure. In 2021 and going forward, we will see an increasing part of the mobile Capex being allocated to 3.X GHz deployment. Far more sophisticated antenna systems, which co-incidentally also are far more costly in unit-Capex terms, will be taken into use, such as higher-order MiMo antennas from 8×8 passive MiMo to 32×32 and 64×64 active antennas systems. These advanced antenna systems will be deployed widely in metropolitan and urban areas. Some operators may even deploy these costly but very-high performing antenna systems in suburban and rural clutter with the intention to provide fixed-wireless access services to areas that today and for the next 5 – 7 years continue to be under-served with respect to fixed broadband fiber services.
Overall, I would also expect mobile Capex to continue to increase above and beyond the pre-2020 level.
As an external investor with little detailed insights into individual telco operations, it can be difficult to assess whether individual businesses or the industry are investing sufficiently into their technical landscape to allow for growth and increased demand for quality. Most publicly available financial reporting does not provide (if at all) sufficient insights into how capital expenses are deployed or prioritized across the many facets of a telco’s technical infrastructure, platforms, and services. As many telcos provide mobile and fixed services based on owned or wholesaled mobile and fixed networks (or combinations there off), it has become even more challenging to ascertain the quality of individual telecom operations capital investments.
Figure 8 illustrates why analysts like to plot Total Revenue against Total Capex (for fixed and mobile). It provides an excellent correlation. Though great care should be taken not to assume causation is at work here, i.e., “if I invest X Euro more, I will have Y Euro more in revenues.” It may tell you that you need to invest a certain level of Capex in sustaining a certain level of Revenue in your market context (i.e., country geo-socio-economic context). Source: New Street Research Western Europe data covering the following countries: AT, BE, DK, FI, FR, DE, GR, IT, NL, NO, PT, ES, SE, CH, and UK.
Why bother with revenues from the telco services? These would typically drive and dominate the capital investments and, as such, should relate strongly to the Capex plans of telcos. It is customary to benchmark capital spending by comparing the Capex to Revenue (see Figure 8), indicating how much a business needs to invest into infrastructure and services to obtain a certain income level. If nothing is stated, the revenue used for the Capex-to-Revenue ratio would be total revenue. For telcos with fixed and mobile businesses, it’s a very high-level KPI that does not allow for too many insights (in my opinion). It requires some de-averaging to become more meaningful.
THE TELCO TECHNOLOGY FACTORY
Figure 8 (below) illustrates the main capital investment areas and cost drivers for telecommunications operations with either a fixed broadband network, a mobile network, or both. Typically, around 90% of the capital expenditures will be invested into the technology factory comprising network infrastructure, products, services, and all associated with information technology. The remaining ca. 10% will be spent on non-technical infrastructures, such as shops, office space, and other non-tech tangible assets.
Figure 9 Telco Capex is spent across physical (or tangible) infrastructure assets, such as communications equipment, brick & mortar that hosts the equipment, and staff. Furthermore, a considerable amount of a telcos Capex will also go to human development work, e.g., for IT, products & services, either carried out directly by own staff or third parties (i.e., capitalized labor). The above illustrates the macro-levels that make out a mobile or fixed telecommunications network, and the most important areas Capex will be allocated to.
If we take the helicopter view on a telco’s network, we have the customer’s devices, either mobile devices (e.g., smartphone, Internet of Things, tablet, … ) or fixed devices, such as the customer premise equipment (CPE) and set-top box. Typically the broadband network connection to the customer’s premise would require a media converter or optical network terminator (ONT). For a mobile network, we have a wireless connection between the customer device and the radio access network (RAN), the cellular network’s most southern point (or edge). Radio access technology (e.g., 3G, 4G, or 5G) is very important determines for the customer experience. For a fixed network connection, we have fiber or coax (cable) or copper connecting the customer’s premise and the fixed network (e.g., street cabinet). Access (in general) follows the distribution of the customers’ locations and concentration, and their generated traffic is aggregated increasingly as we move north and up towards and into the core network. In today’s modern networks, big-fat-data broadband connections interconnect with the internet and big public data centers hosting both 3rd party and operator-provided content, services, and applications that the customer base demands. In many existing networks, data centers inside the operator’s own “walls” likewise will have service and application platforms that provide customers with more of the operator’s services. Such private data centers, including what is called micro data centers (μDCs) or edge DCs, may also host 3rd party content delivery networks that enable higher quality content services to a telco’s customer base due to a higher degree of proximity to where the customers are located compared to internet-based data centers (that could be located anywhere in the world).
Figure 10 illustrates break-out the details of a mobile as well as a fixed (fiber-based) network’s infrastructure elements, including the customers’ various types of devices.
Figure 10 illustrates that on a helicopter level, a fixed and a classical mobile network structure are reasonably similar, with the main difference of one network carrying the mobile traffic and the other the fixed traffic. The traffic in the fixed network tends to be at least ten larger than in the mobile network. They mainly differ in the access node and how it connects to the customer. For fixed broadband, the physical connection is established between, for example, the ONL (Optical Line Terminal) in the optical distribution network and ONT (Optical Line Terminal) at the customer’s home via a fiber line (i.e., wired). The wireless connection for mobile is between the Radio Node’s antenna and the end-user device. Note: AAS: Advanced Antenna System (e.g., MiMo, massive-MiMo), BBU: Base-band unit, CPE: Customer Premise Equipment, IOT: Internet of Things, IX: Internet Exchange, OLT: Optical Line Termination, and ONT: Optical Network Termination (same as ONU: Optical Network Unit).
From Figure 10 above, it should be clear that there are a lot of similarities between the mobile and fixed networks, with the biggest difference being that the mobile access network establishes a wireless connection to the customer’s devices versus the fixed access network physically wired connection to the device situated at the customer’s premises.
This is good news for fixed-mobile telecommunications operators as these will have considerable architectural and, thus, investment synergies due to those similarities. Although, the sad truth is that even today, many fixed-mobile telco companies, particularly incumbent, remain far away from having achieved fixed-mobile network harmonization and conversion.
Moreover, there are many questions to be asked as well as concerns when it comes to our industry’s Capex plans; what is the Capex required to accommodate data growth, are existing budgets allowing for sufficient network densification (to accommodate growth and quality), and what is the Capex trade-off between frequency spectrum acquisition, antenna technology, and site densification, how much Capex is justified to pursue the best network in a given market, what is the suitable trade-off between investing in fiber to the home and aggressive 5G deployment, should (incumbent) telco’s pursue fixed wireless access (FWA) and how would that impact their capital plans, what is the right antenna strategy, etc…
On a high level, I will provide guidance on many of the above questions, in this article and in forthcoming ones.
THE CAPEX STRUCTURE OF A TELECOM COMPANY.
When taking a macro look at Capex and not yet having a good idea about the breakdown between mobile and fixed investment levels, we are helped that on a macro level, the Capex categories are similar for a fixed and a mobile network. Apart from the last mile (access) in a fixed network is a fixed line (e.g., fiber, coax, or copper) and a wireless connection in a mobile network; the rest is comparable in nature and function. This is not surprising as a business with a fixed-mobile infrastructure would (should!) leverage the commonalities in transport and part of the access architecture.
In the fixed business, devices required to enable services on the fixed-line network at the fixed customers’ home (e.g., CPE, STB, …) are a capital expense driven by new customers and device replacement. This is not the case for mobile devices (i.e., an operational expense).
Figure 11 above illustrates the major Capex elements and their distribution defined by the median, lower and upper quantiles (the box), and lower and upper extremes (the whiskers) of what one should expect of various elements’ contribution to telco Capex. Note: CPE: Customer Premise Equipment, STB: Set-Top Box.
CUSTOMER PREMISE EQUIPMENT (CPE) & SET-TOP BOXES (STB) investments ARE between 10% to 20% of the TelEcoM Capex.
The capital investment level into Customer premise equipment (CPE) depends on the expected growth in the fixed customer base and the replacement of old or defective CPEs already in the fixed customer base. We would generally expect this to make out between 10% to 20% of the total Capex of a fixed-mobile telco (and 0% in a mobile-only business). When migrating from one access technology (e.g., copper/xDSL phase-out, coaxial cable) to another (e.g., fiber or hybrid coaxial cable), more Capex may be required. Similar considerations for set-top boxes (STB) replacement due to, for example, a new TV platform, non-compliance with new requirements, etc. Many Western European incumbents are phasing out their extensive and aging copper networks and replacing those with fiber-based networks. At the same time, incumbents may have substantial capital requirements phasing out their legacy copper-based access networks, the capital burden on other competitor telcos in markets where this is happening if such would have a significant copper-based wholesale relationship with the incumbent.
In summary, over the next five years, we should expect an increase in CPE-based Caped due to the legacy copper phase-out of incumbent fixed telcos. This will also increase the capital pressure in transport and access categories.
CPE & STB Capex KPIs: Capex share of Total and Capex per Gross Added Customer.
Capex modeling comment: Use your customer forecast model as the driver for new CPEs. Your research should give you an idea of the price range of CPEs used by your target fixed broadband business. Always include CPE replacement in the existing base and the gross adds for the new CPEs. Many fixed broadband retail businesses have been conservative in the capabilities of CPEs they have offered to their customer base (e.g., low-end cheaper CPEs, poor WiFi quality, ≤1Gbps), and it should be considered that these may not be sufficient for customer demand in the following years. An incumbent with a large install base of xDSL customers may also have a substantial migration (to fiber) cost as CPEs are required to be replaced with fiber cable CPEs. Due to the current supply chain and delivery issues, I would assume that operators would be willing to pay a premium for getting critical stock as well as having priority delivery as stock becomes available (e.g., by more expensive shipping means).
Core network & service platformS, including data centers, investments ARE between 8% to 12% of the telecom Capex.
Core network and service platforms should not take up more than 10% of the total Capex. We would regard anything less than 5% or more than 15% as an anomaly in Capital prioritization. This said, over the next couple of years, many telcos with mobile operations will launch 5G standalone core networks, which is a substantial change to the existing core network architecture. This also raises the opportunity for lifting and shifting from monolithic systems or older cloud frameworks to cloud-native and possibly migrating certain functions onto public cloud domains from one or more hyperscalers (e.g., AWS, Azure, Google). As workloads are moved from telco-owned data centers and own monolithic core systems, telco technology cost structure may change from what prior was a substantial capital expense to an operational expense. This is particularly true for software-related developments and licensing.
Another core network & service platform Capex pressure point may come from political or investor pressure to replace Chinese network elements, often far removed from obsolescence and performance issues, with non-Chinese alternatives. This may raise the Core network Capex level for the next 3 to 5 years, possibly beyond 12%. Alas, this would be temporary.
In summary, the following topics would likely be on the Capex priority list;
1. Life-cycle management investments (I like to call Business-as-Usual demand) into software and hardware maintenance, end-of-life replacements, growth (software licenses, HW expansions), and miscellaneous topics. This area tends to dominate the Capex demand unless larger transformational projects exist. It is also the first area to be de-prioritized if required. Working with Priority 1, 2, and 3 categorizations is a good Capital planning methodology. Where Priority 1 is required within the following budget year 1, Prio. 2 is important but can wait until year two without building up too much technical debt and Prio. 3 is nice to have and not expected to be required for the next two subsequent budget years.
3. Network cloudification, initially lift-and-shift with subsequent cloud-native transformation. The trigger point will be enabling the deployment of the 5G standalone (SA) core. Operators will also take the opportunity to clean up their data centers and network core location (timeline: 24 – 36 months).
4. Although edge computing data centers (DC) typically are supposed to support the radio access network (e.g., for Open-RAN), the capital assignment would be with the core network as the expertise for this resides here. The intensity of this Capex (if built by the operator, otherwise, it would be Opex) will depend on the country’s size and fronthaul/backhaul design. The investment trigger point would generally commence on Open-RAN deployment (e.g., 1&1 & Telefonica Germany). The edge DC (or μDC) would most like be standard container-sized (or half that size) and could easily be provided by independent towerco or specific edge-DC 3rd party providers lessening the Capex required for the telco. For smaller geographies (e.g., Netherlands, Denmark, Austria, …), I would not expect this item to be a substantial topic for the Capex plans. Mainly if Open-RAN is not being pursued over the next 5 – 10 years by mainstream incumbent telcos.
5. Chinese supplier replacement. The urgency would depend on regulatory pressure, whether compensation is provided (unlikely) or not, and the obsolescence timeline of the infrastructure in question. Given the high quality at very affordable economics, I expect this not to have the biggest priority and will be executed within timelines dictated more by economics and obsolescence timelines. In any case, I expect that before 2025 most European telcos will have phased out Chinese suppliers from their Core Networks, incl. any Service platforms in use today (timeline: max. 36 months).
6. Cybersecurity investments strengthen infrastructure, processes, and vital data residing in data centers, service platforms, and core network elements. I expect a substantial increase in Capex (and Opex) arising from the telco’s focus on increasing the cyber protection of their critical telecom infrastructure (timeline: max 18 months with urgency).
Core Capex KPIs: Capex share of Total (knowing the share, it is straightforward to get the Capex per Revenue related to the Core), Capex per Incremental demanded data traffic (in Gigabits and Gigabyte per second), Capex per Total traffic, Capex per customer.
Capex modeling comment: In case I have little specific information about an operator’s core network and service platforms, I would tend to model it as a Euro per Customer, Euro per-incremental customer, and Euro per incremental traffic. Checking that I am not violating my Capex range that this category would typically fall within (e.g., 8% to 12%). I would also have to consider obsolescence investments, taking, for example, a percentage of previous cumulated core investments. As mobile operators are in the process, or soon will be, of implementing a 5G standalone core, having an idea of the number of 5G customers and their traffic would be useful to factor that in separately in this Capex category.
Estimating the possible Capex spend on Edge-RAN locations, I would consider that I need ca. 1 μDC per 450 to 700 km2 of O-RAN coverage (i.e., corresponding to a fronthaul distance between the remote radio and the baseband unit of 12 to 15 km). There may be synergies between fixed broadband access locations and the need for μ-datacenters for an O-RAN deployment for an integrated fixed-mobile telco. I suspect that 3rd party towercos, or alike, may eventually also offer this kind of site solutions, possibly sharing the cost with other mobile O-RAN operators.
Transport – core, metro & aggregation investments are between 5% to 15% of Telecom Capex.
The transport network consists of an optical transport network (OTN) connecting all infrastructure nodes via optical fiber. The optical transport network extends down to the access layer from the Core through the Metro and Aggregation layers. On top, the IP network ensures logical connection and control flow of all data transported up and downstream between the infrastructure nodes. As data traffic is carried from the edge of the network upstream, it is aggregated at one or several places in the network (and, of course, disaggregated in the downstream direction). Thus, the higher the transport network, the more bandwidth is supported on the optical and the IP layers. Most of the Capex investment needs would ensure that sufficient optical and IP capacity is available, supporting the growth projections and new service requirements from the business and that no bottlenecks can occur that may have disastrous consequences on customer experience. This mainly comes down to adding cards and ports to the already installed equipment, upgrading & replacing equipment as it reaches capacity or quality limitations, or eventually becoming obsolete. There may be software license fees associated with growth or the introduction of new services that also need to be considered.
Figure 12 above illustrates (high-level) the transport network topology with the optical transport network and IP networking on top. Apart from optical and IP network equipment, this area often includes investments into IP application functions and related hardware (e.g., BNG, DHCP, DNS, AAA RADIUS Servers, …), which have not been shown in the above. In most cases, the underlying optical fiber network would be present and sufficiently scalable, not requiring substantial Capex apart from some repair and minor extensions. Note DWDM: Dense Wavelength-Division multiplexing is an optical fiber multiplexing technology that increases the bandwidth utilization of a FON, BNG: Border Network Gateway connecting subscribers to a network or an internet service providers (ISP) network, important in wholesale arrangements where a 3rd party provides aggregation and access. DHCP: Dynamic Host Configuration Protocol providing IP address allocation and client configurations. AAA: Authentication, Authorization, and Accounting of the subscriber/user, RADIUS: Remote Authentication Dial-In User Service (Server) providing the AAA functionalities.
Although many telcos operate fixed-mobile networks and might even offer fixed-mobile converged services, they may still operate largely separate fixed and mobile networks. It is not uncommon to find very different transport design principles as well as supplier landscapes between fixed and mobile. The maturity, when each was initially built, and technology roadmaps have historically been very different. The fixed traffic dynamics and data volumes are several times higher than mobile traffic. The geographical presence between fixed and mobile tends to be very different (unless the telco of interest is the incumbent with a considerable copper or HFC network). However, the biggest reason for this state of affairs has been people and technology organizations within the telcos resisting change and much more aggressive transport consolidation, which would have been possible.
The mobile traffic could (should!) be accommodated at least from the metro/aggregation layers and upstream through the core transport. There may even be some potential for consolidation on front and backhauls that are worth considering. This would lead to supplier consolidation and organizational synergies as the technology organizations converged into a fixed-mobile engineering organization rather than two separate ones.
I would expect the share of Capex to be on the higher end of the likely range and towards the 10+% at least for the next couple of years, mainly if fixed and mobile networks are being harmonized on the transport level, which may also create an opportunity reduce and harmonize the supplier landscape.
In summary, the following topics would likely be on the Capex priority list;
Life-cycle management (business-as-usual) investments, accommodating growth including new service and quality requirements (annual business-as-usual). There are no indications that the traffic or mobile traffic growth rate over the next five years will be very different from the past. If anything, the 5-year CAGR is slightly decreasing.
Consolidating fixed and mobile transport networks (timelines: 36 to 60 months, depending on network size and geography). Some companies are already in the process of getting this done.
Chinese supplier replacement. To my knowledge, there are fewer regulatory discussions and political pressure for telcos to phase out transport infrastructure. Nevertheless, with the current geopolitical climate (and the upcoming US election in 2024), telcos need to consider this topic very carefully; despite economic (less competition, higher cost), quality, and possible innovation, consequences may result in a departure from such suppliers. It would be a natural consideration in case of modernization needs. An accelerated phase-out may be justified to remove future risks arising from geopolitical pressures.
While I have chosen not to include the Access transport under this category, it is not uncommon to see its budget demand assigned to this category, as the transport side of access (fronthaul and backhaul transport) technically is very synergetic with the transport considerations in aggregation, metro, and core.
Transport Capex KPIs: Capex share of Total, the amount of Capex allocated to Mobile-only and Fixed-only (and, of course, to a harmonized/converged evolved transport network), The Utilization level (if data is available or modeled to this level). The amount of Capex-spend on fiber deployment, active and passive optical transport, and IP.
Capex modeling comment: I would see whether any information is available on a number of core data centers, aggregation, and metro locations. If this information is available, it is possible to get an impression of both core, aggregation, and metro transport networks. If this information is not available, I would assume a sensible transport topology given the particularities of the country where the operator resides, considering whether the operator is an incumbent fixed operator with mobile, a mobile-only operation, or a mobile operator that later has added fixed broadband to its product portfolio. If we are not talking about a greenfield operation, most, if not all, will already be in place, and mainly obsolescence, incremental traffic, and possible transport network extensions would incur Capex. It is important to understand whether fixed-mobile operations have harmonized and integrated their transport infrastructure or large-run those independently of each other. There is substantial Capex synergy in operating an integrated transport network, although it will take time and Capex to get to that integration point.
Access investments are typically between 35% to 50% of the Telecom Capex.
Figure 13 (above) is similar to Figure 8 (above), emphasizing the access part of Fixed and Mobile networks. I have extended the mobile access topology to capture newer development of Open-RAN and fronthaul requirements with pooling (“centralizing”) the baseband (BBU) resources in an edge cloud (e.g., container-sized computing center). Fronthaul & Open-RAN poses requirements to the access transport network. It can be relatively costly to transform a legacy RAN backhaul-only based topology to an Open-RAN fronthaul-based topology. Open-RAN and fronthaul topologies for Greenfield deployments are more flexible and at least require less Capex and Opex.
Mobile Access Capex.
I will define mobile access (or radio access network, RAN) as everything from the antenna on the site location that supports the customers’ usage (or traffic demand) via the active radio equipment (on-site or residing in an edge-cloud datacenter), through the fronthaul and backhaul transport, up to the point before aggregation (i.e., pre-aggregation). It includes passive and active infrastructure on-site, steal & mortar or storage container, front- and backhaul transport, data center software & equipment (that may be required in an edge data center), and any other hardware or software required to have a functional mobile service on whatever G being sold by the mobile operator.
Figure 14 above illustrates a radio access network architecture that is typically deployed by an incumbent telco supporting up to 4G and 5G. A greenfield operation on 5G (and maybe 4G) could (maybe should?) choose to disaggregate the radio access node using an open interface, allowing for a supplier mix between the remote radio head (RRH and digital frontend) at the site location and the centralized (or distributed) baseband unit (BBU). Fronthaul connects the antenna and RRH with a remote BBU that is situated at an edge-cloud data center (e.g., storage container datacenter unit = micro-data center, μDC). Due to latency constraints, the distance between the remote site and the BBU should not be much more than 10 km. It is customary to name the 5G new radio node a gNB (g-Node-B) like the 4G radio node is named eNB (evolved-Node-B).
When considering the mobile access network, it is good to keep in mind that, at the moment, there are at least two main flavors (that can be mixed, of course) to consider. (1) A classical architecture with the site’s radio access hardware and software from a single supplier, with a remote radio head (RRH) as well as digital frontend processing at or near the antenna. The radio nodes do not allow for mixing suppliers between the remote RF and the baseband. Radio nodes are connected to backhaul transmission that may be enabled by fiber or microwave radios. This option is simple and very well-proven. However, it comes with supplier lock-in and possibly less efficient use of baseband resources as these are likewise fixed to the radio node that the baseband unit is installed. (2) A new Open- or disaggregated radio access network (O-RAN), with the Antenna and RHH at the site location (the RU, radio unit in O-RAN), then connected via fronthaul (≤ 10 – 20 km distance) to a μDC that contains the baseband unit (the DU, distributed unit in O-RAN). The μDC would then be connected to the backhaul that connects northbound to the Central Unit (CU), aggregation, and core. The open interface between the RRH (and digital frontend) and the BBU allows different suppliers and hosts the RAN-specific software on common off-the-shelf (COTS) computing equipment. It allows (in theory) for better scaling and efficiency with the baseband resources. However, the framework has not been standardized by the usual bodies of standardization (e.g., 3GPP) and is not universally accepted as a common standard that all telco suppliers would adhere to. It also has not reached maturity yet (sort of obvious) and is currently (as of July 2022) seen to be associated with substantial cyber-security risks (re: maturity). It may be an interesting deployment model for greenfield operations (e.g., Rakuten Mobile Japan, Jio India, 1&1 Germany, Dish Mobile USA). The O-RAN options are depicted in Figure 15 below.
Figure 15 The above illustrates a generic Open RAN architecture starting with the Advanced Antenna System (AAS) and the Radio Unit (RU). The RU contains the functionality associated with the (OSI model) layer 1, partitioned into the lower layer 1 functions with the upper layer 1 functions possibly moved out of the RU and into the Distributed Unit (DU) connected via the fronthaul transport. The DU, which typically will be connected to several RUs, must ensure proper data link management, traffic control, addressing, and reliable communication with the RU (i.e., layer 2 functionalities). The distributed unit connects via the mid-haul transport link to the so-called Central Unit (CU), which typically will be connected to several DUs. The CU plays an important role in the overall ORAN architecture, acting as a central control and management vehicle that coordinates the operations of DUs and RUs, ensuring an efficient and effective operation of the ORAN network. As may be obvious, from the summary of its functionality, layer 3 functionalities reside in the CU. The Central Unit connects via backhaul, aggregation, and core transport to the core network.
For established incumbent mobile operators, I do not see Option (2) as very attractive, at least for the next 5 – 7 years when many legacy technologies (i.e., non-5G) remain to be supported. The main concern should be the maturity, lack of industry-wise standardization, as well as cost of transforming existing access transport networks into compliance with a fronthaul framework. Most likely, some incumbents, the “brave” ones, will deploy O-RAN for 1 or a few 5G bands and keep their legacy networks as is. Most incumbent mobile operators will choose (actually have chosen already) conventional suppliers and the classical topology option to provide their 5G radio access network as it has the highest synergy with the access infrastructure already deployed. Thus, if my assertion is correct, O-RAN will only start becoming mass-market mainstream in 5 to 7 years, when existing deployments become obsolete, and may ultimately become mass-market viable by the introduction of 6G towards the end of the twenties. The verdict is very much still out there, in my opinion.
Planning the mobile-radio access networks Capex requirements is not (that) difficult. Most of it can be mathematically derived and be easily assessed against growth expectations, expected (or targeted) network utilization (or efficiency), and quality. The growth expectations (should) come from consumer and retail businesses’ forecast of mobile customers over the next 3 to 5 years, their expected usage (if they care, otherwise technology should), or data-plan distribution (maybe including technology distributions, if they care. Otherwise, technology should), as well as the desired level of quality (usually the best).
Figure 16 above illustrates a typical cellular planning structural hierarchy from the sector perspective. One site typically has 3 sectors. One sector can have multiple cells depending on the frequency bands installed in the (multi-band) antennas. Massive MiMo antenna systems provide target cellular beams toward the user’s device that extend the range of coverage (via the beam). Very fast scheduling will enable beams to be switched/cycled to other users in the covered sector (a bit oversimplified). Typically, the sector is planned according to the cell utilization, thus on a frequency-by-frequency basis.
Figure 17 illustrates that most investment drivers can be approached as statistical distributions. Those distributions will tell us how much investment is required to ensure that a critical parameter X remains below a pre-defined critical limit Xc within a given probability (i.e., the proportion of the distribution exceeding Xc). The planning approach will typically establish a reference distribution based on actual data. Then based on marketing forecasts, the planners will evolve the reference based on the expected future usage that drives the planning parameter. Example: Let X be the customer’s average speed in a radio cell (e.g., in a given sector of an antenna site) in the busy hour. The business (including technology) has decided it will target 98% of its cells and should provide better than 10 Mbps for more than 50% of the active time a customer uses a given cell. Typically, we will have several quality-based KPIs, and the more breached they are, the more likely it will be that a Capex action is initiated to improve the customer experience.
Network planners will have access to much information down to the cell level (i.e., the active frequency band in a given sector). This helps them develop solid planning and statistical models that provide confidence in the extrapolation of the critical planning parameters as demand changes (typically increases) that subsequently drive the need for expansions, parameter adjustments, and other optimization requirements. As shown in Figure 17 above, it is customary to allow for some cells to breach a defined critical limit Xc, usually though it is kept low to ensure a given customer experience level. Examples of planning parameters could be cell (and sector) utilization in the busy hour, active concurrent users in cell (or sector), duration users spend at a or lower deemed poor speed level in a given cell, physical resource block (the famous PRB, try to ask what it stands for & what it means😉) utilization, etc.
The following topics would likely be on the Capex priority list;
New radio access deployment Capex. This may be for building new sites for coverage, typically in newly built residential areas, and due to capacity requirements where existing sites can no longer support the demand in a given area. Furthermore, this Capex also covers a new technology deployment such as 5G or deploying a new frequency band requiring a new antenna solution like 3.X GHz would do. As independent tower infrastructure companies (towerco) increasingly are used to providing the required passive site infrastructure solution (e.g., location, concrete, or steel masts/towers/poles), this part will not be a Capex item but be charged as Opex back to the mobile operator. From a European mobile radio access network Capex perspective, the average cost of a total site solution, with active as well as passive infrastructure, should have been reduced by ca. 100 thousand plus Euro, which may translate into a monthly Opex charge of 800 to 1300 Euro per site solution. It should be noted that while many operators have spun off their passive site solutions to third parties and thus effectively reduced their site-related Capex, the cost of antennas has increased dramatically as operators have moved away from classical simple SiSo (Single-in Singe-out) passive antennas to much more advanced antenna systems supporting multiple frequency bands, higher-order antennas (e.g., MiMo) and recently also started deploying active antennas (i.e., integrated amplifiers). This is largely also driven by mobile operators commissioning more and more frequency bands on their radio-access sites. The planning horizon needs at least to be 2 years and preferably 3 to 5 years.
Capex investments that accommodate anticipated radio access growth and increased quality requirements. It is normal to be between 18 – 24 months ahead of the present capacity demand overall, accepting no more than 2% to 5% of cells (in BH) to breach a critical specification limit. Several such critical limits would be used for longer-term planning and operational day-to-day monitoring.
Life-cycle management (business-as-usual) investments such as software annual fees, including licenses that are typically structured around the technologies deployed (e.g., 2G, 3G, 4G, and 5G) and active infrastructure modernization replacing radio access equipment (e.g., baseband units, radio units, antennas, …) that have become obsolete. Site reworks or construction optimization would typically be executed (on request from the operator) by the Towerco entity, where the mobile operator leases the passive site infrastructure. Thus, in such instances may not be a Capex item but charged back as an Operational expense to the telco.
Even if there have been fewer regulatory discussions and political pressure for telcos to phase out radio access, Chinese supplier replacement should be considered. Nevertheless, with the current geopolitical climate (and the upcoming US election), telcos need to consider this topic very carefully; despite economic (less competition, higher cost), quality, and possible innovation, consequences may result in a departure from such suppliers. It would be a natural consideration in case of modernization needs. An accelerated phase-out may be justified to remove future risks arising from geopolitical pressures, although it would result in above-and-beyond capital commitment over a shorter period than otherwise would be the case. Telco valuation may suffer more in the short to medium term than otherwise would have been the case with a more natural phaseout due to obsolescence.
Mobile Access Capex KPIs: Capex share of Total, Access Utilization (reported/planned data traffic demand to the data traffic that could be supplied if all or part of the spectrum was activated), Capex per Site location, Capex per Incremental data traffic demand (in Gigabyte and Gigabit per second which is the real investment driver), Capex per Total Traffic (in Gigabyte and Gigabit per second), Capex per Mobile Customer and Capex to Mobile Revenue (preferably service revenue but the total is fine if the other is not available). As a rule of thumb, 50% of a mobile network typically covers rural areas, which also may carry less than 20% of the total data traffic.
Whether actual and planned Capex is available or an analyst is modeling it, the above KPIs should be followed over an extended period. A single year does not tell much of a story.
Capex modeling comment: When modeling the Capex required for the radio access network, you need to have an idea about how many sites your target telco has. There are many ways to get to that number. In most European countries, it is a matter of public record. Most telcos, nowadays, rarely build their own passive site infrastructure but get that from independent third-party tower companies (e.g., CellNex w. ca. 75k locations, Vantage Towers w. ca. 82k locations, … ) or site-share on another operators site locations if available. So, modeling the RAN Capex is a matter of having a benchmark of the active equipment, knowing what active equipment is most likely to be deployed and how much. I see this as being an iterative modeling process. Given the number of sites and historical Capex, it is possible to come to a reasonable estimate of both volumes of sites being changed and the range of unit Capex (given good guestimates of active equipment pricing range). Of course, in case you are doing a Capex review, the data should be available to you, and the exercise should be straightforward. The mobile Capex KPIs above will allow for consistency checks of a modeling exercise or guide a Capex review process.
I recommend using the classical topology described above when building a radio access model. That is unless you have information that the telco under analysis is transforming to a disaggregated topology with both fronthaul and backhaul. Remember you are not only required to capture the Capex for what is associated with the site location but also what is spent on the access transport. Otherwise, there is a chance that you over-estimate the unit-Capex for the site-related investments.
It is also worth keeping in mind that typically, the first place a telecom company would cut Capex (or down-prioritize) is pressured during the planning process would be in the radio access network category. The reason is that the site-related unitary capex tends to be incredibly well-defined. If you reduce your rollout to 100 site-related units, you should have a very well-defined quantum of Capex that can be allocated to another category. Also, the operational impact of cutting in this category tends to be very well-defined. Depending on how well planned the overall Capex has been done, there typically would be a slack of 5% to 10% overall that could be re-assigned or ultimately reduced if financial results warrant such a move.
Fixed Access Capex.
As mobile access, fixed access is about getting your service out to your customers. Or, if you are a wholesale provider, you can provide the means of your wholesale customer reaching their customer by providing your own fixed access transport infrastructure. Fixed access is about connecting the home, the office, the public institution (e.g., school), or whatever type of dwelling in general.
Figure 18 illustrates a fixed access network and its position in the overall telco architecture. The following make up the ODN (Optical Distribution Network); OLT: Optical Line Termination, ODF: Optical Distribution Frame, POS: Passive Optical Splitter, ONT: Optical Network Termination. At the customer premise, besides the ONT, we have the CPE: Customer Premise Equipment and the STB: Set-Top Box. Suppose you are an operator that bought wholesale fixed access from another telco’ (incl. Open Access Providers, OAPs). In that case, you may require a BNG to establish the connection with your customer’s CPE and STB through the wholesale access network.
As fiber optical access networks are being deployed across Europe, this tends to be a substantial Capex item on the budgets of telcos. Here we have two main Capex drivers. First is the Capex for deploying fibers across urban areas, which provides coverage for households (or dwellings) and is measured as Capex-per-homes passed. Second is the Capex required for establishing the connection to households (or dwellings). The method of fiber deployment is either buried, possibly using existing ducts or underground passageways, or via aerial deployment using established poles (e.g., power poles or street furniture poles) or new poles deployed with the fiber deployment. Aerial deployment tends to incur lower Capex than buried fiber solutions due to requiring less civil work. The OLT, ODF, POS, and optical fiber planning, design, and build to provide home coverage depends on the home-passed deployment ambition. The fiber to connect a home (i.e., civil work and materials), ONT, CPE, and STBs are driven by homes connected (or FTTH connected). Typically, CPE and STBs are not included in the Access Capex but should be accounted for as a separate business-driven Capex item.
The network solutions (BNG, OLT, Routers, Switches, …) outside the customer’s dwelling come in the form of a cabinet and appropriate cards to populate the cabinet. The cards provide the capacity and serviced speed (e.g., 100 Mbps, 300 Mbps, 1 Gbps, 10 Gbps, …) sold to the fixed broadband customer. Moreover, for some of the deployed solutions, there is likely a mandatory software (incl. features) fee and possibly both optional and custom-specific features (although rare to see that in mainstream deployments). It should be clear (but you would be surprised) that ONT and CPE should support the provisioned speed of the fixed access network. The customer cannot get more quality than the minimum level of either the ONT, CPE, or what the ODN has been built to deliver. In other words, if the networking cards have been deployed only to support up to 1 Gbps and your ONT, and CPE may support 3 Gbps or more, your customer will not be able to have a service beyond 1 Gbps. Of course, the other way around as well. I cannot stress enough the importance of longer-term planning in this respect. Your network should be as flexible as possible in providing customer services. It may seem that Capex savings can be made by only deploying capacity sold today or may be required by business over the next 12 months. While taking a 3 to 5-year view on the deployed network capacity and ONT/CPEs provided to customers avoids having to rip out relatively new equipment or finance the significant replacement of obsolete customer premise equipment that no longer can support the services required.
When we look at the economic drivers for fixed access, we can look at the capital cost of deploying a kilometer of fiber. This is particularly interesting if we are only interested in the fiber deployment itself and nothing else. Depending on the type of clutter, deployment, and labor cost occur. Maybe it is more interesting to bundle your investment into what is required to pass a household and what is required to connect a household (after it has been passed). Thus, we look at the Capex-per-home (or dwellings) passed and separate the Capex to connect an individual customer’s premise. It is important to realize that these Capex drivers are not just a single value but will depend on the household density depends on the type of area the deployment happens. We generally expect dense urban clutters to have a high dwelling density; thus, more households are covered (or passed) per km of fiber deployed. Dense-urban areas, however, may not necessarily hold the highest density of potential residential customers and hold less retail interest in the retail business. Generally, urban areas have higher household densities (including residential households) than sub-urban clutter. Rural areas are expected to have the lowest density and, thus, the most costly (on a household basis) to deploy.
Figure 19, just below, illustrates the basic economics of buried (as opposed to aerial) fiber for FTTH homes passed and FTTH homes connected. Apart from showing the intuitive economic logic, the cost per home passed or connected is driven by the household density (note: it’s one driver and fairly important but does not capture all the factors). This may serve as a base for rough assessments of the cost of fiber deployment in homes passed and homes connected as a function of household density. I have used data in the Fiber-to-the-Home Council Europe report of July 2012 (10 years old), “The Cost of Meeting Europe’s Network Needs”, and have corrected for the European inflationary price increase since 2012 of ca. 14% and raised that to 20% to account for increased demand for FTTH related work by third parties. Then I checked this against some data points known to me (which do not coincide with the cities quoted in the chart). These data points relate to buried fiber, including the homes connected cost chart. Aerial fiber deployment (including home connected) would cost less than depicted here. Of course, some care should be taken in generalizing this to actual projects where proper knowledge of the local circumstances is preferred to the above.
Figure 19 The “chicken and egg” of connecting customers’ premises with fiber and providing them with 100s of Mbps up to Gbps broadband quality is that the fibers need to pass the home first before the home can be connected. The cost of passing a premise (i.e., the home passed) and connecting a premise (home connected) should, for planning purposes, be split up. The cost of rolling out fiber to get homes-passed coverage is not surprisingly particularly sensitive to household density. We will have more households per unit area in urban areas compared to rural areas. Connecting a home is more sensitive to household density in deep rural areas where the distance from the main fiber line connection point to the household may be longer. The above cost curves are for buried fiber lines and are in 2021 prices.
Aerial fiber deployment would generally be less capital-intensive due to faster and easier deployment (less civil work, including permitting) using pre-existing (or newly built) poles. Not every country allows aerial deployment or even has the infrastructure (i.e., poles) available, which may be medium and low-voltage poles (e.g., for last-mile access). Some countries will have a policy allowing only buried fibers in the city or metropolitan areas and supporting pole infrastructure for aerial deployment in sub-urban and rural clutters. I have tried to illustrate this with Figure 18 below, where the pie charts show the aerial potential and share that may have to be assigned to buried fiber deployment.
Figure 20 above illustrates the amount of fiber coverage (i.e., in terms of homes passed) in Western European markets. The number for 2015 and 2021 is based on European Commission’s “Broadband Coverage in Europe 2021” (authored by Omdia et al.). The 2025 & 2031 coverage numbers are my extrapolation of the 5-year trend leading up to 2021, considering the potential for aerial versus buried deployment. Aerial making accelerated deployment gains is more likely than in markets that only have buried fiber as a possibility, either because of regulation or lack of appropriate infrastructure for aerials. The only country that may be below 50% FTTH coverage in 2025 is Germany (i.e., DE), with a projected 39% of homes passed by 2025. Should Germany aim for 50% instead, they would have to do ca. 15 million households passed or, on average, 3 million a year from 2021 to 2025. Maximum Germany achieved in one year was in 2020, with ca. 1.4 million homes passed (i.e., Covid was good for getting “things done”). In 2021 this number dropped to ca. 700 thousand or half of the 2020 number. The maximum any country in Europe has done in one year was France, with 2.9 million homes passed in 2018. However, France does allow for aerial fiber deployment outside major metropolitan areas.
Figure 21 above provides an overview across Western Europe for the last 5 years (2016 – 2021) of average annual household fiber deployment, the maximum done in one year in the previous 5 years, and the average required to achieve household coverage in 2026 shown above in Figure 20. For Germany (DE), the average deployment pace of 3.23 homes passed per year (orange bar) would then result in a coverage estimate of 25%. I don’t see any practical reasons for the UK, France, and Italy not to make the estimated household coverage by 2026, which may exceed my estimates.
From a deployment pace and Capex perspective, it is good to keep in mind that as time goes by, the deployment cost per household is likely to increase as household density reduces when the deployment moves from metropolitan areas toward suburban and rural. Thus, even if the deployment pace may reduce naturally for many countries in Figure 20 towards 2025, absolute Capex may not necessarily reduce accordingly.
In summary, the following topics would likely be on the Capex priority list;
Continued fiber deployment to achieve household coverage. Based on Figure 17, at household (HH) densities above 500 per km2, the unit Capex for buried fiber should be below 900 Euro per HH passed with an average of 600 Euro per HH passed. Below 500 HH per km2, the cost increases rapidly towards 3,000 Euro per HH passed. The aerial deployment will result in substantially lower Capex, maybe with as much as 50% lower unit Capex.
As customers subscribe, the fiber access cost associated with connecting homes (last-mile connectivity) will need to be considered. Figure 17 provides some guidance regarding the quantum-Euro range expected for buried fiber. Aerial-based connections may be somewhat cheaper.
Life-cycle management (business-as-usual) investments, modernization investments, accommodating growth including new service and quality requirements (annual business as usual). Typically it would be upgrading OLT, ONTs, routers, and switches to support higher bandwidth requirements upgrading line cards (or interface cards), and moving from ≤100 Mbps to 1 Gbps and 10 Gbps. Many telcos will be considering upgrading their GPON (Gigabit Passive Optical Networks, 2.5 Gbps↓ / 1.2 Gbps↑) to provide XGPON (10 Gbps↓ / 2.5 Gbps↑) or even XGSPON services (10 Gbps↓ / 10 Gbps↑).
Chinese supplier exposure and risks (i.e., political and regulatory enforcement) may be an issue in some Western European markets and require accelerated phase-out capital needs. In general, I don’t see fixed access infrastructure being a priority in this respect, given the strong focus on increasing household fiber coverage, which already takes up a lot of human and financial resources. However, this topic needs to be considered in case of obsolescence and thus would be a business case and performance-driven with a risk adjustment in dealing with Chinese suppliers at that point in time.
Fixed Access Capex KPIs: Capex share of Total, Capex per km, Number of HH passed and connected, Capex per HH passed, Capex per HH connected, Capex to Incremental Traffic, GPON, XGPON and XGSPON share of Capex and Households connected.
Whether actual and planned Capex is available or an analyst is modeling it, the above KPIs should be followed over an extended period. A single year does not tell much of a story.
Capex modeling comment: In a modeling exercise, I would use estimates for the telco’s household coverage plans as well as the expected household-connected sales projections. Hopefully, historical numbers would be available to the analyst that can be used to estimate the unit-Capex for a household passed and a household connected. You need to have an idea of where the telco is in terms of household density, and thus as time goes by, you may assume that the cost of deployment per household increases somewhat. For example, use Figure 18 to guide the scaling curve you need. The above-fixed access Capex KPIs should allow checking for inconsistencies in your model or, if you are reviewing a Capex plan, whether that Capex plan is self-consistent with the data provided.
If anyone would have doubted it, there is still much to do with fiber optical deployment in Western Europe. We still have around 100+ million homes to pass and a likely capital investment need of 100+ billion euros. Fiber deployment will remain a tremendously important investment area for the foreseeable future.
Figure 22 shows the remaining fiber coverage in homes passed based on 2021 actuals for urban and rural areas. In general, it is expected that once urban areas’ coverage has reached 80% to 90%, the further coverage-based rollout will reduce. Though, for attractive urban areas, overbuilt, that is, deploying fiber where there already are fibers deployed, is likely to continue.
Figure 23 The top illustrates the next 5 years’ weekly rollout to reach an 80% to 90% household coverage range by 2025. The bottom, it shows an estimate of the remaining capital investment required to reach that 80% to 90% coverage range. This assessment is based on 2021 actuals from the European Commission’s “Broadband Coverage in Europe 2021” (authored by Omdia et al.); the weekly activity and Capex levels are thus from 2022 onwards.
In many Western European countries, the pace is expected to be increased considerably compared to the previous 5 years (i.e., 2016 – 2021). Even if the above figure may be over-optimistic, with respect to the goal of 2026, the European ambition for fiberizing European markets will impose a lot of pressure on speedy deployment.
IT investment levels are typically between 15% and 25% of Telecom Capex.
IT may be the most complex area to reach a consensus on concerning Capex. In my experience, it is also the area within a telco with the highest and most emotional discussion overhead within the operations and at a Board level. Just like everyone is far better at driving a car than the average driver, everyone is far better at IT than the IT experts and knows exactly what is wrong with IT and how to make IT much better and much faster, and much cheaper (if there ever was an area in telco-land where there are too many cooks).
Why is that the case? I tend to say that IT is much more “touchy-feely” than networks where most of the Capex can be estimated almost mathematically (and sufficiently complicated for non-technology folks to not bother with it too much … btw I tend to disagree with this from a system or architecture perspective). Of course, that is also not the whole truth.
IT designs, plans, develops (or builds), and operates all the business support systems that enable the business to sell to its customers, support its customers, and in general, keep the relationship with the customer throughout the customer life-cycle across all the products and services offered by the business irrespective of it being fixed or mobile or converged. IT has much more intense interactions with the business than any other technology department, whose purpose is to support the business in enabling its requirements.
Most of the IT Capex is related to people’s work, such as development, maintenance, and operations. Thus capitalized labor of external and internal labor is the main driver for IT Capex. The work relates to maintaining and improving existing services and products and developing new ones on the IT system landscape or IT stacks. In 2021, Western European telco Capex spending was about 20% of their total revenue. Out of that, 4±1 % or in the order of 10±3 billion Euro is spent on IT. With ca. 714 million fixed and mobile subscribers, this corresponds to an IT average spend of 14 Euros per telco customer in 2021. Best investment practices should aim at an IT Capex spend at or below 3% of revenue on average over 5 years (to avoid penalizing IT transformation programs). As a rule of thumb, if you do not have any details of internal cost structure (I bet you usually would not have that information), assume that the IT-related Opex has a similar quantum as Capex (you may compensate for GDP differences between markets). Thus, the total IT spend (Capex and Opex) would be in the order of 2×Capex, so the IT Spend to Revenue double the IT-related Capex to Revenue. While these considerations would give you an idea of the IT investment level and drill down a bit further into cost structure details, it is wise to keep in mind that it’s all a macro average, and the spread can be pretty significant. For example, two telcos with roughly the same number of customers, IT landscape, and complexity and have pretty different revenue levels (e.g., due to differences in ARPU that can be achieved in the particular market) may have comparable absolute IT spending levels but very different relative levels compared to the revenue. I also know of telcos with very low total IT spend to Revenue ITR (shareholder imposed), which had (and have) a horrid IT infrastructure performance with very extended outages (days) on billing and frequent instabilities all over its IT systems. Whatever might have been saved by imposing a dramatic reduction in the IT Capex (e.g., remember 10 million euros Capex reduction equivalent to 200 million euros value enhancement) was more than lost on inferior customer service and experience (including the inability to bill the customers).
You will find industry experts and pundits that expertly insist that your IT development spend is way too high or too low (although the latter is rare!). I recommend respectfully taking such banter seriously. Although try to understand what they are comparing with, what KPIs they are using, and whether it’s apples for apples and not with pineapples. In my experience, I would expect a mobile-only business to have a better IT spend level than a fixed-mobile telco, as a mobile IT landscape tends to be more modern and relatively simple compared to a fixed IT landscape. First, we often find more legacy (and I mean with a capital L) in the fixed IT landscape with much older services and products still being kept operational. The fixed IT landscape is highly customized, making transformation and modernization complex and costly. At least if old and older legacy products must remain operational. Another false friend in comparing one company IT spending with another’s is that the cost structure may be different. For example, it is worth understanding where OSS (Operational Support System) development is accounted for. Is it in the IT spend, or is it in the Network-side of things? Service platforms and Data Centers may be another difference where such spending may be with IT or Networks.
Figure 24 shows the helicopter view of a traditional telco IT architectural stack. Unless the telco is a true greenfield, it is a very normal state of affairs to have multiple co-existing stacks, which may have some degree of integration at various levels (sub-layers). Most fixed-mobile telcos remain with a high degree of IT architecture separation between their mobile and fixed business on a retail and B2B level. When approaching IT, investments never consider just one year. Understand their IT investment strategy in the immediate past (2-3 years prior) as well as how that fits with known and immediate future investments (2 – 3 years out).
Above, Figure 24 illustrates the typical layers and sub-layers in an IT stack. Every sub-layer may contain different applications, functionalities, and systems, all with an over-arching property of the sub-layer description. It is not uncommon for a telco to have multiple IT stacks serving different brands (e.g., value, premium, …) and products (e.g., mobile, fixed, converged) and business lines (e.g., consumer/retail, business-to-business, wholesale, …). Some layers may be consolidated across stacks, and others may be more fragmented. The most common division is between fixed and mobile product categories, as historically, the IT business support systems (BSS) as well as the operational support systems (OSS) were segregated and might even have been managed by two different IT departments (that kind of silliness is more historical albeit recent).
Figure 25 shows a typical fixed-mobile incumbent (i.e., anything not greenfield) multi-stack IT architecture and their most likely aspiration of aggressive integrated stack supporting a fixed-mobile conversion business. Out of experience, I am not a big fan of retail & B2B IT stack integration. It creates a lot of operational complexity and muddies the investment transparency and economics of particular B2B at the expense of the retail business.
A typical IT landscape supporting fixed and mobile services may have quite a few IT stacks and a wide range of solutions for various products and services. It is not uncommon that a Fixed-Mobile telco would have several mobile brands (e.g., premium, value, …) and a separate (from an IT architecture perspective, at least) fixed brand. Then in addition, there may be differences between the retail (business-to-consumer, B2C) and the business-to-business (B2B) side of the telco, also being supported by separate stacks or different partitions of a stack. This is illustrated in Figure 24 above. In order for the telco business to become more efficient with respect to its IT landscape, including development, maintenance, and operational aspects of managing a complex IT infrastructure landscape, it should strive to consolidate stacks where it makes sense and not un-importantly along the business wish of convergence at least between fixed and mobile.
Figure 24 above illustrates an example of an IT stack harmonization activity long retail brands as well as Fixed and Mobile products as well as a separation of stacks into a retail and a business-to-business stack. It is, of course, possible to leverage some of the business logic and product synergies between B2C and B2B by harmonizing IT stacks across both business domains. However, in my experience, nothing great comes out of that, and more likely than not, you will penalize B2C by spending above and beyond value & investment attention on B2B. The B2B requirements tend to be significantly more complex to implement, their specifications change frequently (in line with their business customers’ demand), and the unit cost of development returns less unit revenue than the consumer part. Economically and from a value-consideration perspective, the telco needs to find an IT stack solution that is more in line with what B2B contributes to the valuation and fits its requirements. That may be a big challenge, particularly for minor players, as its business rarely justifies a standalone IT stack or developments. At least not a stack that is developed and maintained at the same high-quality level as a consumer stack. There is simply a mismatch in the B2B requirements, often having much higher quality and functionality requirements than the consumer part, and what it contributes to the business compared to, for example, B2C.
When I judge IT Capex, I care less about the absolute level of spend (within reason, of course) than what is practical to support within the given IT landscape the organization has been dealt with and, of course, the organization itself, including 3rd party support. Most systems will have development constraints and a natural order of how development can be executed. It will not matter how much money you are given or how many resources you throw at some problems; there will be an optimum amount of resources and time required to complete a task. This naturally leads to prioritization which may lead to disappointment of some stakeholders and projects that may not be prioritized to the degree they might feel entitled to.
When looking at IT capital spending and comparing one telco with another, it is worthwhile to take a 3- to 5-year time horizon, as telcos may be in different business and transformation cycles. A one-year comparison or benchmark may not be appropriate for understanding a given IT-spend journey and its operational and strategic rationale. Search for incidents (frequency and severity) that may indicate inappropriate spend prioritization or overall too little available IT budget.
The IT Capex budget would typically be split into (a) Consumer or retail part (i.e., B2C), (b) Business to Business and wholesale part, (c) IT technical part (optimization, modernization, cloudification, and transformations in general), and a (d) General and Administrative (G&A) part (e.g., Finance, HR, ..). Many IT-related projects, particularly of transformative nature, will run over multiple years (although if much more than 24 months, the risk of failure and monetary waste increases rapidly) and should be planned accordingly. For the business-driven demand (from the consumer, business, and wholesale), it makes sense to assign Capex proportional to the segment’s revenue and the customers those segments support and leverage any synergies in the development work required by the business units. For IT, capital spending should be assigned, ensuring that technical debt is manageable across the IT infrastructure and landscape and that efficiency gains arising from transformative projects (including landscape modernization) are delivered timely. In general, such IT projects promise efficiency in terms of more agile development possibilities (faster time to market), lower development and operational costs, and, last but not least, improved quality in terms of stability and reduced incidents. The G&A prioritizes finance projects and then HR and other corporate projects.
In summary, the following topics would likely be on the Capex priority list;
Provide IT development support for business demand in the next business plan cycle (3 – 5 years with a strong emphasis on the year ahead). The allocation key should be close to the Revenue (or Ebitda) and customer contribution expected within the budget planning period. The development focus is on maintenance, (incremental) improvements to existing products/services, and new products/services required to make the business plans. In my experience, the initial demand tends to be 2 to 3 times higher than what a reasonable financial envelope would dictate (i.e., even considering what is possible to do within the natural limitations of the given IT landscape and organization) and what is ultimately agreed upon.
Cloudification transformation journey moving away from the traditional monolithic IT platform and into a public, hybrid, or private cloud environment. In my opinion, the safest approach is a “lift-and-shift” approach where existing functionality is developed in the cloud environment. After a successful migration from the traditional monolithic platform into the cloud environment, the next phase of the cloudification journey will be to move to a cloud-native framework should be embarked. This provides a very solid automation framework delivering additional efficiencies and improved stability and quality (e.g., reduction in incidents). Analysts should be aware that migrating to a (public) cloud environment may reduce the capitalization possibilities with the consequence that Capex may reduce in the forward budget planning, but this would be at the expense of increased Opex for the IT organization.
Stack consolidation. Reducing the number of IT stacks generally lowers the IT Capex demand and improves development efficiency, stability, and quality. The trend is to focus on the harmonization efforts on the frontend (Portals and Outlets layer in Figure 14), the CRM layer (retiring legacy or older CRM solutions), and moving down the layers of the IT stack (see Figure 14) often touching the complex backend systems when they become obsolete providing an opportunity to migrate to a modern cloud-based solution (e.g., cloud billing).
Modernization activities are not covered by cloudification investments or business requirements.
Development support for Finance (e.g., ERP/SAP requirements), HR requirements, and other miscellaneous activities not captured above.
Chinese suppliers are rarely an issue in Western European telecom’s IT landscape. However, if present in a telco’s IT environment, I would expect Capex has been allocated for phasing out that supplier urgently over the next 24 months (pending the complexity of such a transformation/migration program) due to strong political and regulatory pressures. Such an initiative may have a value-destructing impact as business-driven IT development (related to the specific system) might not be prioritized too highly during such a program and thus result in less ability to compete for the telco during a phase-out program.
IT Capex KPIs: IT share of Total Capex (if available, broken down into a Fixed and Mobile part),IT Capex to Revenue, ITR (IT total spend to Revenue), IT Capex per Customer, IT Capex per Employee, IT FTEs to Total FTEs.
Moreover, if available or being modeled, I would like to have an idea about how much of the IT Capex goes to investment categories such as (i) Maintain, (ii) Growth, and (iii) Transform. I will get worried if the majority of IT Capex over an extended period goes to the Growth category and little to Maintain and Transform. This indicates a telco that has deprioritized quality and ignores efficiency, resulting in the risk of value destruction over time (if such a trend were sustained). A telco with little Transform spend (again over an extended period) is a business that does not modernize (another word for sweating assets).
Capex modeling comment: when I am modeling IT and have little information available, I would first assume an IT Capex to Revenue ratio around 4% (mobile-only) to 6% (fixed-mobile operation) and check as I develop the other telco Capex components whether the IT Capex stays within 15% to 25%. Of course, keep an eye out for all the above IT Capex KPIs, as they provide a more holistic picture of how much confidence you can have in the Capex model.
Figure 26 illustrates the anticipated IT Capex to Revenue ranges for 2024: using New Street Research (total) Capex data for Western Europe, the author’s own Capex projection modeling, and using the heuristics that IT spend typically would be 15% to 25% of the total Capex, we can estimate the most likely ranges of IT Capex to Revenue for the telecommunications business covered by NSR for 2024. For individual operations, we may also want to look at the time series of IT spending to revenue and compare that to any available intelligence (e.g., transformation intensive, M&A integration, business-as-usual, etc..)
Using the heuristic of the IT Capex being between 15% (1st quantile) and 25% (3rd quantile) of the total Capex, we can get an impression of how much individual Telcos invest in IT annually. The above chart shows such an estimate for 2024. I have the historical IT spending levels for several Western European Telcos, which agree well with the above and would typically be a bit below the median unless a Telco is in the progress of a major IT transformation (e.g., after a merger, structural separation, Huawei forced replacement, etc..). One would also expect and should check that the total IT spend, Capex and Opex, are decreasing over time when the transformational IT spend has been removed. If this is observed, it would indicate that Telco does become increasingly more efficient in its IT operation. Usually, the biggest effect should be in IT Opex reduction over time.
Figure 27 illustrates the anticipated IT Capex to Customer ranges for 2024: having estimated the likely IT spend ranges (in Figure 26) for various Western European telcos, allows us to estimate the expected 2024 IT spend per customer (using New Street Research data, author’s own Capex projection model and the IT heuristics describe in the section). In general and in the absence of structural IT transformation programs, I would expect the IT per customer spend to be below the median. Some notes to the above results: TDC (Nuuday & TDC Net) has major IT transformation programs ongoing after the structural separation, KPN is in progress with replacing their Huawei BSS, and I would expect them to be at the upper part of IT spending, Telenor Norway seems higher than I would expect but is an incumbent that traditionally spends substantially more than its competitors so might be okay but caution should be taken here, Switzerland in general and Swisscom, in particular, is higher than I would have expected. This said, it is a sophisticated Telco services market that would be likely to spend above the European average, irrespective I would take some caution with the above representation for Switzerland & Swisscom.
Similar to the IT Capex to Revenue, we can get an impression of what Telcos spend on IT Capex as it relates to their total mobile and fixed customer base. Again for Telcos in Western Europe (as well as outside), these ranges shown above do seem reasonable as the estimated range of where one would expect the IT spend. The analyst is always encouraged to look at this over a 3- to 5-year period to better appreciate the trend and should keep in mind that not all Telcos are in synch with their IT investments (as hopefully is obvious as transformation strategies and business cycles may be very different even within the same market).
Other, or miscellaneous, investments tend to be between 3% and 8% of the Telecom Capex.
When modeling a telco’s Capex, I find it very helpful to keep an “Other” or “Miscellaneous” Capex category for anything non-technology related. Modeling-wise, having a placeholder for items you don’t know about or may have forgotten is convenient. I typically start my models with 15% of all Capex. As my model matures, I should be able to reduce this to below 10% and preferably down to 5% (but I will accept 8% as a kind of good enough limit). I have had Capx review assignments where the Capex for future years had close to 20% in the “Miscellaneous.” If this “unspecified” Capex would not be included, the Capex to Revenue in the later years would drop substantially to a level that might not be deemed credible. In my experience, every planned Capex category will have a bit of “Other”-ness included as many smaller things require Capex but are difficult to mathematically derive a measure for. I tend to leave it if it is below 5% of a given Capex category. However, if it is substantial (>5%), it may reveal “sandbagging” or simply less maturity in the Capex planning and budget process.
Apart from a placeholder for stuff we don’t know, you will typically find Capex for shop refurbishment or modernization here, including office improvements and IT investments.
DE-AVERAGING THE TELECOM CAPEX TO FIXED AND MOBILE CONTRIBUTIONS.
There are similar heuristics to go deeper down into where the Capex should be spent, but that is a detail for another time.
Our first step is decomposing the total Capex into a fixed and a mobile component. We find that a multi-linear model including Total Capex, Mobile Customers, Mobile Service Revenue, Fixed Customers, and Fixed Service Revenues can account for 93% of the Capex trend. The multi-linear regression formula looks like the following;
with C = Capex, N = total customer count, R = service revenue, and α and β are the regression coefficient estimates from the multi-linear regression. The Capex model has been trained on 80% of the data (1,008 data points) chosen randomly and validated on the remainder (252 data points). All regression coefficients (4 in total) are statistically significant, with p-values well below a 95% confidence level.
Figure 28 above shows the Predicted Capex versus the Actual Capex. It illustrates that the predicted model agreed reasonably well with the actual Capex, which would also be expected based on the statistical KPIs resulting from the fit.
The Total is (obviously) available to us and therefore allows us to estimate both fixed and mobile Capex levels, by
The result of the fixed-mobile Capex decomposition is shown in Figure 26 below. Apart from being (reasonably) statistically sound, it is comforting that the trend in Capex for fixed and mobile seem to agree with what our intuition should be. The increase in mobile Capex (for Western Europe) over the last 5 years appears reasonable, given that 5G deployment commenced in early 2019. During the Covid lockdown from early 2020, fixed revenue was boosted by a massive shift in fixed broadband traffic (and voice) from the office to the individuals’ homes. Likewise, mobile service revenues have been in slow decline for years. Thus, the Capex increase due to 5G and reduced mobile service revenues ultimately leads to a relatively more significant increase in the mobile Capex to Revenue ratio.
Figure 29 illustrates the statistical modeling (by multi-linear regression), or decomposition, of the Total Capex as a function of Mobile Customers, Mobile Service Revenues, Fixed Customers, and Fixed Service Revenues, allowing to break up of the Capex into Fixed and Mobile components by decomposing the total Capex. The absolute Capex level is higher for fixed than what is found for mobile, with about a factor of 2 until 2021, when mobile Capex increases due to 5G investments in the mobile industry. It is found that the Mobile Capex has increased the most over the last 5 years (e.g., 5G deployment) while the service revenues have declined somewhat over the same period. This increased the Mobile Capex to Service Revenue ratio (note: based on Total Revenue, the ratio would be somewhat smaller, by ca. 17%). Source: Total Capex, Fixed, and Mobile Service revenues from New Street Research data for Western Europe. Note: The decomposition of the total Capex into Fixed and Mobile Capex is based on the author’s own statistical analysis and modeling. It is not a delivery of the New Street Research report.
CAN MOBILE-TRAFFIC GROWTH CONTINUE TO BE ACCOMMODATED CAPEX-WISE?
In my opinion, there has been much panic in our industry in the past about exhausting the cellular capacity of mobile networks and the imminent doom of our industry. A fear fueled by the exponential growth of user demand perceived inadequate spectrum amount and low spectral efficiency of the deployed cellular technologies, e.g., 3G-HSPA, classical passive single-in single-out antennas. Going back to the “hey-days” of 3G-HSPA, there was a fear that if cellular demand kept its growth rate, it would result in supply requirements going towards infinity and the required Capex likewise. So clearly an unsustainable business model for the mobile industry. Today, there is (in my opinion) no basis for such fears short or medium-term. With the increased fiberization of our society, where most homes will be connected to fiber within the next 5 – 10 years, cellular doomsday, in the sense of running out of capacity or needing infinite levels of Capex to sustain cellular demand, maybe a day never to come.
In Western Europe, the total mobile subscriber penetration was ca. 130% of the total population in 2021, with an excess of approximately 2.1+ mobile devices per subscriber. Mobile internet penetration was 76% of the total population in 2021 and is expected to reach 83% by 2025. In 2021, Europe’s average smartphone penetration rate was 77.6%, and it is projected to be around 84% by 2025. Also, by 2024±1, 50% of all connections in Western Europe are projected to be 5G connections. There are some expectations that around 2030, 6G might start being introduced in Western European markets. 2G and 3G will be increasingly phased out of the Western European mobile networks, and the spectrum will be repurposed for 4G and eventually 5G.
The above Figure 30 shows forecasted mobile users by their main mobile access technology. Source: based on the author’s forecast model relying on past technology diffusion trends for Western Europe and benchmarked against some WEU markets and other telco projections. See also 5G Standalone – European Demand & Expectations by Kim Larsen.
We may not see a complete phase-out of either older Gs, as observed in Figure 19. Due to a relatively large base of non-VOLTE (Voice-over-LTE) devices, mobile networks will have to support voice circuit-switched fallback to 2G or 3G. Furthermore, for the foreseeable future, it would be unlikely that all visiting roaming customers would have VOLTE-based devices. Furthermore, there might be legacy machine-2-machine businesses that would be prohibitively costly and complex to migrate from existing 2G or 3G networks to either LTE or 5G. All in all, ensure that 2G and 3G may remain with us for reasonably long.
Figure 31 above shows that mobile and fixed data traffic consumption is growing in totality and per-user level. On average mobile traffic grew faster than fixed from 2015 to 2021. A trend that is expected to continue with the introduction of 5G. Although the total traffic growth rate is slowing down somewhat over the period, on a per-user basis (mobile as well as fixed), the consumptive growth rate has remained stable.
Since the early days of 3G-HSPA (High-Speed Packet Access) radio access, investors and telco businesses have been worried that there would be an end to how much demand could be supported in our cellular networks. The “fear” is often triggered by seeing the exponential growth trend of total traffic or of the usage per customer (to be honest, that fear has not been made smaller by technology folks “panicking” as well).
Let us look at the numbers for 2021 as they are reported in the Cisco VNI report. The total mobile data traffic was in the order of 4 Exabytes (4 Billion gigabytes, GB), more than 5.5× the level of 2016. It is more than 600 million times the average mobile data consumption of 6.5 GB per month per customer (in 2021). Compare this with the Western European population of ca. 200 million. While big numbers, the 6.5 GB per month per customer is insignificant. Assuming that most of this volume comes from video streaming at an optimum speed of 3 – 5 Mbps (good enough for HD video stream), the 6.5 GB translates into approx. 3 – 5 hours of video streaming over a month.
The above Figure 32 Illustrates a 24-hour workday total data demand on the mobile network infrastructure. A weekend profile would be more flattish. We spend at least 12 hours in our home, ca. 7 hours at work (including school), and a maximum of 5 hours (~20%) commuting, shopping, and otherwise being away from our home or workplace. Previous studies of mobile traffic load have shown that 80% of a consumer’s mobile demand falls in 3 main radio node sites around the home and workplace. The remaining 20% tends to be much more mobile-like in the sense of being spread out over many different radio-node sites.
Daily we have an average of ca. 215 Megabytes per day (if spread equally over the month), corresponding to 6 – 10 minutes of video streaming. The average length of a YouTube was ca. 4.4 minutes. In Western Europe, consumers spend an average of 2.4 hours per day on the internet with their smartphones (having younger children, I am surprised it is not more than that). However, these 2.4 hours are not necessarily network-active in the sense of continuously demanding network resources. In fact, most consumers will be active somewhere between 8:00 to around 22:00, after which network demand reduces sharply. Thus, we have 14 hours of user busy time, and within this time, a Western European consumer would spend 2.4 hours cumulated over the day (or ca. 17% of the active time).
Figure 33 above illustrates (based on actual observed trends) how 5 million mobile users distribute across a mobile network of 5,000 sites (or radio nodes) and 15,000 sectors (typically 3 sectors = 1 site). Typically, user and traffic distributions tend to be log-norm-like with long tails. In the example above, we have in the busy hour a median value of ca. 80 users attached to a sector, with 15 being active (i.e., loading the network) in the busy hour, demanding a maximum of ca. 5 GB (per sector) or an average of ca. 330 MB per active user in the radio sector over that sector’s relevant busy hour.
Typically, 2 limits, with a high degree of inter-dependency, would allegedly hit the cellular businesses rendering profitable growth difficult at some point in the future. The first limit is a practical technology limit on how much capacity a radio access system can supply. As we will see a bit later, this will depend on the operator’s frequency spectrum position (deployed, not what might be on the shelf), the number of sites (site density), the installed antenna technology, and its effective spectral efficiency. The second (inter-dependent) limit is an economic limit. The incremental Capex that telcos would need to commit to sustaining the demand at a given quality level would become highly unprofitable, rendering further cellular business uneconomical.
From a Capex perspective, the cellular access part drives a considerable amount of the mobile investment demand. Together with the supporting transport, such as fronthaul, backhaul, aggregation, and core transport, the capital investment share is typically 50% or higher. This is without including the spectrum frequencies required to offer the cellular service. Such are usually acquired by local frequency spectrum auctions and amount to substantial investment levels.
In the following, the focus will be on cellular access.
The Cellular Demand.
Before discussing the cellular supply side of things, let us first explore the demand side from the view of a helicopter. Demand is created by users (N) of the cellular services offered by telcos. Users can be human or non-human such as things in general or more specific machines. Each user has a particular demand that, in an aggregated way, can be represented by the average demand in Bytes per User (d). Thus, we can then identify two growth drivers. One from adding new users (ΔN) to our cellular network and another from the incremental change in demand per user (ΔN) as time goes by.
It should be noted that the incremental change in demand or users might not per se be a net increase. Still, it could also be a net decrease, either because the cellular networks have reached the maximum possible level of capacity (or quality) that results in users either reducing their demand or “ churning” from those networks or that an alternative to today’s commercial cellular network triggers abandonment as high-demand users migrate to that alternative — leading both to a reduction in cellular users and the average demand per user. For example, a near-100% Fiber-to-the-Home coverage with supporting WiFi could be a reason for users to abandon cellular networks, at least in an indoor environment, which would reduce between 60 to 80% of present-day cellular data demand. This last (hypothetical) is not an issue for today’s cellular networks and telco businesses.
Of course, this can easily be broken down into many more drivers and details, e.g., technology diffusion or adaptation, the rate of users moving from one access technology to another (e.g., 3G→4G, 4G→5G, 5G→FTTH+WiFi), improved network & user device capabilities (better coverage, higher speeds, lower latency, bigger display size, device chip generation), new cellular service adaptation (e.g., TV streaming, VR, AR, …), etc.…
However, what is often forgotten is that the data volume of consumptive demand (in Byte) is not the main direct driver for network demand and, thus, not for the required investment level. A gross volumetric demand can be caused by various gross throughput demands (bits per second). The throughput demanded in the busiest hour ( or ) is the direct driver of network load, and thus, network investments, the volumetric demand, is a manifestation of that throughput demand.
With being the number of active users in a given radio cell at the time-instant of unit t taken within a day. is the Bytes consumed in a time instant (e.g., typically a second); thus, 8 gives us the bits per time unit (or bits/sec), which is throughput consumed. Sum over all the cells’ instant throughput ( bits/sec) in the same instant and take the maximum across. For example, a day provides the busiest hour throughput for the whole network. Each radio cell drives its capacity provision and supply (in bits/sec) and the investments required to provide that demanded capacity in the air interface and front- and back-haul.
For example, if n = 6 active (concurrent) users, each consuming on average = 0.625 Mega Bytes per second (5 Megabits per second, Mbps), the typical requirement for a YouTube stream with an HD 1080p resolution, our radio access network in that cell would experience a demanded load of 30 Mbps (i.e., 6×5 Mbps). Of course, provided that the given cell has sufficient capacity to deliver what is demanded. A 4G cellular system, without any special antenna technology, e.g., Single-in-Single-out (SiSo) classical antenna and not the more modern Multiple-in-Multiple-out (MiMo) antenna, can be expected to deliver ca. 1.5 Mbps/MHz per cell. Thus, we would need at least 20 MHz spectrum to provide for 6 concurrent users, each demanding 5 Mbps. With a simple 2T2R MiMo antenna system, we could support about 8 simultaneous users under the same conditions. A 33% increase in what our system can handle without such an antenna. As mobile operators implement increasingly sophisticated antenna systems (i.e., higher-order MiMo systems) and move to 5G, a leapfrog in the handling capacity and quality will occur.
Figure 34 Is the sky the limit to demand? Ultimately, the limit will come from the practical and economic limits to how much can be supplied at the cellular level (e.g., spectral bandwidth, antenna technology, and software features …). Quality will reduce as the supply limit is reached, resulting in demand adaptation, hopefully settling at a demand-supply (metastable) equilibrium.
Cellular planners have many heuristics to work with that together trigger when a given radio cell would be required to be expanded to provide more capacity, which can be provided by software (licenses), hardware (expansion/replacement), civil works (sectorization/cell splits) and geographical (cell split) means. Going northbound, up from the edge of the radio network up through the transmission chain, such as fronthaul, back, aggregation, and core transport network, may require additional investments in expanding the supplied demand at a given load level.
As discussed, mobile access and transport together can easily make up more than half of a mobile capital budget’s planned and budgeted Capex.
So, to know whether the demand triggers new expansions and thus capital demand as well as the resulting operational expenses (Opex), we really need to look at the supply side. That is what our current mobile network can offer. When it cannot provide a targeted level of quality, how much capacity do we have to add to the network to be on a given level of service quality?
The Cellular Supply.
Cellular capacity in units of throughput () given in bits per second, the basic building block of quality, is relatively easy to estimate. The cellular throughput (per unit cell) is provided by the amount of committed frequency spectrum to the air interface, what your radio access network and antenna support are, multiplied by the so-called spectral efficiency in bits per Hz per cell. The spectral efficiency depends on the antenna technology and the underlying software implementation of signal processing schemes enabling the details of receiving and sending signals over the air interface.
can be written as follows;
With Mbps being megabits (a million bits) per second and MHz being Mega Herz.
For example, if we have a site that covers 3 cells (or sectors) with a deployed 100 MHz @ 3.6GHz (B) on a 32T32R advanced antenna system (AAS) with an effective downlink (i.e., from the antenna to user), spectral efficiency of ca. 20 Mbps/MHz/cell (i.e., ), we should expect to have a cell throughput on average at 1,000 Mbps (1 Gbps).
The capacity supply formula can be applied to the cell-level consideration providing sizing and thus investment guidance as we move northbound up the mobile network and traffic aggregates and concentrates towards the core and connections points to the external internet.
From the demand planning (e.g., number of customers, types of services sold, etc..), that would typically come from the Marketing and Sales department within the telco company, the technical team can translate those plans into a network demand and then calculate what they would need to do to cope with the customer demand within an agreed level of quality.
In Figure 35 above, operators provide cellular capacity by deploying their spectral assets on an appropriate antenna type and system-level radio access network hardware and software. Competition can arise from a superior spectrum position (balanced across low, medium, and high-frequency bands), better or more aggressive antenna technology, and utilizing their radio access supplier(s)’ features (e.g., signal processing schemes). Usually, the least economical option will be densifying the operator’s site grid where needed (on a macro or micro level).
Figure 36 above shows the various options available to the operator to create more capacity and quality. In terms of competitive edge, more spectrum than competitors provided it is being used and is balanced across low, medium, and high bands, provides the surest path to becoming the best network in a given market and is difficult to economically copy by operators with substantially less spectrum. Their options would be compensating for the spectrum deficit by building more sites and deploying more aggressive antenna technologies. The last one is relatively easy to follow by anyone and may only provide some respite temporarily.
An average mobile network in Western Europe has ca. 270 MHz spectrum (60 MHz low-band below 1800 and 210 MHz medium-band below 5 GHz) distributed over an average of 7 cellular frequency bands. It is rare to see all bands deployed in actual deployments and not uniformly across a complete network. The amount of spectrum deployed should match demand density; thus, more spectrum is typically deployed in urban areas than in rural ones. In demand-first-driven strategies, the frequency bands will be deployed based on actual demand that would typically not require all bands to be deployed. This is opposed to MNOs that focus on high quality, where demand is less important, and where typically, most bands would be deployed extensively across their networks. The demand-first-driven strategy tends to be the most economically efficient strategy as long as the resulting cellular quality is market-competitive and customers are sufficiently satisfied.
In terms of downlink spectral capacity, we have an average of 155 MHz or 63 MHz, excluding the C-band contribution. Overall, this allows for a downlink supply of a minimum of 40 GB per hour (assuming low effective spectral efficiency, little advanced antenna technology deployed, and not all medium-band being utilized, e.g., C-Band and 2.5 GHz). Out of the 210 MHz mid-band spectrum, 92 MHz falls in the 3.X GHz (C-band) range and is thus still very much in the process of being deployed for 5G (as of June 2022). The C-band has, on average, increased the spectral capacity of Western European telcos by 50+% and, with its very high suitability for deployment together with massive MiMo and advanced antenna systems, effectively more than doubled the total cellular capacity and quality compared to pre-C-band deployment (using a 64T64R massive MiMo as a reference with today’s effective spectral efficiency … it will be even better as time goes by).
Figure 37 (above) shows the latest Ookla and OpenSignal DL speed benchmarks for Western Europe MNOs (light blue circles), and comparing this with their spectrum holdings below 3.x GHz indicates that there may be a lot of unexploited cellular capacity and quality to be unleashed in the future. Although, it would not be for free and likely require substantial additional Capex if deemed necessary. The ‘Expected DL Mbps’ (orange solid line, *) assumes the simplest antenna setup (e.g., classical SiSo antennas) and that all bands are fully used. On average, MNOs above the benchmark line have more advanced antenna setups (higher-order antennas) and fully (or close to) spectrum deployment. MNOs below the benchmark line likely have spectrum assets that have not been fully deployed yet and (or) “under-prioritized” their antenna technology infrastructure. The DL spectrum holding excludes C- and mmWave spectrum. Note: There was a mistake in the original chart published on LinkedIn as the data was depicted against the total spectrum holding (DL+UL) and not only DL. Data: 54 Western European telcos.
Figure 37 illustrates the Western European cellular performance across MNOs, as measured by DL speed in Mbps, and compares this with the theoretical estimate of the performance they could have if all DL spectrum (not considering C-band, 3.x GHz) in their portfolio had been deployed at a fairly simple antenna setup (mainly SiSo and some 2T2R MiMo) with an effective spectral efficiency of 0.85 Mbps per MHz. It is good to point out that this is expected of 3G HSPA without MiMo. We observe that 21 telcos are above the solid (orange) line, and 33 have an actual average measured performance that is substantially below the line in many cases. Being above the line indicates that most spectrum has been deployed consistently across the network, and more advanced antennas, e.g., higher-order MiMo, are in use. Being below the line does (of course) not mean that networks are badly planned or not appropriately optimized. Not at all. Choices are always made in designing a cellular network. Often dictated by the economic reality of a given operator, geographical demand distribution, clutter particularities, or the modernization cycle an operator may be in. The most obvious reasons for why some networks are operating well under the solid line are; (1) Not all spectrum is being used everywhere (less in rural and more in urban clutter), (2) Rural configurations are simpler and thus provide less performance than urban sites. We have (in general) more traffic demand in urban areas than in rural. Unless a rural area turns seasonally touristic, e.g., lake Balaton in Hungary in the summer … It is simply a good technology planning methodology to prioritize demand in Capex planning, and it makes very good economic sense (3) Many incumbent mobile networks have a fundamental grid based on (GSM) 900MHz and later in-filled for (UMTS) 2100MHz…which typically would have less site density than networks based on (DCS) 1800MHz. However, site density differences between competing networks have been increasingly leveled out and are no longer a big issue in Western Europe (at least).
Overall, I see this as excellent news. For most mobile operators, the spectrum portfolio and the available spectrum bandwidth are not limiting factors in coping with demanded capacity and quality. Operators have many network & technology levers to work with to increase both quality and capacity for their customers. Of course, subject to a willingness to prioritize their Capex accordingly.
A mobile operator has few options to supply cellular capacity and quality demanded by its customer base.
Acquire more spectrum bandwidth by buying in an auction, buying from 3rd party (including M&A), asymmetric sharing, leasing, or trading (if regulatory permissible).
Deploy a better (spectral efficient) radio access technology, e.g., (2G, 3G) → (4G, 5G) or/and 4G → 5G, etc. Benefits will only be seen once a critical mass of customer terminal equipment supporting that new technology has been reached on the network (e.g., ≥20%).
Upgrade antenna technology infrastructure from lower-order passive antennas to higher-order active antenna systems. In the same category would be to ensure that smart, efficient signal processing schemes are being used on the air interface.
Building a denser cellular network where capacity demand dictates or coverage does not support the optimum use of higher frequency bands (e.g., 3.x GHz or higher).
Small cell deployment in areas where macro-cellular built-out is no longer possible or prohibitively costly. Though small cells scale poorly with respect to economics and maybe really the last resort.
Sectorization with higher-frequency massive-MiMo may be an alternative to small-cell and macro-cellular additions. However, sectorization requires that it is possible civil-engineering wise (e.g., construction) re: structural stability, permissible by the landlord/towerco and finally economic compared to a new site built. Adding more than the usual 3-sectors to a site would further boost site spectral efficiency as more antennas are added.
Acquiring more spectrum requires that such spectrum is available either by a regulatory offering (public auction, public beauty contest) or via alternative means such as 3rd party trading, leasing, asymmetric sharing, or by acquiring an MNO (in the market) with spectrum. In Western Europe, the average cost of spectrum is in the ballpark of 100 million Euro per 10 million population per 20 MHz low-band or 100 MHz medium bands. Within the European Union, recent auctions provide a 20-year usage-rights period before the spectrum would have to be re-auctioned. This policy is very different from, for example, in the USA, where spectrum rights are bought and ownership secured in perpetuity (sometimes conditioned on certain conditions being met). For Western Europe, apart from the mmWave spectrum, in the foreseeable future, there will not be many new spectrum acquisition opportunities in the public domain.
This leaves mobile operators with other options listed above. Re-farming spectrum away from legacy technology (e.g., 2G or 3G) in support of another more spectral efficient access technology (e.g., 4G and 5G) is possibly the most straightforward choice. In general, it is the least costly choice provided that more modern options can support the very few customers left. For either retiring 2G or 3G, operators need to be aware that as long as not all terminal equipment support Voice-over-LTE (VoLTE), they need to keep either 2G or 3G (but not both) for 4G circuit-switched fallback (to 2G or 3G) for legacy voice services. The technologist should be prepared for substantial pushback from the retail and wholesale business, as closing down a legacy technology may lead to significant churn in that legacy customer base. Although, in absolute terms, the churn exposure should be much smaller than the overall customer base. Otherwise, it will not make sense to retire the legacy technology in the first place. Suppose the spectral re-farming is towards a new technology (e.g., 5G). In that case, immediate benefits may not occur before a critical mass of capable devices is making use of the re-farmed spectrum. The Capex impact of spectral re-farming tends to be minor, with possibly some licensing costs associated with net savings from retiring the legacy. Most radio departments within mobile operators, supplier experts, and managed service providers have gained much experience in this area over the last 5 – 7 years.
Another venue that should be taken is upgrading or modernizing the radio access network with more capable antenna infrastructure, such as higher-order massive MiMo antenna systems. As has been pointed out by Prof. Emil Björnson also, the available signal processing schemes (e.g., for channel estimation, pre-coding, and combining) will be essential for the ultimate gain that can be achieved. This will result in a leapfrog increase in spectral efficiency. Thus, directly boosting air-interface capacity and the quality that the mobile customer can enjoy. If we take a 20-year period, this activity is likely to result in a capital demand in the order of 100 million euros for every 1,000 sites being modernized and assumes a modernization (or obsolescence) cycle of 7 years. In other words, within the next 20 years, a mobile operator will have undergone at least 3 antenna-system modernization cycles. It is important to emphasize that this does not (entirely) cover the likely introduction of 6G during the 20 years. Operators face two main risks in their investment strategy. One risk is that they take a short-term look at their capital investments and customer demand projections. As a result, they may invest in insufficient infrastructure solutions to meet future demands, forcing accelerated write-offs and re-investments. The second significant risk is that the operator invests too aggressively upfront in what appears to be the best solution today to find substantially better and more efficient solutions in the near future that more cautious competitive operators could deploy and achieve a substantially higher quality and investment efficiency. Given the lack of technology maturity and the very high pace of innovation in advanced antenna systems, the right timing is crucial but not straightforward.
Last and maybe least, the operator can choose to densify its cellular grid by adding one or more macro-cellular sites or adding small cells across existing macro-cellular coverage. Before it is possible to build a new site or site, the operator or the serving towerco would need to identify suitable locations and subsequently obtain a permit to establish the new site or site. In urban areas, which typically have the highest macro-site densities, getting a new permit may be very time-consuming and with a relatively high likelihood of not being granted by the municipality. Small cells may be easier to deploy in urban environments than in macro sites. For operators making use of towerco to provide the passive site infrastructure, the cost of permitting and building the site and materials (e.g., steel and concrete) is a recurring operational expense rather than a Capex charge. Of course, active equipment remains a Capex item for the relevant mobile operator.
The conclusion I make above is largely consistent with the conclusions made by New Street Research in their piece “European 5G deep-dive” (July 2021). There is plenty of unexploited spectrum with the European operators and even more opportunity to migrate to more capable antenna systems, such as massive-MiMo and active advanced antenna systems. There are also above 3GHz, other spectrum opportunities without having to think about millimeter Wave spectrum and 5G deployment in the high-frequency spectrum range.
ACKNOWLEDGEMENT.
I greatly acknowledge my wife Eva Varadi, for her support, patience, and understanding during the creative process of writing this Blog. There should be no doubt that without the support of Russell Waller (New Street Research), this blog would not have been possible. Thank you so much for providing much of the data that lays the ground for much of the Capex analysis in this article. Of course, a lot of thanks go out to my former Technology and Network Economics colleagues, who have been a source of inspiration and knowledge. I cannot get away with acknowledging Maurice Ketel (who for many years let my Technology Economics Unit in Deutsche Telekom, I respect him above and beyond), Paul Borker, David Haszeldine, Remek Prokopiak, Michael Dueser, Gudrun Bobzin, as well as many, many other industry colleagues who have contributed with valuable insights, discussions & comments throughout the years. Many thanks to Paul Zwaan for a lot of inspiration, insights, and discussions around IT Architecture.
Without executive leadership’s belief in the importance of high-quality techno-financial models, I have no doubt that I would not have been able to build up the experience I have in this field. I am forever thankful, for the trust and for making my professional life super interesting and not just a little fun, to Mads Rasmussen, Bruno Jacobfeuerborn, Hamid Akhavan, Jim Burke, Joachim Horn, and last but certainly not least, Thorsten Langheim.
FURTHER READING.
Kim Kyllesbech Larsen, “The Nature of Telecom Capex.” (July, 2022). My first article laying the ground for Capex in the Telecom industry. The data presented in this article is largely outdated and remains for comparative reasons.
Tom Copeland, Tim Koller, and Jack Murrin, “Valuation”, John Wiley & Sons, (2000). I regard this as my “bible” when it comes to understanding enterprise valuation. There are obviously many finance books on valuation (I have 10 on my bookshelf). Copeland’s book is the best imo.
Stefan Rommer, Peter Hedman, Magnus Olsson, Lars Frid, Shabnam Sultana, and Catherine Mulligan, “5G Core Networks”, Academic Press, (2020, 1st edition). Good account for what a 5G Core Network entails.
Jia Shen, Zhongda Du, Zhi Zhang, Ning Yang and Hai Tang, “5G NR and enhancements”, Elsevier (2022, 1st edition). Very good and solid account of what 5G New Radio (NR) is about and the considerations around it.
Wim Rouwet, “Open Radio Access Network (O-RAN) Systems Architecture and Design”, Academic Press, (2022). One of the best books on Open Radio Access Network architecture and design (honestly, there are not that many books on this topic yet). I like that the author, at least as an introduction makes the material reasonably accessible to even non-experts (which tbh is also badly needed).
Strand Consult, “OpenRAN and Security: A Literature Review”, (June, 2022). Excellent insights into the O-RAN maturity challenges. This report focuses on the many issues around open source software-based development that is a major part of O-RAN and some deep concerns around what that may mean for security if what should be regarded as critical infrastructure. I warmly recommend their “Debunking 25 Myths of OpenRAN”.
Hwaiyu Geng P.E., “Data Center Handbook”, Wiley (2021, 2nd edition). I have several older books on the topic that I have used for my models. This one brings the topic of data center design up to date. Also includes the topic of Cloud and Edge computing. Good part on Data Center financial analysis.
James Farmer, Brian Lane, Kevin Bourgm Weyl Wang, “FTTx Networks, Technology Implementation, and Operations”, Elsevier, (2017, 1st edition). It has some books covering FTTx deployment, GPON, and other alternative fiber technologies. I like this one in particular as it covers hands-on topics as well as basic technology foundations.
New Street Research, “European 5G deep-dive”, (July, 2021).
Prof. Emil Björnson, https://ebjornson.com/research/ and references therein. Please take a look at many of Prof. Björnson video presentations (e.g., many brilliant YouTube presentations that are fairly assessable).
Full disclosure … when I was first introduced to the concept of Network Slicing, from one of the 5G fathers that I respect immensely (Rachid, it must have been back at the end of 2014), I thought that it was one of the most useless concepts that I had heard of. I did simply not see (or get) the point of introducing this level of complexity. It did not feel right. My thoughts were that taking the slicing concept to the limit might actually not make any difference to not having it, except for a tremendous amount of orchestration and management overhead (and, of course, besides the technological fun of developing it and getting it to work).
It felt a bit (a lot, actually) as a “let’s do it because we can” thinking. With the “We can” rationale based on the maturity of cloudification and softwarization frameworks, such as cloud-native, public-cloud scale, cloud computing (e.g., edge), software-defined networks (SDN), network-function virtualization (NFV), and the-one-that-is-always-named Artificial Intelligence (AI). I believed there could be other ways to offer the same variety of service experiences without this additional (what I perceived as an unnecessary) complexity. At the time, I had reservations about its impact on network planning, operations, and network efficiency. Not at all sure, it would be a development in the right economic direction.
Since then, I have softened to the concept of Network Slicing. Not (of course) that I have much choice, as slicing is an integral part of 5G standalone (5G) implementation that will be implemented and launched over the next couple of years across our industry. Who knows, I may very likely be proven very wrong, and then I learn something.
What is a network slice? We can see a network slice as an on-user-demand logical separated network partitioning, software-defined on-top of our common physical network infrastructure (wam … what a mouthful … test me out on this one next time you see me), slicing through our network technology stack and its layers. Thinking of a virtual private network (VPN) tunnel through a transport network is a reasonably good analogy. The network slice’s logical partitioning is isolated from other traffic streams (and slices) flowing through the 5G network. Apart from the slice logical isolation, it can have many different customizations, e.g., throughput, latency, scale, Quality of Service, availability, redundancy, security, etc… The user equipment initiates the slice request from a list of pre-defined slice categories. Assuming the network is capable of supporting its requirements, the chosen slice category is then created, orchestrated, and managed through the underlying physical infrastructure that makes up the network stack. The pre-defined slice categories are designed to match what our industry believe is the most essential use-cases, e.g., (a) enhanced mobile broadband use cases (eMBB), (b) ultra-reliable low-latency communications (uRLLC) use cases, (c) massive machine-type communication (MMTC) use cases, (d) Vehicular-to-anything (V2X) use-cases, etc… While the initial (early day) applications of network slicing are expected to be fairly static and configurationally relatively simple, infrastructure suppliers (e.g., Ericsson, Huawei, Nokia, …)expect network slices to become increasingly dynamic and rich in their configuration possibilities. While slicing is typically evoked for B2B and B2B2X, there is not really a reason why consumers could not benefit from network slicing as well (e.g., gaming/VR/AR, consumer smart homes, consumer vehicular applications, etc..).
Show me the money!
Ericsson and Arthur D. Little (ADL) have recently investigated the network slicing opportunities for communications service providers (CSP). Ericsson and ADL have analyzed more than 70 external market reports on the global digitalization of industries and critically reviewed more than 400 5G / digital use cases (see references in Further Readings below). They conclude that the demand from digitalization cannot be served by CSPs without Network Slicing, e.g., “Current network resources cannot match the increasing diversity of demands over time” and “Use cases will not function” (in a conventional mobile network). Thus, according to Ericsson and ADL, the industry can not “live” without Network Slicing (I guess it is good that it comes with 5G SA then). In fact, from their study, they conclude that 30% of the 5G use cases explored would require network slicing (oh joy and good luck that it will be in our networks soon).
Ericsson and ADL find globally a network slicing business potential of 200 Billion US dollars by 2030 for CSPs. With a robust CAGR (i.e., the potential will keep growing) between 23% to 36% by 2030 (i.e., CAGR estimate for period 2025 to 2030). They find that 6 Industries segments take 90+% of the slicing potential; (1) Healthcare (23%), (2) Government (17%), (3) Transportation (15%), (4) Energy & Utilities (14%), (5) Manufacturing (12%) and (6) Media & Entertainment (11%). For the keen observer, we see that the verticals are making up for most of the slicing opportunities, with only a relatively small part being related to the consumers. It should, of course, be noted that not all CSPs are necessarily also mobile network operators (MNOs), and there are also outside the strict domain of MNOs revenue potential for non-MNO CSPs (I assume).
Let us compare this slicing opportunity to global mobile industry revenue projections from 2020 to 2030. GSMA has issued a forecast for mobile revenues until 2025, expecting a total turnover of 1,140 Billion US$ in 2025 at a CAGR (2020 – 2025) of 1.26%. Assuming this compounded annual growth rate would continue to apply, we would expect a global mobile industry revenue of 1,213 Bn US$ by 2030. Our 5G deployments will contribute in the order of 621 Bn US$ (or 51% of the total). The incremental total mobile revenue between 2020 and 2030 would be ca. 140 Bn US$ (i.e., 13% over period). If we say that roughly 20% is attributed to mobile B2B business globally, we have that by 2030 we would expect a B2B turnover of 240+ Bn US$ (an increase of ca. 30 Bn US$ over 2020). So, Ericsson & ADL’s 200 Bn US$ network slicing potential is then ca. 16% of the total 2030 global mobile industry turnover or 30+% of the 5G 2030 turnover. Of course, this assumes that somehow the slicing business potential is simply embedded in the existing mobile turnover or attributed to non-MNO CSPs (monetizing the capabilities of the MNO 5G SA slicing enablers).
Of course, the Ericsson-ADL potential could also be an actual new revenue stream untapped by today’s network infrastructures due to the lack of slicing capabilities that 5G SA will bring in the following years. If so, we can look forward to a boost of the total turnover of 16% over the GSMA-based 2030 projection. Given ca. 90% of the slicing potential is related to B2B business, it may imply that B2B mobile business would almost double due to network slicing opportunities (hmmm).
Another recent study assessed that the global 5G network slicing market will reach approximately 18 Bn US$ by 2030 with a CAGR of ca. 41% over 2020-2030.
Irrespective of the slicing turnover quantum, it is unlikely that the new capabilities of 5G SA (including network slicing and much richer granular quality of service framework) will lead to new business opportunities and enable unexplored use cases. That, in turn, may indeed lead to enhanced monetization opportunities and new revenue streams between now (2022) and 2030 for our industry.
Most Western European markets will see 5G SA being launched over the next 2 to 3 years; as 5G penetration rapidly approaches 50% penetration, I expect network slicing use cases being to be tried out with CSP/MNOs, industry partners, and governmental institutions soon after 5G SA has been launched. It should be pointed out that already for some years, slicing concepts have been trialed out in various settings. Both in 4G as well as 5G NSA networks.
Prologue to Network Slicing.
5G comes with a lot of fundamental capabilities as shown in the picture below,
5G allows for (1) enhanced mobile broadband, (2) very low latency, (3) massive increase in device density handling, i.e., massive device scale-up, (4) ultra-higher network reliability and service availability, and (5) enhanced security (not shown in the above diagram) compared to previous Gs.
The service (and thus network) requirement combinations are very high. The illustration below shows two examples of mapped-out sub-set of service (and therefore also eventually slice) requirements mapped onto the major 5G capabilities. In addition, it is quite likely that businesses would have additional requirements related to slicing performance monitoring, for example, in real-time across the network stack.
and with all the various industrial or vertical use cases (see below) one could imagine (noting that there may be many many more outside our imagination), the “fathers” of 5G became (very) concerned with how such business-critical services could be orchestrated and managed within a traditional mobile network architecture as well as across various public land mobile networks (PLMN). Much of this also comes out of the wish that 5G should “conquer” (take a slice of) next-generation industries (i.e., Industry 4.0), providing additional value above and beyond “the dumb bit pipe.” Moreover, I do believe that in parallel with the wish of becoming much more relevant to Industry 4.0 (and the next generation of verticals requirements), what also played a role in the conception of network slicing is the deeply rooted engineering concept of “control being better than trust” and that “centralized control is better than decentralized” (I lost count on this debate of centralized control vs. distributed management a long time ago).
So, yes … The 5G world is about to get a lot more complex in terms of Industrial use cases that 5G should support. And yes, our consumers will expect much higher download speeds, real-time (whatever that will mean) gaming capabilities, and “autonomous” driving …
“… it’s clear that the one shared public network cannot meet the needs of emerging and advanced mobile connectivity use cases, which have a diverse array of technical operations and security requirements.” (quote from Ericsson and Arthur D. Little study, 2021).
“The diversity of requirements will only grow more disparate between use cases — the one-size-fits-all approach to wireless connectivity will no longer suffice.” (quote from Ericsson and Arthur D. Little study, 2021).
Being a naturalist (yes, I like “naked” networks), it does seem somewhat odd (to me) to say that next generation (e.g., 5G) networks cannot support all the industrious use cases that we may throw at it in its native form. Particular after having invested billions in such networks. By partitioning a network up in limiting (logically isolated), slice instances can all be supported (allegedly). I am still in the thinking phase on that one (but I don’t think the math adds up).
Now, whether one agrees (entirely) with the economic sentiment expressed by Ericsson and ADL or not. We need a richer granular way of orchestrating and managing all those diverse use-cases we expect our 5G network to support.
Network Slicing.
So, we have (or will get) network slicing with our 5G SA Core deployment. As a reminder, when we talk about a network slice, we mean;
“An on-user-demandlogicalseparated network partitioning, software-defined, on-top of a common physical network infrastructure.”
So, the customer requested the network slice, typically via a predefined menu of slicing categories that may also have been pre-validated by the relevant network. Requested slices can also be Customized,by the requester, within the underlying 5G infrastructure capabilities and functionalities. If the network can provide the requested slicing requirements, the slice is (in theory) granted. The core network then orchestrates a logically separated network partitioning throughout the relevant infrastructure resources to comply with the requested requirements (e.g., speed, latency, device scale, coverage, security, etc…). The requested partitioning (i.e., the slice) is isolated from other slices to enable (at least on a logical level) independence of other live slices. Slice Isolation is an essential concept to network slicing. Slice Elasticity ensures that resources can be scaled up and down to ensure individual slice efficiency and an overall efficient operation of all operating slices. It is possible to have a single individual network slice or partition a slice into sub-slices with their individual requirements (that does not breach the overarching slice requirements). GSMA has issued roaming and inter-PLMN guidelines to ensure 5G network slicing inter-operability when a customer’s application finds itself outside its home -PLMN.
Today, and thanks to GSMA and ITU, there are some standard network slice services pre-defined, such as (a) eMBB – Enhanced Mobile Broadband, (b) mMTC – Massive machine-type communications, (c) URLLC – Ultra-reliable low-latency communications, (d) V2X – Vehicular-to-anything communications. These identified standard network slices are called Slice Service Types (SST). SSTs are not only limited to above mentioned 4 pre-defined slice service types. The SSTs are matched to what is called a Generic Slice Template (GST) that currently, we have 37 slicing attributes, allowing for quite a big span of combinations of requirements to be specified and validated against network capabilities and functionalities (maybe there is room for some AI/ML guidance here).
The user-requested network slice that has been set up end-2-end across the network stack, between the 5G Core and the user equipment, is called the network slice instance. The whole slice setup procedure is very well described in Chapter 12 of “5G NR and enhancements, from R15 to R16. The below illustration provides a high-level illustration of various network slices,
The 5G control function Access and Mobility management Function (AMF) is the focal point for the network slicing instances. This particular architectural choice does allow for other slicing control possibilities with a higher or lower degree of core network functionality sharing between slice instances. Again the technical details are explained well in some of the reading resources provided below. The takeaway from the above illustration is that the slice instance specifications are defined for each layer and respective physical infrastructure (e.g., routers, switches, gateways, transport device in general, etc…) of the network stack (e.g., Telco Core Cloud, Backbone, Edge Cloud, Fronthaul, New Radio, and its respective air-interface). Each telco stack layer that is part of a given network slice instance is supposed to adhere strictly to the slice requirements, enabling an End-2-End, from Core to New Radio through to the user equipment, slice of a given quality (e.g., speed, latency, jitter, security, availability, etc..).
And it may be good to keep in mind that although complex industrial use cases get a lot of attention, voice and mobile broadband could easily be set up with their own slice instances and respective quality-of-services.
Network slicing examples.
All the technical network slicing “stuff” is pretty much-taken care of by standardization and provided by the 5G infrastructure solution providers (e.g., Mavenir, Huawei, Ericsson, Nokia, etc..). Figuring the technical details of how these works require an engineering or technical background and a lot of reading.
As I see it, the challenge will be in figuring out, given a use-case, the slicing requirements and whether a single slice instance suffice or multiple are required to provide the appropriate operations and fulfillment. This, I expect, will be a challenge for both the mobile network operator as well as the business partner with the use case. This assumes that the economics will come out right for more complex (e.g., dynamic) and granular slice-instance use cases. For the operator as well as for businesses and public institutions.
The illustration below provides examples of a few (out of the 37) slicing attributes for different use cases, (a) Factories with time-critical, non-time-critical, and connected goods sub-use cases (e.g., sub-slice instances, QoS differentiated), (b) Automotive with autonomous, assisted and shared view sub-use cases, (c) Health use cases, and (d) Energy use cases.
One case that I have been studying is Networked Robotics use cases for the industrial segment. Think here about ad-hoc robotic swarms (for agricultural or security use cases) or industrial production or logistics sorting lines; below are some reflections around that.
End thoughts.
With the emergence of the 5G Core, we will also get the possibility to apply Network slicing to many diverse use cases. That there are interesting business opportunities with network slicing, I think, is clear. Whether it will add 16% to the global mobile topline by 2030, I don’t know and maybe also somewhat skeptical about (but hey, if it does … fantastic).
Today, the type of business opportunities that network slicing brings in the vertical segments is not a very big part of a mobile operator’s core competence. Mobile operators with 5G network slicing capabilities ultimately will need to build up such competence or (and!) team up with companies that have it.
That is, if the future use cases of network slicing, as envisioned by many suppliers, ultimately will get off the ground economically as well as operationally. I remain concerned that network slicing will not make operators’ operations less complex and thus will add cost (and possible failures) to their balance sheets. The “funny” thing (IMO) is that when our 5G networks are relatively unloaded, we would not have a problem delivering the use cases (obviously). Once our 5G networks are loaded, network slicing may not be the right remedy to manage traffic pressure situations or would make the quality we are providing to consumers progressively worse (and I am not sure that business and value-wise, this is a great thing to do). Of course, 6G may solve all those concerns 😉
Acknowledgement.
I greatly acknowledge my wife, Eva Varadi, for her support, patience, and understanding during the creative process of writing this Blog. Also, many of my Deutsche Telekom AG and Industry colleagues, in general, have in countless ways contributed to my thinking and ideas leading to this little Blog. Thank you!
Jia Shen, Zhongda Du, & Zhi Zhang, “5G NR and enhancements, from R15 to R16”, Elsevier Science, (2021). Provides a really good overview of what to expect from 5G standalone. Chapter 12 provides a good explanation of (and in detail account for) how 5G Network Slicing works in detail. Definitely one of my favorite books on 5G, it is not “just” an ANRA.
Claudia Campolo, Antonella Molinaro, Antonio Lera, and Francesco Menichella, “5G Network Slicing for Vehicle-to-Everything Services”, IEEE Wireless Communications 24, (December 2017). Great account of how network slicing should work for V2X services.
GSMA, “Securing the 5G Era” (2021). A good overview of security principles in 5G and how previous vulnerabilities in previous cellular generations are being addressed in 5G. This includes some explanation on why slicing further enhances security.
By the end of 2020, according with Ericsson, it was estimated that there where ca. 7.6 million 5G subscriptions in Western Europe (~ 1%). Compare this to North America’s ca. 14 million (~4%) and 190 million (~11%) North East Asia (e.g, China, South Korea, Japan, …).
Maybe Western Europe is not doing that great, when it comes to 5G penetration, in comparison with other big regional markets around the world. To some extend the reason may be that 4G network’s across most of Western Europe are performing very well and to an extend more than servicing consumers demand. For example, in The Netherlands, consumers on T-Mobile’s 4G gets, on average, a download speed of 100+ Mbps. About 5× the speed you on average would get in USA with 4G.
From the October 2021 statistics of the Global mobile Suppliers Association (GSA), 180 operators worldwide (across 72 countries) have already launched 5G. With 37% of those operators actively marketing 5G-based Fixed Wireless Access (FWA) to consumers and businesses. There are two main 5G deployment flavors; (a) non-standalone (NSA) deployment piggybacking on top of 4G. This is currently the most common deployment model, and (b) as standalone (SA) deployment, independently from legacy 4G. The 5G SA deployment model is to be expected to become the most common over the next couple of years. As of October 2021, 15 operators have launched 5G SA. It should be noted that, operators with 5G SA launched are also likely to support 5G in NSA mode as well, to provide 5G to all customers with a 5G capable handset (e.g., at the moment only 58% of commercial 5G devices supports 5G SA). Only reason for not supporting both NSA and SA would be for a greenfield operator or that the operator don’t have any 4G network (none of that type comes to my mind tbh). Another 25 operators globally are expected to be near launching standalone 5G.
It should be evident, also from the illustration below, that mobile customers globally got or will get a lot of additional download speed with the introduction of 5G. As operators introduce 5G, in their mobile networks, they will leapfrog their available capacity, speed and quality for their customers. For Europe in 2021 you would, with 5G, get an average downlink (DL) speed of 154 ± 90 Mbps compared to 2019 4G DL speed of 26 ± 8 Mbps. Thus, with 5G, in Europe, we have gained a whooping 6× in DL speed transitioning from 4G to 5G. In Asia Pacific, the quality gain is even more impressive with a 10× in DL speed and somewhat less in North America with 4× in DL speed. In general, for 5G speeds exceeding 200 Mbps on average may imply that operators have deployed 5G in the C-band band (e.g., with the C-band covering 3.3 to 5.0 GHz).
The above DL speed benchmark (by Opensignal) gives a good teaser for what to come and to expect from 5G download speed, once a 5G network is near you. There is of course much more to 5G than downlink (and uplink) speed. Some caution should be taken in the above comparison between 4G (2019) and 5G (2021) speed measurements. There are still a fair amount of networks around the world without 5G or only started upgrading their networks to 5G. I would expect the 5G average speed to reduce a bit and the speed variance to narrow as well (i.e., performance becoming more consistent).
In a previous blog I describe what to realistically expect from 5G and criticized some of the visionary aspects of the the original 5G white paper paper published back in February 2015. Of course, the tech-world doesn’t stand still and since the original 5G visionary paper by El Hattachi and Erfanian. 5G has become a lot more tangible as operators deploy it or is near deployment. More and more operators have launched 5G on-top of their 4G networks and in the configuration we define as non-standalone (i.e., 5G NSA). Within the next couple of years, coinciding with the access to higher frequencies (>2.1 GHz) with substantial (unused or underutilized) spectrum bandwidths of 50+ MHz, 5G standalone (SA) will be launched. Already today many high-end handsets support 5G SA ensuring a leapfrog in customer experience above and beyond shear mobile broadband speeds.
The below chart illustrates what to expect from 5G SA, what we already have in the “pocket” with 5G NSA, and how that may compare to existing 4G network capabilities.
There cannot be much doubt that with the introduction of the 5G Core (5GC) enabling 5G SA, we will enrich our capability and service-enabler landscape. Whether all of this cool new-ish “stuff” we get with 5G SA will make much top-line sense for operators and convenience for consumers at large is a different story for a near-future blog (so stay tuned). Also, there should not be too much doubt that 5G NSA already provide most of what the majority of our consumers are looking for (more speed).
Overall, 5G SA brings benefits, above and beyond NSA, on (a) round-trip delay (latency) which will be substantially lower in SA, as 5G does not piggyback on the slower 4G, enabling the low latency in ultra-reliable low latency communications (uRLLC), (b) a factor of 250× improvement device density (1 Million devices per km2) that can be handled supporting massive machine type communication scenarios (mMTC), (c) supports communications services at higher vehicular speeds, (d) in theory should result in low device power consumption than 5G NSA, and (e) enables new and possible less costly ways to achieve higher network (and connection) availability (e.g., with uRLLC).
Compared to 4G, 5G SA brings with it a more flexible, scalable and richer set of quality of service enablers. A 5G user equipment (UE) can have up to 1,024 so called QoS flows versus a 4G UE that can support up to 8 QoS classes (tied into the evolved packet core bearer). The advantage of moving to 5G SA is a significant reduction of QoS driven signaling load and management processing overhead, in comparison to what is the case in a 4G network. In 4G, it has been clear that the QoS enablers did not really match the requirements of many present day applications (i.e., brutal truth maybe is that the 4G QoS was outdated before it went live). This changes with the introduction of 5G SA.
So, when is it a good idea to implement 5G Standalone for mobile operators?
There are maybe three main events that should trigger operators to prepare for and launch 5G SA;
Economical demand for what 5G SA offers.
Critical mass of 5G consumers.
Want to claim being the first to offer 5G SA.
with the 3rd point being the least serious but certainly not an unlikely factor in deploying 5G SA. Apart from potentially enriching consumers experience, there are several operational advantages of transitioning to a 5GC, such as more mature IT-like cloudification of our telecommunications networks (i.e., going telco-cloud native) leading to (if designed properly) a higher degree of automation and autonomous network operations. Further, it may also allow the braver parts of telco-land to move a larger part of its network infrastructure capabilities into the public-cloud domain operated by hyperscalers or network-cloud consortia’s (if such entities will appear). Another element of the 5G SA cloud nativification (a new word?) that is frequently not well considered, is that it will allow operators to start out (very) small and scale up as business and consumer demand increases. I would expect that particular with hyperscalers and of course the-not-so-unusual-telco-supplier-suspects (e.g., Ericsson, Nokia, Huawei, Samsung, etc…), operators could launch fairly economical minimum viable products based on a minimum set of 5G SA capabilities sufficient to provide new and cost-efficient services. This will allow early entry for business-to-business new types of QoS and (or) slice-based services based on our new 5G SA capabilities.
Western Europe mobile market expectations – 5G technology share.
By end of 2021, it is expected that Western Europe would have in the order of 36 Million 5G connections, around a 5% 5G penetration. Increasing to 80 Million (11%) by end of 2022. By 2024 to 2025, it is expected that 50% of all mobile connections would be 5G based. As of October 2021 ca. 58% of commercial available mobile devices supports already 5G SA. This SA share is anticipated to grow rapidly over the next couple of years making 5G NSA increasingly unimportant.
Approaching 50% of all connections being 5G appears a very good time to aim having 5G standalone implemented and launched for operators. Also as this may coincide with substantial efforts to re-farming existing frequency spectrum from 4G to 5G as 5G data traffic exceeds that of 4G.
For Western Europe 2021, ca. 18% of the total mobile connections are business related. This number is expected to steadily increase to about 22% by 2030. With the introduction of new 5G SA capabilities, as briefly summarized above, it is to be expected that the 5G business connection share quickly will increase to the current level and that business would be able to directly monetize uRLLC, mMTC and the underlying QoS and network slicing enablers. For consumers 5G SA will bring some additional benefits but maybe less obvious new monetization possibilities, beyond the proportion of consumers caring about latency (e.g., gamers). Though, it appears likely that the new capabilities could bring operators efficiency opportunities leading to improved margin earned on consumers (for another article).
Recommendation:
Learn as much as possible from recent IT cloudification journeys (e.g., from monolithic to cloud, understand pros and cons with lift-and-shift strategies and the intricacies of operating cloud-native environments in public cloud domains).
Aim to have 5GC available for 5G SA launch latest by 2024.
Run 5GC minimum viable product poc’s with friendly (business) users prior to bigger launch.
As 5G is launched on C-band / 3.x GHz it may likewise be a good point in time to have 5G SA available. At least for B2B customers that may benefit from uRLLC, lower latency in general, mMTC, a much richer set of QoS, network slicing, etc…
Having a solid 4G to 5G spectrum re-farming strategy ready between now and 2024 (too late imo). This should map out 4G+NSA and SA supply dynamics as increasingly customers get 5G SA capabilities in their devices.
Western Europe mobile market expectations – traffic growth.
With the growth of 5G connections and the expectation that 5G would further boost the mobile data consumption, it is expected that by 2023 – 2024, 50% of all mobile data traffic in Western Europe would be attributed to 5G. This is particular driven by increased rollout of 3.x GHz across the Western European footprint and associated massive MiMo (mMiMo) antenna deployments with 32×32 seems to be the telco-lands choice. In blended mobile data consumption a CAGR of around 34% is expected between 2020 and 2030, with 2030 having about 26× more mobile data traffic than that of 2020. Though, I suspect that in Western Europe, aggressive fiberization of telecommunications consumer and business markets, over the same period, may ultimately slow the growth (and demand) on mobile networks.
A typical Western European operator would have between 80 – 100+ MHz of bandwidth available for 4G its downlink services. The bandwidth variation being determined by how much is required of residual 3G and 2G services and whether the operator have acquired 1500MHz SDL (supplementary downlink) spectrum. With an average 4G antenna configuration of 4×4 MiMo and effective spectral efficiency of 2.25 Mbps/MHz/sector one would expect an average 4G downlink speed of 300+ Mbps per sector (@ 90 MHz committed to 4G). For 5G SA scenario with 100 MHz of 3.x GHz and 2×10 MHz @ 700 MHz, we should expect an average downlink speed of 500+ Mbps per sector for a 32×32 massive MiMo deployment at same effective spectral efficiency as 4G. In this example, although naïve, quality of coverage is ignored. With 5G, we more than double the available throughput and capacity available to the operator. So the question is whether we remain naïve and don’t care too much about the coverage aspects of 3.x GHz, as beam-forming will save the day and all will remain cheesy for our customers (if something sounds too good to be true, it rarely is true).
In an urban environment it is anticipated that with beam-forming available in our mMiMo antenna solutions downlink coverage will be reasonably fine (i.e., on average) with 3.x GHz antennas over-layed on operators existing macro-cellular footprint with minor densification required (initially). In the situation that 3.x GHz uplink cannot reach the on-macro-site antenna, the uplink can be closed by 5G @ 700 MHz, or other lower cellular frequencies available to the operator and assigned to 5G (if in standalone mode). Some concerns have been expressed in literature that present advanced higher order antenna’s (e.g., 16×16 and above ) will on average provide a poorer average coverage quality over a macro cellular area than what consumers would be used to with lower order antennas (e.g., 4×4 or lower) and that the only practical (at least with today’s state of antennas) solution would be sectorization to make up for beam forming shortfalls. In rural and sub-urban areas advanced antennas would be more suitable although the demand would be a lot less than in a busy urban environment. Of course closing the 3.x GHz with existing rural macro-cellular footprint may be a bigger challenge than in an urban clutter. Thus, massive MiMo deployments in rural areas may be much less economical and business case friendly to deploy. As more and more operators deploy 3.x GHz higher-order mMiMo more field experience will become available. So stay tuned to this topic. Although I would reserve a lot more CapEx in my near-future budget plans for substantial more sectorization in urban clutter than what I am sure is currently in most operators plans. Maybe in rural and suburban areas the need for sectorizations would be much smaller but then densification may be needed in order to provide a decent 3.x GHz coverage in general.
Western Europe mobile market expectations – 5G RAN Capex.
That brings us to another important aspect of 5G deployment, the Radio Access Network (RAN) capital expenditures (CapEx). Using my own high-level (EU-based) forecast model based on technology deployment scenario per Western European country that in general considers 1 – 3% growth in new sites per anno until 2024, then from 2025 onwards, I assuming 2 – 5% growth due to densifications needs of 5G, driven by traffic growth and before mentioned coverage limitations of 3.x GHz. Exact timing and growth percentages depends on initial 5G commercial launch, timing of 3.x GHz deployment, traffic density (per site), and site density considering a country’s surface area.
According with Statista, Western Europe had in 2018 a cellular site base of 421 thousands. Further, Statista expected this base will grow with 2% per anno in the years after 2018. This gives an estimated number of cellular sites of 438k in 2020 that has been assumed as a starting point for 2020. The model estimates that by 2030, over the next 10 years, an additional 185k (+42%) sites will have been built in Western Europe to support 5G demand. 65% (120+k) of the site growth, over the next 10 years, will be in Germany, France, Italy, Spain and UK. All countries with relative larger geographical areas that are underserved with mobile broadband services today. Countries with incumbent mobile networks, originally based on 900 MHz GSM grids (of course densified since the good old GSM days), and thus having coarser cellular grids with higher degree of mismatching the higher 5G cellular frequencies (i.e., ≥ 2.5 GHz). In the model, I have not accounted for an increased demand of sectorizations to keep coverage quality upon higher order mMiMO deployments. This, may introduce some uncertainty in the Capex assessment. However, I anticipate that sectorization uncertainty may be covered in the accelerated site demand the last 5 years of the period.
In the illustration above, the RAN capital investment assumes all sites will eventually be fiberized by 2025. That may however be an optimistic assumption and for some countries, even in Western Europe, unrealistic and possibly highly uneconomical. New sites, in my model, are always fiberized (again possibly too optimistic). Miscellaneous (Misc.) accounts for any investments needed to support the RAN and Fiber investments (e.g., Core, Transport, Cap. Labor, etc..).
In the economical estimation price erosion has been taken into account. This erosion is a blended figure accounting for annual price reduction on equipment and increases in labor cost. I am assuming a 5-year replacement cycle with an associated 10% average price increase every 5 years (on the previous year’s eroded unit price). This accounts for higher capability equipment being deployed to support the increased traffic and service demand. The economical justification for the increase unit price being that otherwise even more new sites would be required than assumed in this model. In my RAN CapEx projection model, I am assuming rational deployment, that is demand driven deployment. Thus, operators investments are primarily demand driven, e.g., only deploying infrastructure required within a given financial recovery period (e.g., depreciation period). Thus, if an operator’s demand model indicate that it will need a given antenna configuration within the financial recovery period, it deploys that. Not a smaller configuration. Not a bigger configuration. Only the one required by demand within the financial recovery period. Of course, there may be operators with other deployment incentives than pure demand driven. Though on average I suspect this would have a neglectable effect on the scale of Western Europe (i.e., on average Western Europe Telco-land is assumed to be reasonable economically rational).
All in all, demand over the next 8 years leads to an 80+ Billion Euro RAN capital expenditure, required between 2022 and 2030. This, equivalent to a annual RAN investment level of a bit under 10 Billion Euro. The average RAN CapEx to Mobile Revenue over this period would be ca. 6.3%, which is not a shockingly high level (tbh), over a period that will see an intense rollout of 5G at increasingly higher frequencies and increasingly capable antenna configurations as demand picks up. Biggest threat to capital expenditures is poor demand models (or no demand models) and planning processes investing too much too early, ultimately resulting in buyers regret and cycled in-efficient investment levels over the next 10 years. And for the reader still awake and sharp, please do note that I have not mentioned the huge elephant in the room … The associated incremental operational expense (OpEx) that such investments will incur.
As mobile revenues are not expected to increase over the period 2022 to 2030, this leaves 5G investments main purpose to maintaining current business level dominated by consumer demand. I hope this scenario will not materialize. Given how much extra quality and service potential 5G will deliver over the next 10 years, it seems rather pessimistic to assume that our customers would not be willing to pay more for that service enhancement that 5G will brings with it. Alas, time will show.
Acknowledgement.
I greatly acknowledge my wife Eva Varadi for her support, patience and understanding during the creative process of writing this Blog. Petr Ledl, head of DTAG’s Research & Trials, and his team’s work has been a continuous inspiration to me (thank you so much for always picking up on that phone call Petr!). Also many of my Deutsche Telekom AG, T-Mobile NL & Industry colleagues in general have in countless of ways contributed to my thinking and ideas leading to this little Blog. Thank you!
Rachid El Hattachi & Javan Erfanian , “5G White Paper”, NGMN Alliance, (February 2015). See also “5G White Paper 2” by Nick Sampson (Orange), Javan Erfanian (Bell Canada) and Nan Hu (China Mobile).
Global Mobile Frequencies Database. (last update, 25 May 2021). I recommend very much to subscribe to this database (€595,. single user license). Provides a wealth of information on spectrum portfolios across the world.
Jia Shen, Zhongda Du, & Zhi Zhang, “5G NR and enhancements, from R15 to R16”, Elsevier Science, (2021). Provides a really good overview of what to expect from 5G standalone. Particular, very good comparison with what is provided with 4G and the differences with 5G (SA and NSA).
Ali Zaidi, Fredrik Athley, Jonas Medbo, Ulf Gustavsson, Giuseppe Durisi, & Xiaoming Chen, “5G Physical Layer Principles, Models and Technology Components”, Elsevier Science, (2018). The physical layer will always pose a performance limitation on a wireless network. Fundamentally, the amount of information that can be transferred between two locations will be limited by the availability of spectrum, the laws of electromagnetic propagation, and the principles of information theory. This book provides a good description of the 5G NR physical layer including its benefits and limitations. It provides a good foundation for modelling and simulation of 5G NR.
Thomas L. Marzetta, Erik G. Larsson, Hong Yang, Hien Quoc Ngo, “Fundamentals of Massive MIMO”, Cambridge University Press, (2016). Excellent account of the workings of advanced antenna systems such as massive MiMo.
Western Europe: Western Europe has a bit of a fluid definition (I have found), here Western Europe includes the following countries comprising a population of ca. 425 Million people (in 2021); Austria, Belgium, Denmark, Finland, France, Germany, Greece, Ireland, Italy, Netherlands, Norway, Portugal, Spain, Sweden, Switzerland United Kingdom, Andorra, Cyprus, Faeroe Islands, Greenland, Guernsey, Jersey, Malta, Luxembourg, Monaco, Liechtenstein, San Marino, Gibraltar.


 and
and 


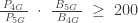


 package allowing the customer to consume up to 3 GB is priced at 20 (irrespective of whether the customer would consume less). For package
  a consumer would pay 100 for a data consumption allowance up to 35 GB. Of course, we assume that the consumer choosing this package would generally consume more than 24 GB, which is the next cheaper package (i.e.,
  ).
). , could increase consumption with 4 GB (+50%) before considering the next level price plan (i.e.,


![CV_X \; - \; CV_Y \; = \; \Delta Capex \; \left[ \frac{1 \; - \; g}{\; WACC \; - \; g \;} \right]](https://s0.wp.com/latex.php?latex=CV_X+%5C%3B+-+%5C%3B+CV_Y+%5C%3B+%3D+%5C%3B+%5CDelta+Capex+%5C%3B+%5Cleft%5B+%5Cfrac%7B1+%5C%3B+-+%5C%3B+g%7D%7B%5C%3B+WACC+%5C%3B+-+%5C%3B+g+%5C%3B%7D+%5Cright%5D&bg=ffffff&fg=333333&s=0&c=20201002)


 or
or  ) is the direct driver of network load, and thus, network investments, the volumetric demand, is a manifestation of that throughput demand.
 being the number of active users in a given radio cell at the time-instant of unit t taken within a day.
  is the Bytes consumed in a time instant (e.g., typically a second); thus, 8
  bits/sec) in the same instant and take the maximum across. For example, a day provides the busiest hour throughput for the whole network. Each radio cell drives its capacity provision and supply (in bits/sec) and the investments required to provide that demanded capacity in the air interface and front- and back-haul.
 ) given in bits per second, the basic building block of quality, is relatively easy to estimate. The cellular throughput (per unit cell) is provided by the amount of committed frequency spectrum to the air interface, what your radio access network and antenna support are, multiplied by the so-called spectral efficiency in bits per Hz per cell. The spectral efficiency depends on the antenna technology and the underlying software implementation of signal processing schemes enabling the details of receiving and sending signals over the air interface.
 of ca. 20 Mbps/MHz/cell (i.e.,
  ), we should expect to have a cell throughput on average at 1,000 Mbps (1 Gbps).