

INTRO.
On September 10, at the Berlin Open RAN Working Week (BOWW) (a public event arranged by Deutsche Telekom AG’s T-Labs), I will give a talk about AI in Open RAN and RAN in general. The focus of the talk will be on how AI in RAN can boost the spectral efficiency. I have about 20 minutes, which is way too short to convey what is happening in this field at the moment. Why not write a small piece on the field as I see it at the moment? So, enjoy and feel free to comment or contact me directly for one-on-one discussions. If you are at the event, feel free to connect there as well.
LOOKING BACK.
The earliest use of machine learning and artificial intelligence in the Radio Access Network did not arrive suddenly with the recent wave of AI-RAN initiatives. Long before the term “AI-native RAN” (and even the term AI) became fashionable, vendors were experimenting with data-driven methods to optimize radio performance, automate operations, and manage complexity that traditional engineering rules could no longer handle well or at all. One of the first widely recognized examples came from Ericsson, which worked with SoftBank in Japan on advanced coordination features that would later be branded as Elastic RAN. By dynamically orchestrating users and cell sites, these early deployments delivered substantial throughput gains in dense environments such as Tokyo Station (with more than half a million passengers daily). Although they were not presented as “AI solutions,” they relied on principles of adaptive optimization that anticipated later machine learning–based control loops.
Nokia, and previously Nokia-Siemens Networks, pursued a similar direction through Self-Organizing Networks. SON functions, such as neighbor list management, handover optimization, and load balancing, increasingly incorporate statistical learning and pattern recognition techniques. These capabilities were rolled out across 3G and 4G networks during the 2010s and can be seen as some of the earliest mainstream applications of machine learning inside the RAN. Samsung, Huawei, and ZTE also invested in intelligent automation at this stage, often describing their approaches in terms of network analytics and energy efficiency rather than artificial intelligence, but drawing on many of the same methods. Around the same time, startups began pushing the frontier further: Uhana, founded in 2016 (acquired by VMware in 2019), pioneered the use of deep learning for real-time network optimization and user-experience prediction, going beyond rule-based SON to deliver predictive, closed-loop control. Building on that trajectory, today’s Opanga represents a (much) more advanced, AI-native and vendor-agnostic RAN platform, addressing long-standing industry challenges such as congestion management, energy efficiency, and intelligent spectrum activation at scale. In my opinion, both Uhana and Opanga can be seen as early exemplars of the types of applications that later inspired the formalization of rApps and xApps in the O-RAN framework.
What began as incremental enhancements in SON and coordination functions gradually evolved into more explicit uses of AI. Ericsson extended its portfolio with machine-learning-based downlink link adaptation and parameter optimization; Nokia launched programs to embed AI into both planning and live operations; and other vendors followed suit. By the early 2020s, the industry had begun to coalesce around the idea of an AI-RAN, where RAN functions and AI workloads are tightly interwoven. This vision took concrete form in 2024 with the launch of the AI-RAN Alliance, led by NVIDIA and comprising Ericsson, Nokia, Samsung, SoftBank, T-Mobile, and other partners.
The trajectory from SON and early adaptive coordination toward today’s GPU-accelerated AI-RAN systems underscores that artificial intelligence in the RAN has been less a revolution than an evolution. The seeds were sown in the earliest machine-learning-driven automation of 3G and 4G networks, and they have grown into the integrated AI-native architectures now being tested for 5G Advanced and beyond.

AI IN OPEN RAN – THE EARLIER DAYS.
Open RAN as a movement has its roots in the xRAN Forum (founded in 2016) and the O-RAN Alliance (created in early 2018 when xRAN merged with C-RAN Alliance). While the architectural thinking and evolution around what has today become the O-RAN Architecture (with its 2 major options) is interesting and very briefly summarized in the above figure. The late 2010s were a time when architectural choices were made in a climate of enormous enthusiasm for cloud-native design and edge cloud computing. At that time, “disaggregation for openness” was considered an essential condition for competition, innovation, and efficiency. I also believe that when xRAN was initiated around 2016, the leading academic and industrial players came predominantly from Germany, South Korea, and Japan. Each of these R&D cultures has a deep tradition of best-in-breed engineering, that is, the idea that the most specialized team or vendor should optimize every single subsystem, and that overall performance emerges from integrating these world-class components. Looking back today, with the benefit of hindsight, one can see how this cultural disposition amplified the push for the maximum disaggregation paradigm, even where integration and operational realities would later prove more challenging. It also explains why early O-RAN documents are so ambitious in scope, embedding intelligence into every layer and opening almost every possible interface imaginable. What appeared to be a purely technical roadmap was, in my opinion, also heavily shaped by the R&D traditions and innovation philosophies of the national groups leading the effort.
However, although this is a super interesting topic (i.e., how culture and background influence innovation, architectural ideas, and choices), it is not the focus of this paper. AI in RAN is the focus. From its very first architectural documents, O-RAN included the idea that AI and ML would be central to automating and optimizing the RAN.
The key moment was 2018, when the O-RAN Alliance released its initial O-RAN architecture white paper (“O-RAN: Towards an Open and Smart RAN”). That document explicitly introduced the concept of the Non-Real-Time (NRT) RIC (rApps) and the Real-Time (RT) RIC (xApps) as platforms designed to host AI/ML-based applications. The NRT RIC was envisioned to run in the operator’s cloud, providing policy guidance, training, and coordination of AI models at timescales well above a second. In contrast, the RT RIC (i.e., the official name is RT RIC, which is unfortunate for abbreviations among the two RICs) would host faster-acting control applications within the 10-ms to 1-s regime. These were framed not just as generic automation nodes but explicitly as AI/ML hosting environments. The idea of a dual RIC structure, breaking up the architecture in layers of relevant timescales, was not conceived in a vacuum. It is, in many ways, an explicit continuation of the ideas introduced in the 3GPP LTE Self-Organizing Network (SON) specifications, where optimization functions were divided between centralized, long-horizon processes running in the network management system and distributed, faster-acting functions embedded at the eNodeB. In the LTE context, the offline or centralized SON dealt with tasks such as PCI assignment, ANR management, and energy saving strategies at timescales of minutes to days. At the same time, the online or distributed SON reacted locally to interference, handover failures, or outages at timescales of hundreds of milliseconds to a few seconds. O-RAN borrowed this logic but codified it in a much more rigid fashion: the Non-RT RIC inherited the role of centralized SON, and the RT RIC inherited the role of distributed SON, with the addition of standardized interfaces and an explicit role as AI application platforms.

The choice to formalize this split also had political dimensions. Vendors were reluctant to expose their most latency-critical baseband algorithms to external control, and the introduction of an RT RIC created a sandbox where third-party innovation could be encouraged without undermining vendor control of the physical layer. At the same time, operators sought assurances that policy, assurance, and compliance would not be bypassed by low-latency applications; therefore, the Non-RT RIC was positioned as a control tower layer situated safely above the millisecond domain. In this sense, the breakup of the time domain was as much a governance and trust compromise as a purely technical necessity. By drawing a clear line between “safe and slow” and “fast but bounded,” O-RAN created a model that felt familiar to operators accustomed to OSS hierarchies, while signaling to regulators and ecosystem players that AI could be introduced in a controlled and explainable manner.

The figure above shows the O-RAN reference architecture with functional layers and interfaces. The Service Management and Orchestration (SMO) framework hosts the Non-Real-Time RIC (NRT-RIC), which operates on long-horizon loops (greater than 1 second) and is connected via the O1 interface to network elements and via O2 to cloud infrastructure (e.g., NFVI and MANO). Policies, enrichment information, and trained AI/ML models are delivered from the NRT-RIC to the Real-Time RIC (RT-RIC) over the A1 interface. The RT-RIC executes closed-loop control in the 10-ms to 1-s domain through xApps, interfacing with the CU/DU over E2. The 3GPP F1 split separates the CU and DU, while the DU connects to the RU through the open fronthaul (eCPRI/7-2x split). The RU drives active antenna systems (AAS) over largely proprietary interfaces (AISG for RET, vendor-specific for massive MIMO). The vertical time-scale axis highlights the progression from long-horizon orchestration at the SMO down to instant reflex functions in the RU/AAS domain. Both RU and DU operate on a transmission time interval (TTI) between 1 ms and 625 microseconds.
The O-RAN vision for AI and ML is built directly into its architecture from the very first white paper in 2018. The alliance described two guiding themes: openness and intelligence. Openness was about enabling multi-vendor, cloud-native deployments with open interfaces, which was supposed to provide for much more economical RAN solutions, while intelligence was about embedding machine learning and artificial intelligence into every layer of the RAN to deal with growing complexity (i.e., some of it self-inflicted by architecture and system design).
The architectural realization of this vision is the hierarchical RAN Intelligent Controller (RIC), which separates the control into different time domains and couples each to appropriate AI/ML functions:
- Service Management and Orchestration (SMO, timescale > 1 second) – The Control Tower: The SMO provides the overarching management and orchestration framework for the RAN. Its functions extend beyond the Non-RT RIC, encompassing lifecycle management, configuration, assurance, and resource orchestration across both network functions and the underlying cloud infrastructure. Through the O1 interface (see above figure), the SMO collects performance data, alarms, and configuration information from the CU, DU, and RU, enabling comprehensive FCAPS (Fault, Configuration, Accounting, Performance, Security) management. Through the O2 interface (see above), it orchestrates cloud resources (compute, storage, accelerators) required to host virtualized RAN functions and AI/ML workloads. In addition, the SMO hosts the Non-RT RIC, meaning it not only provides operational oversight but also integrates AI/ML governance, ensuring that trained models and policy guidance align with operator intent and regulatory requirements.
- Non-Real-Time RIC (NRT RIC, timescale > 1 second) – The Policy Brain: Directly beneath, embedded in the SMO, lies the NRT-RIC, described here as the “policy brain.” This is where policy management, analytics, and AI/ML model training take place. The non-RT RIC collects large volumes of data from the network (spatial-temporal traffic patterns, mobility traces, QoS (Quality of Service) statistics, massive MIMO settings, etc.) and uses them for offline training and long-term optimization. Trained models and optimization policies are then passed down to the RT RIC via the A1 interface (see above). A central functionality of the NRT-RIC is the hosting of rApps (e.g., Python or Java code), which implement policy-driven use cases such as energy savings, traffic steering, and mobility optimization. These applications leverage the broader analytic scope and longer timescales of the NRT-RIC to shape intent and guide the near-real-time actions of the RT-RIC. The NRT-RIC is traditionally viewed as an embedded entity within the SMO (although in theory, it could be a standalone entity)..
- Real-Time RIC (RT RIC, 10 ms – 1 second timescale) – The Decision Engine: This is where AI-driven control is executed in closed loops. The real-time RT-RIC hosts xApps (e.g., Go or C++ code) that run inference on trained models and perform tasks such as load balancing, interference management, mobility prediction, QoS management, slicing, and per-user (UE) scheduling policies. It maintains a Radio Network Information Base (R-NIB) fed via the E2 interface (see above) from the DU/CU, and uses this data to make fast control decisions in near real-time.
- Centralized Unit (CU): Below the RT-RIC sits the Centralized Unit, which takes on the role of the “shaper” in the O-RAN architecture. The CU is responsible for higher-layer protocol processing, including PDCP (Packet Data Convergence Protocol) and SDAP (Service Data Adaptation Protocol), and is therefore the natural point in the stack where packet shaping and QoS enforcement occur. At this level, AI-driven policies provided by the RT-RIC can directly influence how data streams are prioritized and treated, ensuring that application- or slice-specific requirements for latency, throughput, and reliability are respected. By interfacing with the RT-RIC over the E2 interface, the CU can dynamically adapt QoS profiles and flow control rules based on real-time network conditions, balancing efficiency with service differentiation. In this way, the CU acts as the bridge between AI-guided orchestration and the deterministic scheduling that occurs deeper in the DU/RU layers. The CU operates on a real-time but not ultra-tight timescale, typically in the range of tens of milliseconds up to around one second (similar to the RT-RIC), depending on the function.
- DU/RU layer (sub-1 ms down to hundreds of microseconds) – The Executor & Muscles: The Distributed Unit (DU), located below the CU, is referred to as the “executor.” It handles scheduling and precoding at near-instant timescales, measured in sub-millisecond intervals. Here, AI functions take the form of compute agents that apply pre-trained or lightweight models to optimize resource block allocation and reduce latency. At the bottom, the Radio Unit (RU) represents the “muscles” of the system. Its reflex actions happen at the fastest time scales, down to hundreds of microseconds. While it executes deterministic signal processing, beamforming, and precoding, it also feeds measurements upward to fuel AI learning higher in the chain. Here reside the tightest loops, on a Transmission Time Interval (TTI) time scale (i.e., 1ms – 625 µs), such as baseband PHY processing, HARQ feedback, symbol scheduling, and beamforming weights. These functions require deterministic latencies and cannot rely on higher-layer AI/ML loops. Instead, the DU/RU executes control at the L1/L2 level, while still feeding measurement data upward for AI/ML training and adaptation.

The figure above portrays the Open RAN as a “chain of command” where intelligence flows across time scales, from long-horizon orchestration in the cloud down to sub-millisecond reflexes in the radio hardware. To make it more tangible, I have annotated the example of spectral efficiency optimization use case on the right side of the figure. The cascading structure, shown above, highlights how AI and ML roles evolve across the architecture. For instance, the SMO and NRT-RIC increase perceived spectral efficiency through strategic optimization, while the RT-RIC reduces inefficiencies by orchestrating fast loops. Additionally, the DU/RU contribute directly to signal quality improvements, such as SINR gains. The figure thus illustrates Open RAN not as a flat architecture, but as a hierarchy of brains, decisions, and muscles, each with its own guiding time scale and AI function. Taken together, the vision is that AI/ML operates across all time domains, with the non-RT RIC providing strategic intelligence and model training, the RT RIC performing agile, policy-driven adaptation, and the DU/RU executing deterministic microsecond-level tasks, while exposing data to feed higher-layer intelligence. With open interfaces (A1, E2, open fronthaul), this layered AI approach allows multi-vendor participation, third-party innovation, and closed-loop automation across the RAN.
From 2019 onward, O-RAN working groups such as WG2 (Non-RT RIC & A1 interface) and WG3 (RT RIC & E2 interface) began publishing technical specifications that defined how AI/ML models could be trained, distributed, and executed across the RIC layers. By 2020–2021, proof-of-concepts and plugfests showcased concrete AI/ML use cases, such as energy savings, traffic steering, and anomaly detection, running as xApps (residing in RT-RIC) and rApps (residing in NRT-RIC). Following the first O-RAN specifications and proof-of-concepts, it becomes helpful to visualize how the different architectural layers relate to AI and ML. You will find a lot of the standardization documents in the reference list at the end of the document.
rAPPS AND xAPPS – AN ILLUSTRATION.
In the Open RAN architecture, the system’s intelligence is derived from the applications that run on top of the RIC platforms. The rApps exist in the Non-Real-Time RIC and xApps in the Real-Time RIC. While the RICs provide the structural framework and interfaces, it is the apps that carry the logic, algorithms, and decision-making capacity that ultimately shape network behavior. rApps operate at longer timescales, often drawing on large datasets and statistical analysis to identify trends, learn patterns, and refine policies. They are well-suited to classical machine learning processes such as regression, clustering, and reinforcement learning, where training cycles and retraining benefit from aggregated telemetry and contextual information. In practice, rApps are commonly developed in high-level languages such as Python or Java, leveraging established AI/ML libraries and data processing pipelines. In contrast, xApps must execute decisions in near-real time, directly influencing scheduling, beamforming, interference management, and resource allocation. Here, the role of AI and ML is to translate abstract policy into fast, context-sensitive actions, with an increasing reliance on intelligent control strategies, adaptive optimization, and eventually even agent-like autonomy (more on that later in this article). To meet these latency and efficiency requirements, xApps are typically implemented in performance-oriented languages like C++ or Go. However, Python is often used in prototyping stages before critical components are optimized. Together, rApps and xApps represent the realization of intelligence in Open RAN. One set grounded in long-horizon learning and policy shaping (i.e., Non-RT RIC and rApps), the other in short-horizon execution and reflexive adaptation (RT-RIC and xApps). Their interplay is not only central to energy efficiency, interference management, and spectral optimization but also points toward a future where classical ML techniques merge with more advanced AI-driven orchestration to deliver networks that are both adaptive and self-optimizing. Let us have a quick look at examples that illustrate how these applications work in the overall O-RAN architectural stack.

One way to understand the rApp–xApp interaction is to follow a simple energy efficiency use case, shown in the figure below. At the top, an energy rApp in the Non-RT RIC learns long-term traffic cycles and defines policies such as ‘allow cell muting below 10% load.’ These policies are then passed to the RT-RIC, where an xApp monitors traffic every second and decides when to shut down carriers or reduce power. The DU translates these decisions into scheduling and resource allocations, while the RU executes the physical actions such as switching off RF chains, entering sleep modes, or muting antenna elements. The figure above illustrates how policy flows downward while telemetry and KPIs flow back up, forming a continuous energy optimization loop. Another similarly layered logic applies to interference coordination, as shown in the figure below. Here, an interference rApp in the Non-RT RIC analyzes long-term patterns of inter-cell interference and sets coordination policies — for example, defining thresholds for ICIC, CoMP, or power capping at the cell edge. The RT-RIC executes these policies through xApps that estimate SINR in real time, apply muting patterns, adjust transmit power, and coordinate beam directions across neighboring cells. The DU handles PRB scheduling and resource allocation, while the RU enacts physical layer actions, such as adjusting beam weights or muting carriers. This second loop shows how rApps and xApps complement each other when interference is the dominant concern.

Yet these loops do not always reinforce each other. If left uncoordinated, they can collide. An energy rApp may push the system toward contraction, reducing Tx power, muting carriers, and blanking PRBs. In contrast, an interference xApp simultaneously pushes for expansion, raising Tx power, activating carriers, and dynamically allocating PRBs. Both act on the same levers inside the CU/DU/RU, but in opposite directions. The result can be oscillatory behaviour, with power and scheduling thrashing back and forth, degrading QoS, and wasting energy. The figure below illustrates this risk and underscores why conflict management and intent arbitration are critical for a stable Open RAN.

Beyond the foundational description of how rApps and xApps operate, it is equally important to address the conflicts and issues that can arise when multiple applications are deployed simultaneously in the Non-RT and RT-RICs. Because each app is designed with a specific optimization objective in mind, it is almost inevitable that two or more apps will occasionally attempt to act on the same parameters in contradictory ways. While the energy efficiency versus interference management example is already well understood, there are broader categories of conflict that extend across both timescales.
Conflicts between rApps occur when long-term policy objectives are not aligned. For instance, a spectral efficiency rApp may continuously push the network toward maximizing bits per Hertz by advocating for higher transmit power, more active carriers, or denser pilot signaling. At the same time, an energy-saving rApp may be trying to mute those very carriers, reduce pilot density, and cap transmit power to conserve energy. Both policies can be valid in isolation, but when issued without coordination, they create conflicting intents that leave the RT-RIC and lower layers struggling to reconcile them. Even worse, the oscillatory behavior that results can propagate into the DU and RU, creating instability at the level of scheduling and RF execution. The xApps, too, can easily find themselves in conflict when they react to short-term KPI fluctuations with divergent strategies. An interference management xApp might impose aggressive PRB blanking patterns or reduce power at the cell edge. At the same time, a mobility optimization xApp might simultaneously widen cell range expansion parameters to offload traffic. The first action is designed to protect edge users, while the second may flood them with more load, undoing the intended benefit. Similarly, an xApp pushing for higher spectral efficiency may keep activating carriers and pushing toward higher modulation and coding schemes, while another xApp dedicated to energy conservation is attempting to put those carriers to sleep. The result is rapid toggling of resource states, which wastes signaling overhead and disrupts user experience.
The O-RAN Alliance has recognized these risks and proposed mechanisms to address them. Architecturally, conflict management is designed to reside in the RT-RIC, where a Conflict Mitigation and Arbitration framework evaluates competing intents from different xApps before they reach the CU/DU. Policies from the Non-RT RIC can also be tagged with priorities or guardrails, which the RT-RIC uses to arbitrate real-time conflicts. In practice, this means that when two xApps attempt to control the same parameter, the RT-RIC applies priority rules, resolves contradictions, or, in some cases, rejects conflicting commands entirely. On the rApp side, conflict resolution is handled at a higher abstraction level by the Non-RT RIC, which can consolidate or harmonize policies before they are passed down through the A1 interface.
The layered conflict mitigation approach in O-RAN provides mechanisms to arbitrate competing intents between apps. It can reduce the risk of oscillatory behavior, but it cannot guarantee stability completely. Since rApps and xApps may originate from different sources and vary in design quality, careful testing, certification, and continuous monitoring will remain essential to ensure that application diversity does not undermine network coherence. Equally important are policies that impose guardbands, buffers, and safety margins in how parameters can be tuned, which serve as a hedge against instabilities when apps are misaligned, whether the conflict arises between rApps, between xApps, or across the rApp–xApp boundary. These guardbands provide the architectural equivalent of shock absorbers, limiting the amplitude of conflicting actions and ensuring that, even if multiple apps pull in different directions, the network avoids catastrophic oscillations.
Last but not least, the risks may increase as rApps and xApps evolve beyond narrowly scoped optimizers into more agentic forms. An agentic app does not merely execute a set of policies or inference models. It can plan, explore alternatives, and adapt its strategies with a degree of autonomy (and agency). While this is likely to unlock powerful new capabilities, it also expands the possibility of emergent and unforeseen interactions. Two agentic apps, even if aligned at deployment, may drift toward conflicting behaviors as they continuously learn and adapt in real time. Without strict guardrails and robust conflict resolution, such autonomy could magnify instabilities rather than contain them, leading to system behavior that is difficult to predict or control. In this sense, the transition from classical rApps and xApps to agentic forms is not only an opportunity but also a new frontier of risk that must be carefully managed within the O-RAN architecture.
IS AI IN RAN ALL ABOUT “ChatGPT”?
I want to emphasize that when I address AI in the RAN, I generally do not refer to generative language models, such as ChatGPT, or other large-scale conversational systems built upon a human language context. Those technologies are based on Large Language Models (LLMs), which belong to the family of deep learning architectures built on transformer networks. A transformer network is a type of neural network architecture built around the attention mechanism, which allows the model to weigh the importance of different parts of an input sequence simultaneously rather than processing it step by step. They are typically trained on enormous human-based text datasets, utilizing billions of parameters, which requires immense computational resources and lengthy training cycles. Their most visible purpose today is to generate and interpret human language, operating effectively at the scale of seconds or longer in user interactions. In the context of network operations, I suspect that GPT-like LLMS will have a mission in the frontend where humans will need to interact with the communications network using human language. That said, the notion of “generative AI” is not inherently limited to natural language. The same underlying transformer-based methods can be adapted to other modalities (information sources), including machine-oriented languages or even telemetry sequences. For example, a generative model trained on RAN logs, KPIs, and signaling traces could be used to create synthetic telemetry or predict unusual event patterns. In this sense, generative AI could provide value to the RAN domain by augmenting datasets, compressing semantic information, or even assisting in anomaly detection. The caveat, however, is that these benefits still rely on heavy models with large memory footprints and significant inference latency. While they may serve well in the Non-RT RIC or SMO domain, where time scales are relaxed and compute resources are more abundant, they are unlikely to be terribly practical for the RT RIC or the DU/RU, where deterministic deadlines in the millisecond or microsecond range must be met.
By contrast, the application of AI/ML in the RAN is fundamentally about real-time signal processing, optimization, and control. RAN intelligence focuses on tasks such as load balancing, interference mitigation, mobility prediction, traffic steering, energy optimization, and resource scheduling. These are not problems of natural human language understanding but of strict scheduling and radio optimization. The time scales at which these functions operate are orders of magnitude shorter than those typical of generative AI. From long-horizon analytics in the Non-RT RIC (greater than one second) to near-real-time inference in the RT-RIC (i.e., 10 ms–1 s), and finally to deterministic microsecond loops in the DU/RU. This stark difference in time scales and problem domains explains why it appears unlikely that the RAN can be controlled end-to-end by “ChatGPT-like” AI. LLMs, whether trained on human language or telemetry sequences, are (today at least) too computationally heavy, too slow in inference, and are optimized for open-ended reasoning rather than deterministic control. Instead, the RAN requires a mix of lightweight supervised and reinforcement learning models, online inference engines, and, in some cases, ultra-compact TinyML implementations that can run directly in hardware-constrained environments.
In general, AI in the RAN is about embedding intelligence into control loops at the right time scale and with the right efficiency. Generative AI may have a role in enriching data and informing higher-level orchestration. It is difficult to see how it can efficiently replace the tailored, lightweight models that drive the RAN’s real-time and near-real-time control.
As O-RAN (and RAN in general) evolves from a vision of open interfaces and modular disaggregation into a true intelligence-driven network, one of the clearest frontiers is the use of Large Language Models (LLMs) at the top of the stack (i.e., frontend/human-facing). The SMO, with its embedded Non-RT RIC, already serves as the strategic brain of the architecture, responsible for lifecycle management, long-horizon policy, and the training of AI/ML models. This is also the one domain where time scales are relaxed, measured in seconds or longer, and where sufficient compute resources exist to host heavier models. In this environment, LLMs can be utilized in two key ways. First, they can serve as intent interpreters for intent-driven network operations, bridging the gap between operator directives and machine-executable policies. Instead of crafting detailed rules or static configuration scripts, operators could express high-level goals, such as prioritizing emergency service traffic in a given region or minimizing energy consumption during off-peak hours. An LLM, tuned with telecom-specific knowledge, can translate those intents into precise policy actions distributed through the A1 interface to the RT RIC. Second, LLMs can act as semantic compressors, consuming the vast streams of logs, KPIs, and alarms that flow upward through O1, and distilling them into structured insights or natural language summaries that humans can easily grasp. This reduces cognitive load for operators while ensuring (at least we should hope so!) that the decision logic remains transparent, possibly explainable, and auditable. In both roles, LLMs do not replace the specialized ML models running lower in the architecture. Instead, they enhance the orchestration layer by embedding reasoning and language understanding where time and resources permit.
WHAT AI & ML ARE LIKELY TO WORK IN RAN?
This piece assumes a working familiarity with core machine-learning concepts, models, training and evaluation processes, and the main families you will encounter in practice. If you want a compact, authoritative refresher, most of what I reference is covered, clearly and rigorously, in Goodfellow, Bengio, and Courville’s Deep Learning (Adaptive Computation and Machine Learning series, MIT Press). For hands-on practice, many excellent Coursera courses walk through these ideas with code, labs, and real datasets. They are a fast way to build the intuition you will need for the examples discussed in this section. Feel free to browse through my certification list, which includes over 60 certifications, with the earliest ML and AI courses dating back to 2015 (should have been updated by now), and possibly find some inspiration.
Throughout the article, I use “AI” and “ML” interchangeably for readability, but formally, they should be regarded as distinct. Artificial Intelligence (AI) is the broader field concerned with building systems that perceive their environment, reason about it, and act to achieve goals, encompassing planning, search, knowledge representation, learning, and decision-making. Machine Learning (ML) is a subset of AI that focuses specifically on data-driven methods that learn patterns or policies from examples, improving performance on a task through experience rather than explicit, hand-crafted rules, which is where the most interesting aspects occur.

Artificial intelligence in the O-RAN stack exhibits distinct characteristics depending on its deployment location. Still, it is helpful to see it as one continuous flow from intent at the very top to deterministic execution at the very bottom. So, let’s go with the flow.
At the level of the Service Management and Orchestration, AI acts as the control tower for the entire system. This is where business or human intent must be translated into structured goals, and where guardrails, audit mechanisms, and reversibility are established to ensure compliance with regulatory oversight. Statistical models and rules remain essential at this layer because they provide the necessary constraint checking and explainability for governance. Yet the role of large language models is increasing rapidly, as they provide a bridge from human language into structured policies, intent templates, and root-cause narratives. Generative approaches are also beginning to play a role by producing synthetic extreme events to stress-test policies before they are deployed. While synthetic data for rare events offers a powerful tool for training and stress-testing AI systems, it may carry significant statistical risks. Generative models can fail to represent the very distributions they aim to capture, bias inference, or even introduce entirely artificial patterns into the data. Their use therefore requires careful anchoring in extremes-aware statistical methods, rigorous validation against real-world holdout data, and safeguards against recursive contamination. When these conditions are met, synthetic data can meaningfully expand the space of scenarios available for training and testing. Without the appropriate control mechanisms, decisions or policies based on synthetic data risk becoming a source of misplaced confidence rather than resilience. With all that considered, the SMO should be the steward of safety and interpretability, ensuring that only validated and reversible actions flow down into the operational fabric. If agentic AI is introduced here, it could reshape how intent is operationalized. Instead of merely validating human inputs, agentic systems might proactively (autonomeously) propose actions, refine intents into strategies, or initiate self-healing workflows on their own. While this promises greater autonomy and resilience, it also raises new challenges for oversight, since the SMO would become not just a filter but a creative actor in its own right.
At the top level, rApps (which reside in the NRT-RIC) are indirectly shaped by SMO policies, as they inherit intent, guardrails, and reversibility constraints. For example, when the SMO utilizes LLMs to translate business goals into structured intents, it essentially sets the design space within which rApps can train or re-optimize their models. The SMO also provides observability hooks, allowing rApp outputs to be audited before being pushed downstream.
The Non-Real-Time RIC can be understood as the long-horizon brain of the RAN. Its function is to train, retrain, and refine models, conduct long-term analysis, and transform historical and simulated experience into reusable policies. Reinforcement learning in its many flavors is the cornerstone here, particularly offline or constrained forms that can safely explore large data archives or digital twin scenarios. Autoencoders, clustering, and other representation learning methods uncover hidden structures in traffic and mobility, while supervised deep networks and boosted trees provide accurate forecasting of demand and performance. Generative simulators extend the scope by fabricating rare but instructive scenarios, allowing policies to be trained for resilience against the unexpected. Increasingly, language-based systems are also being applied to policy generation, bridging between strategic descriptions and machine-enforceable templates. The NRT-RIC strengthens AI’s applicability by moving risk away from live networks, producing validated artifacts that can later be executed at speed. If an agentic paradigm is introduced here, it would mean that the NRT-RIC is not merely a training ground but an active planner, continuously setting objectives for the rest of the system and negotiating trade-offs between coverage, energy, and user experience. This shift would make the Non-RT RIC a more autonomous planning organ, but it would also demand stronger mechanisms for bounding and auditing its explorations.
Here, at the NTR-RIC, rApps that are native to this RIC level are the central vehicle for model training, policy generation, and scenario exploration. They consume SMO intent and turn it into reusable policies or models for the RT-RIC. For example, a mobility rApp could use clustering and reinforcement learning to generate policies for user handover optimization, which the RT-RIC then executes in near real time. Another rApp might simulate mMIMO pairing scenarios offline, distill them into simplified lookup tables or quantized policies, and hand these artifacts down for execution at the DU/RU. Thus, rApps act as the policy factories. Their outputs cascade into xApps, at the RT-RIC, CU parameter sets, and lightweight silicon-bound models deeper down.
The Real-Time RIC is where planning gives way to fast, local action. At timescales between ten milliseconds and one second, the RT-RIC is tasked with run-time inference, traffic steering, slicing enforcement, and short-term interference management. Because the latency budget is tight, the model families that thrive here are compact and efficient. Shallow neural networks, recurrent models, and temporal CNN-RNN hybrids are all appropriate for predicting near-future load and translating context into rapid actions. Decision trees and ensemble methods remain attractive because of their predictable execution and interpretability. Online reinforcement learning, in which an agent interacts with its environment in real-time and updates its policy based on rewards or penalties, together with contextual bandits, a simplified variant that optimizes single-step decisions from observed contexts, both enable adaptation in small, incremental steps while minimizing the risk of destabilization. In specific contexts, lightweight graph neural networks (GNNs), which are streamlined versions of GNNs designed to model relationships between entities while keeping computational costs low, can capture the topological relationships between neighboring cells. In the RT-RIC, models must balance accuracy with predictable execution under tight timescales. Shallow neural networks (simple feedforward models capturing non-linear patterns), recurrent models (RNNs that retain memory of past inputs), and hybrid convolutional neural network–recurrent neural network (CNN–RNN) models (combining spatial feature extraction with temporal sequencing) are well-suited for processing fast-evolving time series, such as traffic load or interference, delivering near-future predictions with low latency. Decision trees (rule-based classifiers that split data hierarchically) and ensemble methods (collections of weak learners, such as random forests or boosting) add value through their lightweight, deterministic behavior and interpretability, making them reliable for regulatory oversight and stable actuation. Online reinforcement learning (RL) and contextual bandits further allow the system to adapt incrementally to changing conditions without risking destabilization. In more complex contexts, lightweight GNNs capture the topological structure between neighboring cells, supporting coordination in handovers or interference management while remaining efficient enough for real-time use. The RT-RIC thus embodies the point where AI policies become immediate operational decisions, measurable in KPIs within seconds. When viewed through the lens of agency, this layer becomes even more dynamic. An agentic RT-RIC could weigh competing goals, prioritize among multiple applications, and negotiate real-time conflicts without waiting for external intervention. Such an agency might significantly improve efficiency and responsiveness but would also blur the boundary between optimization and autonomous control, requiring new arbitration frameworks and assurance layers.
At this level, xApps, native to the RT-RIC, execute policies derived from rApps and adapt them to live network telemetry. An xApp for traffic steering might combine a policy from the Non-RT RIC with local contextual bandits to adjust routing in the moment. Another xApp could, for example, use lightweight GNNs to coordinate interference management across adjacent cells, directly influencing DU scheduling and RU beamforming. This makes xApps the translators of long-term rApp insights into second-by-second action, bridging the predictive foresight of rApps with the deterministic constraints of the DU/RU.
The Centralized Unit occupies an intermediate position between near-real-time responsiveness and higher-layer mobility and bearer management. Here, the most useful models are those that can both predict and pre-position resources before bottlenecks occur. Long Short-Term Memory networks (LSTMs, recurrent models designed to capture long-range dependencies), Gated Recurrent Units (GRUs, simplified RNNs with fewer parameters), and temporal Convolutional Neural Networks (CNNs, convolution-based models adapted for sequential data) are natural fits for forecasting user trajectories, mobility patterns, and session demand, thereby enabling proactive preparation of handovers and early allocation of network slices. Constrained reinforcement learning (RL, trial-and-error learning optimized under explicit safety or policy limits) methods play an important role at the bearer level, where they must carefully balance Quality of Service (QoS) guarantees against overall resource utilization, ensuring efficiency without violating service-level requirements. At the same time, rule-based optimizers remain well-suited for more deterministic processes, such as configuring Packet Data Convergence Protocol (PDCP) and Radio Link Control (RLC) parameters, where fixed logic can deliver predictable and stable outcomes in real-time. The CU strengthens applicability by anticipating issues before they materialize and by converting intent into per-flow adjustments. If agency is introduced at this layer, it might manifest as CU-level agents negotiating mobility anchors or bearer priorities directly, without relying entirely on upstream instructions. This could increase resilience in scenarios where connectivity to higher layers is impaired. Still, it also adds complexity, as the CU would need a framework for coordinating its autonomous decisions with the broader policy environment.
Both xApps and rApps can influence CU functions as they relate to bearer management and PDCP/RLC configuration. For example, a QoS balancing rApp might propose long-term thresholds for bearer prioritization. At the same time, a short-horizon xApp enforces these by pre-positioning slice allocations or adjusting bearer anchors in anticipation of predicted mobility. The CU thus becomes a convergence point, where rApp strategies and xApp tactics jointly shape mobility management and session stability before decisions cascade into DU scheduling.
At the very bottom of the stack, the Distributed Unit and Radio Unit function under the most stringent timing constraints, often in the realm of microseconds. Their role is to execute deterministic PHY and MAC functions, including HARQ, link adaptation, beamforming, and channel state processing. Only models that can be compiled into silicon, quantized, or otherwise guaranteed to run within strict latency budgets are viable in this layer of the Radio Access Network. Tiny Machine Learning (TinyML), Quantized Neural Networks (QNN), and lookup-table distilled models enable inference speeds compatible with microsecond-level scheduling constraints. As RU and DU components typically operate under strict latency and computational constraints, TinyML and low-bit QNNs are ideal for deploying functions such as beam selection, RF monitoring, anomaly detection, or lightweight PHY inference tasks. Deep-unfolded networks and physics-informed neural models are particularly valuable because they can replace traditional iterative solvers in equalization and channel estimation, achieving high accuracy while ensuring fixed execution times. In advanced antenna systems, neural digital predistortion and amplifier linearization enhance power efficiency and spectral containment. At the same time, sequence-based predictors can cut down channel state information (CSI) overhead and help stabilize multi-user multiple-input multiple-output (MU-MIMO) pairing. At this level, the integration of agentic AI must, in my opinion, be approached with caution. The DU and RU domains are all about execution rather than deliberation. Introducing agency here could compromise determinism. However, carefully bounded micro-agents that autonomously tune beams or adjust precoders within strict envelopes might prove valuable. The broader challenge is to reconcile the demand for predictability with the appeal of adaptive intelligence baked into hardware.
At this layer, most intelligence is “baked in” and must respect microsecond determinism timescales. Yet, rApps and xApps may still indirectly shape the DU/RU environment. The DU/RU do not run complex agentic loops themselves, but they inherit distilled intelligence from the higher layers. Micro-agents, if used, must be tightly bound. For example, an RU micro-agent may autonomously choose among two or three safe precoding matrices supplied by an xApp, but never generate them on its own.
Taking all the above together, the O-RAN stack can be seen as a continuum of intelligence, moving from the policy-heavy, interpretative functions at the SMO to the deterministic, silicon-bound execution at the RU. Agentic AI has the potential to change this continuum by shifting layers from passive executors to active participants. An agentic SMO might not only validate intents but generate them. An agentic Non-RT RIC might become an autonomous planner. An agentic RT-RIC could arbitrate between conflicting goals independently. And even the CU or DU might gain micro-agents that adjust parameters locally without instruction. This greater autonomy promises efficiency and adaptability but raises profound questions about accountability, oversight, and control. If the agency is allowed to propagate too deeply into the stack, the risk is that millions of daily inferences are taken without transparent justification or the possibility of reversal. This situation is unlikely to be considered regulatory acceptable and would be in direct violation of the European Artificial Intelligence Act, violating core provisions of the EU AI Act. The main risks are a lack of adequate human oversight (Article 14), inadequate record-keeping and traceability (Article 12), failures of transparency (Article 13), and the inability to provide meaningful explanations to affected users (Article 86). Together, these gaps would undermine the broader lifecycle obligations on risk management and accountability set out in Articles 8–17. To mitigate that, openness becomes indispensable: open policies, open data schemas, model lineage, and transparent observability hooks allow agency to be exercised without undermining trust. In this way, the RAN of the future may become not only intelligent but agentic, provided that its newfound autonomy is balanced by openness, auditability, and human authority at the points that matter most. However, I suspect that reaching that point may be a much bigger challenge than developing the AI Agentic framework and autonomous processes.
While the promise of AI in O-RAN is compelling, it is equally important to recognize where existing functions already perform so effectively that AI has little to add. At higher layers, such as the SMO and the Non-RT RIC, the complexity of orchestration, policy translation, and long-horizon planning naturally creates a demand for AI. These are domains where deterministic rules quickly become brittle, and where the adaptive and generative capacities of modern models unlock new value. Similarly, the RT-RIC benefits from lightweight ML approaches because traffic dynamics and interference conditions shift on timescales that rule-based heuristics often struggle to capture. As one descends closer to execution, however, the incremental value of AI begins to diminish. In the CU domain, many bearer management and PDCP/RLC functions can be enhanced by predictive models. Still, much of the optimization is already well supported by deterministic algorithms that operate within known bounds. The same is even more pronounced at the DU and RU levels. Here, fundamental PHY and MAC procedures such as HARQ timing, CRC checks, coding and decoding, and link-layer retransmissions are highly optimized, deterministic, and hardware-accelerated. These functions have been refined over decades of wireless research, and their performance approaches the physical and information-theoretical limits. For example, beamforming and precoding illustrate this well. Linear algebraic methods such as zero-forcing and MMSE are deeply entrenched, efficient, and predictable. AI and ML can sometimes enhance them at the margins by improving CSI compression, reducing feedback overhead, or stabilizing non-stationary channels. Yet it is unlikely to displace the core mathematical solvers that already deliver excellent performance. Link adaptation is similar. While machine learning may offer marginal gains in dynamic or noisy conditions, conventional SINR-based thresholding remains highly effective and, crucially, deterministic. It is worth remembering that simply and arbitrarily applying AI or ML functionality to an architectural element does not necessarily mean it will make a difference or even turn out to be beneficial.
This distinction becomes especially relevant when considering the implications of agentic AI. In my opinion, agency is most useful at the top of the stack, where strategy, trade-offs, and ambiguity dominate. In the SMO or Non-RT RIC, agentic systems can propose strategies, negotiate policies, or adapt scenarios in ways that humans or static systems could never match. At the RT-RIC, a carefully bound agency may improve arbitration among competing applications. But deeper in the stack, particularly at the DU and RU, the agency adds little value and risks undermining determinism. At microsecond timescales, where physics rules and deadlines are absolute, autonomy may be less of an advantage and more of a liability. The most practical role of AI here is supplementary, enabling anomaly detection, parameter fine-tuning, or assisting advanced antenna systems in ways that respect strict timing constraints. This balance of promise and limitation underscores a central point. AI is not a panacea for O-RAN, nor should it be applied indiscriminately.

The Table above highlights how RAN intelligence has evolved from classical vendor-specific SON functions toward open O-RAN frameworks and Opanga’s RAIN platform. While Classical RAN relied heavily on embedded algorithms and static rules, O-RAN introduces rApps and xApps to distribute intelligence across near-real-time and non-real-time control loops. Opanga’s RAIN, however, stands out as a truly AI-native and vendor-agnostic platform that is already commercially deployed at scale today. By tackling congestion, energy reduction, and intelligent spectrum on/off management without reliance on DPI (which is, anyway, a losing strategy as QUIC becomes increasingly used) or proprietary stacks, RAIN directly addresses some of the most pressing efficiency and sustainability challenges in today’s networks. It also appears straightforward for Opanga to adapt its AI engines into rApps or xApps should the Open RAN market scale substantially in the future, reinforcing its potential as one of the strongest and most practical AI platforms in the RAN domain today.
A NATIVE-AI RAN TEASER.
Native-AI in the RAN context means that artificial intelligence is not just an add-on to existing processes, but is embedded directly into the system’s architecture, protocols, and control loops. Instead of having xApps and rApps bolted on top of traditional deterministic scheduling and optimization functions, a native-AI design treats learning, inference, and adaptation as first-class primitives in the way the RAN is built and operated. This is fundamentally different from today’s RAN system designs, where AI is mostly externalized, invoked at slower timescales, and constrained by legacy interfaces. In a native-AI architecture, intent, prediction, and actuation are tightly coupled at millisecond or even microsecond resolution, creating new possibilities for spectral efficiency, user experience optimization, and autonomous orchestration. A native-AI RAN would likely require heavier hardware at the edge of the network than today’s Open (or “classical”) RAN deployments. In the current architecture, the DU and RU rely on highly optimized deterministic hardware such as FPGAs, SmartNICs, and custom ASICs to execute PHY/MAC functions at predictable latencies and with tight power budgets. AI workloads are typically concentrated higher up in the stack, in the NRT-RIC or RT-RIC, where they can run on centralized GPU or CPU clusters without overwhelming the radio units. However, by contrast, a native-AI design pushes inference directly into the DU and even the RU, where microsecond-scale decisions on beamforming, HARQ, and link adaptation must be made. This implies the integration of embedded accelerators, such as AI-optimized ASICs, NPUs, or small-form-factor GPUs, into radio hardware, along with larger memory footprints for real-time model execution and storage. The resulting compute demand and cooling requirements could increase power consumption substantially beyond today’s SmartNIC-based O-RAN nodes. An effect that would be multiplied by millions of cell sites worldwide should such a design be chosen. This may (should!) raise concerns regarding both CapEx and OpEx due to higher costs for silicon and more demanding site engineering for power and heat management.

A native-AI RAN promises several advantages over existing architectures. By embedding intelligence directly into the control loops, the system can achieve higher spectral efficiency through ultra-fast adaptation of beamforming, interference management, and resource allocation, going beyond the limits of deterministic algorithms. It also allows for far more fine-grained optimization of the user experience, with decisions made per device, per flow, and in real-time, enabling predictive buffering and even semantic compression without noticeable delay. Operations themselves become more autonomous, with the RAN continuously tuning and healing itself in ways that reduce the need for manual intervention. Importantly, intent expressed at the management layer can be mapped directly into execution at the radio layer, creating continuity from policy to action that is missing in today’s O-RAN framework. Native-AI designs are also better able to anticipate and respond to extreme conditions, making the system more resilient under stress. Finally, they open the door to 6G concepts such as cell-less architectures, distributed massive MIMO, and AI-native PHY functions that cannot be realized under today’s layered, deterministic designs.
At the same time, the drawbacks of the Native-AI RAN approach may also be quite substantial. Embedding AI at microsecond control loops makes it almost impossible to trace reasoning steps or provide post-hoc explainability, creating tension with regulatory requirements such as the EU AI Act and NIS2. Because AI becomes the core operating fabric, mistakes, adversarial inputs, or misaligned objectives can cascade across the system much faster than in current architectures, amplifying the scale of failures. Continuous inference close to the radio layer also risks driving up compute demand and energy consumption far beyond what today’s SmartNIC- or FPGA-based solutions can handle. There is a danger of re-introducing vendor lock-in, as AI-native stacks may not interoperate cleanly with legacy xApps and rApps, undermining the very rationale of open interfaces. Training and refining these models requires sensitive operational and user data, raising privacy and data sovereignty concerns. Finally, the speed at which native-AI RANs operate makes meaningful human oversight nearly impossible, challenging the principle of human-in-the-loop control that regulators increasingly require for critical infrastructure operation.
Perhaps not too surprising, NVIDIA, a founding member of the AI-RAN Alliance, is a leading advocate for AI-native RAN, with strong leadership across infrastructure innovation, collaborative development, tooling, standard-setting, and future network frameworks. Their AI-Aerial platform and broad ecosystem partnerships illustrate their pivotal role in transitioning network architectures toward deeply integrated intelligence, especially in the 6G era. The AI-Native RAN concept and the gap it opens compared to existing O-RAN and classical RAN approaches will be the subject of a follow-up article I am preparing based on my current research into this field.
WHY REGULATORY AGENCIES MAY END THE AI PARTY (BEFORE IT REALLY STARTS).

We are about to “let loose” advanced AI/ML applications and processes across all aspects of our telecommunication networks. From the core all the way through to access and out to consumers and businesses making use of what is today regarded as highly critical infrastructure. This reduces cognitive load for operators while aiming to keep decision logic transparent, explainable, and auditable. In both roles, LLMs do not replace the specialized ML models running lower in the architecture. Instead, they enhance the orchestration layer by embedding reasoning and language understanding where time and resources permit. Yet it is here that one of the sharpest challenges emerges. The regulatory and policy scrutiny that inevitably follows when AI is introduced into critical infrastructure.
In the EU, the legal baseline now treats many network-embedded AI systems as high-risk by default whenever they are used as safety or operational components in the management and operation of critical digital infrastructure. This category encompasses modern telecom networks squarely. Under the EU AI Act, such systems must satisfy stringent requirements for risk management, technical documentation, transparency, logging, human oversight, robustness, and cybersecurity, and they must be prepared for conformity assessment and market surveillance. If the AI used in RAN control or orchestration cannot meet these duties, deployment can be curtailed or prohibited until compliance is demonstrated. The same regulation now also imposes obligations on general-purpose AI (foundation/LLM) providers, including additional duties when models are deemed to pose systemic risk, to enhance transparency and safety across the supply chain that may support telecom use cases. This AI-specific layer builds upon the EU’s broader critical infrastructure and cybersecurity regime. The NIS2 Directive strengthens security and incident-reporting obligations for essential entities, explicitly including digital and communications infrastructure, while promoting supply-chain due diligence. This means that operators must demonstrate how they assess and manage risks from AI components and vendors embedded in their networks. The EU’s 5G Cybersecurity Toolbox adds a risk-based, vendor-agnostic lens to supplier decisions (applied to “high-risk” vendors). Still, the logic is general: provenance alone, whether from China, the US, Israel, or any “friendly” jurisdiction, does not exempt AI/ML components from rigorous technical and governance assurances. The Cyber Resilience Act extends horizontal cybersecurity duties to “products with digital elements,” which can capture network software and AI-enabled components, linking market access to secure-by-design engineering, vulnerability handling, and update practices.
Data-protection law also bites. GDPR Article 22 places boundaries on decisions based solely on automated processing that produce legal or similarly significant effects on individuals, a genuine concern as networks increasingly mediate critical services and safety-of-life communications. Recent case law from the Court of Justice of the EU underscores a right of access to meaningful information about automated decision-making “procedures and principles,” raising the bar for explainability and auditability in any network AI that profiles or affects individuals. In short, operators must be able to show their work, not just that an AI policy improved a KPI, but how it made the call. These European guardrails are mirrored (though not identically) elsewhere. The UK Telecoms Security Act and its Code of Practice impose enforceable security measures on providers. In the US, the voluntary NIST AI Risk Management Framework has become the de facto blueprint for AI governance, emphasizing transparency, accountability, and human oversight, principles that regulators can (and do) import into sectoral supervision. None of these frameworks cares only about “who made it”. They also care about how it performs, how it fails, how it is governed, and how it can be inspected.
The AI Act’s human-oversight requirement (i.e., Article 14 in the EU Artificial Intelligence Act) exists precisely to bound such risks, ensuring operators can intervene, override, or disable when behavior diverges from safety or fundamental rights expectations. Its technical documentation and transparency obligations require traceable design choices and lifecycle records. Where these assurances cannot be demonstrated, regulators may limit or ban such deployments in critical infrastructure.
Against this backdrop, proposals to deploy autonomous AI agents deeply embedded in the RAN stack face a (very) higher bar. Autonomy risks eroding the very properties that European law demands.
- Transparency – Reasoning steps are difficult to reconstruct: Traditional RAN algorithms are rule-based and auditable, making their logic transparent and reproducible. By contrast, modern AI models, especially deep learning and generative approaches, embed decision logic in complex weight matrices, where the precise reasoning steps cannot be reconstructed. Post-hoc explainability methods provide only approximations, not complete causal transparency. This creates tension with regulatory frameworks such as the EU AI Act, which requires technical documentation, traceability, and user-understandable logic for high-risk AI in critical infrastructure. The NIS2 Directive and GDPR Article 22 add further obligations for traceability and meaningful explanation of automated decisions. If operators cannot show why an AI system in the RAN made a given decision, compliance risks arise. The challenge is amplified with autonomous agents (i.e., Agentic AI), where decisions emerge from adaptive policies and interactions that are inherently non-deterministic. For critical infrastructure, such as telecom networks, transparency is therefore not optional but a regulatory necessity. Opaque models may face restrictions or outright bans.
- Explainability – Decisions must be understandable: Explainability means that operators and regulators can not only observe what a model decided, but also understand why. In RAN AI, this is challenging because deep models may optimize across multiple features simultaneously, making their outputs hard to interpret. The EU AI Act requires high-risk systems to provide explanations that are “appropriate to the intended audience,” meaning engineers must be able to trace technical logic. In contrast, regulators and end-users require more accessible reasoning. Without explainability, trust in AI-driven traffic steering, slicing, or energy optimization cannot be established. A lack of clarity risks regulatory rejection and reduces operator confidence in deploying advanced AI at scale.
- Auditability – Decisions must be verifiable: Auditability ensures that every AI-driven decision in the RAN can be logged, traced, and checked after the fact. Traditional rule-based schedulers are inherently auditable, but ML models, especially adaptive ones, require extensive logging frameworks to capture states, inputs, and outputs. The NIS2 Directive and the Cyber Resilience Act require such traceability for digital infrastructure, while the AI Act imposes additional obligations for record-keeping and post-market monitoring. Without audit trails, it becomes impossible to verify compliance or to investigate failures, outages, or discriminatory behaviors. In critical infrastructure, a lack of auditability is not just a technical gap but a regulatory showstopper, potentially leading to deployment bans.
- Human Oversight – The challenge of real-time intervention: Both the EU AI Act and the NIS2 Directive require that high-risk AI systems remain under meaningful human oversight, with the possibility to override or disable AI-initiated actions. In the context of O-RAN, this creates a unique tension. Many RIC-driven optimizations and DU/RU control loops operate at millisecond or even microsecond timescales, where thousands or millions of inferences occur daily. Expecting a human operator to monitor, let alone intervene in real time, is technically infeasible. Instead, oversight must be implemented through policy guardrails, monitoring dashboards, fallback modes, and automated escalation procedures. The challenge is to satisfy the regulatory demand for human control without undermining the efficiency gains that AI brings. If this balance cannot be struck, regulators may judge certain autonomous functions non-compliant, slowing or blocking their deployment in critical telecom infrastructure.
The upshot for telecom is clear. Even as generative and agentic AI move into SMO/Non-RT orchestration for intent translation or semantic compression, the time-scale fundamentals do not change. RT and sub-ms loops must remain deterministic, inspectable, and controllable, with human-governed, well-documented interfaces mediating any AI influence. The regulatory risk is therefore not hypothetical. It is structural. As generative AI and LLMs move closer to the orchestration and policy layers of O-RAN, their opacity and non-deterministic reasoning raise questions about compliance. While such models may provide valuable tools for intent interpretation or telemetry summarization, their integration into live networks will only be viable if accompanied by robust frameworks for explainability, monitoring, and assurance. This places a dual burden on operators and vendors: to innovate in AI-driven automation, but also to invest in governance structures that can withstand regulatory scrutiny.
In a European context, no AI model will likely be permitted in the RAN unless it can pass the tests of explainability, auditability, and human oversight that regulators will and also should demand of functionality residing in critical infrastructures.
WRAPPING UP.
The article charts an evolution from SON-era automation to today’s AI-RAN vision, showing how O-RAN institutionalized “openness + intelligence” through a layered control stack, SMO/NRT-RIC for policy and learning, RT-RIC for fast decisions, and CU/DU/RU for deterministic execution at millisecond to microsecond timescales. It argues that LLMs belong at the top (SMO/NRT-RIC) for intent translation and semantic compression, while lightweight supervised/RL/TinyML models run the real-time loops below. “ChatGPT-like” systems (i.e., founded on human-generated context) are ill-suited to near-RT and sub-ms control. Synthetic data can stress-test rare events, but it demands statistics that are aware of extremes and validation against real holdouts to avoid misleading inference. Many low-level PHY/MAC primitives (HARQ, coding/decoding, CRC, MMSE precoding, and SINR-based link adaptation) are generally close to optimal, so AI/ML’s gains in these areas may be marginal and, at least initially, not the place to focus on.
Most importantly, pushing agentic autonomy too deep into the stack is likely to collide with both physics and law. Without reversibility, logging, and explainability, deployments risk breaching the EU AI Act’s requirements for human oversight, transparency, and lifecycle accountability. The practical stance is clear. Keep RT-RIC and DU/RU loops deterministic and inspectable, confine agency to SMO/NRT-RIC under strong policy guardrails and observability, and pair innovation with governance that can withstand regulatory scrutiny.
- AI in RAN is evolutionary, not revolutionary, from SON and Elastic RAN-style coordination to GPU-accelerated AI-RAN and the 2024 AI-RAN Alliance.
- O-RAN’s design incorporates AI via a hierarchical approach: SMO (governance/intent), NRT-RIC (training/policy), RT-RIC (near-real-time decisions), CU (shaping/QoS/UX, etc.), and DU/RU (deterministic PHY/MAC).
- LLMs are well-suited for SMO/NRT-RIC for intent translation and semantic compression; however, they are ill-suited for RT-RIC or DU/RU, where millisecond–to–microsecond determinism is mandatory.
- Lightweight supervised/RL/TinyML models, not “ChatGPT-like” systems, are the practical engines for near-real-time and real-time control loops.
- Synthetic data for rare events, generated in the NRT-RIC and SMO, is valid but carries some risk. Approaches must be validated against real holdouts and statistics that account for extremes to avoid misleading inference.
- Many low-level PHY/MAC primitives (HARQ, coding/decoding, CRC, classical precoding/MMSE, SINR-based link adaptation) are already near-optimal. AI may only add marginal gains at the edge.
- Regulatory risk: Deep agentic autonomy without reversibility threatens EU AI Act Article 14 (human oversight). Operators must be able to intervene/override, which, to an extent, may defeat the more aggressive pursuits of autonomous network operations.
- Regulatory risk: Opaque/unanalyzable models undermine transparency and record-keeping duties (Articles 12–13), especially if millions of inferences lack traceable logs and rationale.
- Regulatory risk: For systems affecting individuals or critical services, explainability obligations (including GDPR Article 22 context) and AI Act lifecycle controls (Articles 8–17) require audit trails, documentation, and post-market monitoring, as well as curtailment of non-compliant agentic behavior risks.
- Practical compliance stance: It may make sense to keep RT-RIC and DU/RU loops deterministic and inspectable, and constrain agency to SMO/NRT-RIC with strong policy guardrails, observability, and fallback modes.
ABBREVIATION LIST.
- 3GPP – 3rd Generation Partnership Project.
- A1 – O-RAN Interface between Non-RT RIC and RT-RIC.
- AAS – Active Antenna Systems.
- AISG – Antenna Interface Standards Group.
- AI – Artificial Intelligence.
- AI-RAN – Artificial Intelligence for Radio Access Networks.
- AI-Native RAN – Radio Access Network with AI embedded into architecture, protocols, and control loops.
- ASIC – Application-Specific Integrated Circuit.
- CapEx – Capital Expenditure.
- CPU – Central Processing Unit.
- C-RAN – Cloud Radio Access Network.
- CRC – Cyclic Redundancy Check.
- CU – Centralized Unit.
- DU – Distributed Unit.
- E2 – O-RAN Interface between RT-RIC and CU/DU.
- eCPRI – Enhanced Common Public Radio Interface.
- EU – European Union.
- FCAPS – Fault, Configuration, Accounting, Performance, Security.
- FPGA – Field-Programmable Gate Array.
- F1 – 3GPP-defined interface split between CU and DU.
- GDPR – General Data Protection Regulation.
- GPU – Graphics Processing Unit.
- GRU – Gated Recurrent Unit.
- HARQ – Hybrid Automatic Repeat Request.
- KPI – Key Performance Indicator.
- L1/L2 – Layer 1 / Layer 2 (in the OSI stack, PHY and MAC).
- LLM – Large Language Model.
- LSTM – Long Short-Term Memory.
- MAC – Medium Access Control.
- MANO – Management and Orchestration.
- MIMO – Multiple Input, Multiple Output.
- ML – Machine Learning.
- MMSE – Minimum Mean Square Error.
- NFVI – Network Functions Virtualization Infrastructure.
- NIS2 – EU Directive on measures for a high standard level of cybersecurity across the Union.
- NPU – Neural Processing Unit.
- NRT-RIC – Non-Real-Time RAN Intelligent Controller.
- O1 – O-RAN Operations and Management Interface to network elements.
- O2 – O-RAN Interface to cloud infrastructure (NFVI and MANO).
- O-RAN – Open Radio Access Network.
- OpEx – Operating Expenditure.
- PDCP – Packet Data Convergence Protocol.
- PHY – Physical Layer.
- QoS – Quality of Service.
- RAN – Radio Access Network.
- rApp – Non-Real-Time RIC Application.
- RET – Remote Electrical Tilt.
- RIC – RAN Intelligent Controller.
- RLC – Radio Link Control.
- R-NIB – Radio Network Information Base.
- RT-RIC – Real-Time RAN Intelligent Controller.
- RU – Radio Unit.
- SDAP – Service Data Adaptation Protocol.
- SINR – Signal-to-Interference-plus-Noise Ratio.
- SmartNIC – Smart Network Interface Card.
- SMO – Service Management and Orchestration.
- SON – Self-Organizing Network.
- T-Labs – Deutsche Telekom Laboratories.
- TTI – Transmission Time Interval.
- UE – User Equipment.
- US – United States.
- WG2 – O-RAN Working Group 2 (Non-RT RIC & A1 interface).
- WG3 – O-RAN Working Group 3 (RT-RIC & E2 Interface).
- xApp – Real-Time RIC Application.
ACKNOWLEDGEMENT.
I want to acknowledge my wife, Eva Varadi, for her unwavering support, patience, and understanding throughout the creative process of writing this article.
FOLLOW-UP READING.
- Kim Kyllesbech Larsen (May 2023), “Conversing with the Future: An interview with an AI … Thoughts on our reliance on and trust in generative AI.” An introduction to generative models and large language models.
- Goodfellow, I., Bengio, Y., Courville, A. (2016), Deep Learning (Adaptive Computation and Machine Learning series). The MIT Press. Kindle Edition.
- Collins, S. T., & Callahan, C. W. (2009). Cultural differences in systems engineering: What they are, what they aren’t, and how to measure them. 19th Annual International Symposium of the International Council on Systems Engineering, INCOSE 2009, 2.
- Herzog, J. (2015). Software Architecture in Practice, Third Edition, Written by Len Bass, Paul Clements, and Rick Kazman. ACM SIGSOFT Software Engineering Notes, 40(1).
- O-RAN Alliance (October 2018). “O-RAN: Towards an Open and Smart RAN“.
- TS 103 982 – V8.0.0. (2024) – Publicly Available Specification (PAS); O-RAN Architecture Description (O-RAN.WG1.OAD-R003-v08.00).
- Lee, H., Cha, J., Kwon, D., Jeong, M., & Park, I. (2020, December 1). “Hosting AI/ML Workflows on O-RAN RIC Platform”. 2020 IEEE Globecom Workshops, GC Wkshps 2020 – Proceedings.
- TS 103 983 – V3.1.0. (2024)- Publicly Available Specification (PAS); A1 interface: General Aspects and Principles (O-RAN.WG2.A1GAP-R003-v03.01).
- TS 104 038 – V4.1.0. (2024) – Publicly Available Specification (PAS); E2 interface: General Aspects and Principles (O-RAN.WG3.E2GAP-R003-v04.01).
- TS 104 039 – V4.0.0. (2024) – Publicly Available Specification (PAS); E2 interface: Application Protocol (O-RAN.WG3.E2AP-R003-v04.00).
- TS 104 040 – V4.0.0. (2024) – Publicly Available Specification (PAS); E2 interface: Service Model (O-RAN.WG3.E2SM-R003-v04.00).
- O-RAN Work Group 3. (2025). Near-Real-time RAN Intelligent Controller E2 Service Model (E2SM) KPM Technical Specification.
- Bao, L., Yun, S., Lee, J., & Quek, T. Q. S. (2025). LLM-hRIC: LLM-empowered Hierarchical RAN Intelligent Control for O-RAN.
- Tang, Y., Srinivasan, U. C., Scott, B. J., Umealor, O., Kevogo, D., & Guo, W. (2025). End-to-End Edge AI Service Provisioning Framework in 6G ORAN.
- Gajjar, P., & Shah, V. K. (n.d.). ORANSight-2.0: Foundational LLMs for O-RAN.
- Elkael, M., D’Oro, S., Bonati, L., Polese, M., Lee, Y., Furueda, K., & Melodia, T. (2025). AgentRAN: An Agentic AI Architecture for Autonomous Control of Open 6G Networks.
- Gu, J., Zhang, X., & Wang, G. (2025). Beyond the Norm: A Survey of Synthetic Data Generation for Rare Events.
- Michael Peel (July 2024), The problem of ‘model collapse’: how a lack of human data limits AI progress, Financial Times.
- Decruyenaere, A., Dehaene, H., Rabaey, P., Polet, C., Decruyenaere, J., Demeester, T., & Vansteelandt, S. (2025). Debiasing Synthetic Data Generated by Deep Generative Models.
- Decruyenaere, A., Dehaene, H., Rabaey, P., Polet, C., Decruyenaere, J., Vansteelandt, S., & Demeester, T. (2024). The Real Deal Behind the Artificial Appeal: Inferential Utility of Tabular Synthetic Data.
- Vishwakarma, R., Modi, S. D., & Seshagiri, V. (2025). Statistical Guarantees in Synthetic Data through Conformal Adversarial Generation.
- Banbury, C. R., Reddi, V. J., Lam, M., Fu, W., Fazel, A., Holleman, J., Huang, X., Hurtado, R., Kanter, D., Lokhmotov, A., Patterson, D., Pau, D., Seo, J., Sieracki, J., Thakker, U., Verhelst, M., & Yadav, P. (2021). Benchmarking TinyML Systems: Challenges and Direction.
- Capogrosso, L., Cunico, F., Cheng, D. S., Fummi, F., & Cristani, M. (2023). A Machine Learning-oriented Survey on Tiny Machine Learning.
- Hubara, I., Courbariaux, M., Soudry, D., El-Yaniv, R., & Bengio, Y. (2016). Quantized Neural Networks: Training Neural Networks with Low Precision Weights and Activations.
- AI Act. The AI Act is the first-ever comprehensive legal framework on AI, addressing the risks associated with AI, and is alleged to position Europe to play a leading role globally (as claimed by the European Commission).
- The EU Artificial Intelligence Act. For matters related explicitly to Critical Infrastructure, see in particular Annex III: High-Risk AI Systems Referred to in Article 6(2), Recital 55 and Article 6: Classification Rules for High-Risk AI Systems. I also recommend taking a look at “Article 14: Human Oversight”.
- European Commission (January 2020), “Cybersecurity of 5G networks – EU Toolbox of risk mitigating measures”.
- European Commission (June 2023), “Commission announces next steps on cybersecurity of 5G networks in complement to latest progress report by Member States”.
- European Commission, “NIS2 Directive: securing network and information systems”.
- Council of Europe (October 2024), “Cyber resilience act: Council adopts new law on security requirements for digital products.”.
- GDPR Article 22, “Automated individual decision-making, including profiling”. See also the following article from Crowell & Moring LLP: “Europe’s Highest Court Compels Disclosure of Automated Decision-Making “Procedures and Principles” In Data Access Request Case”.


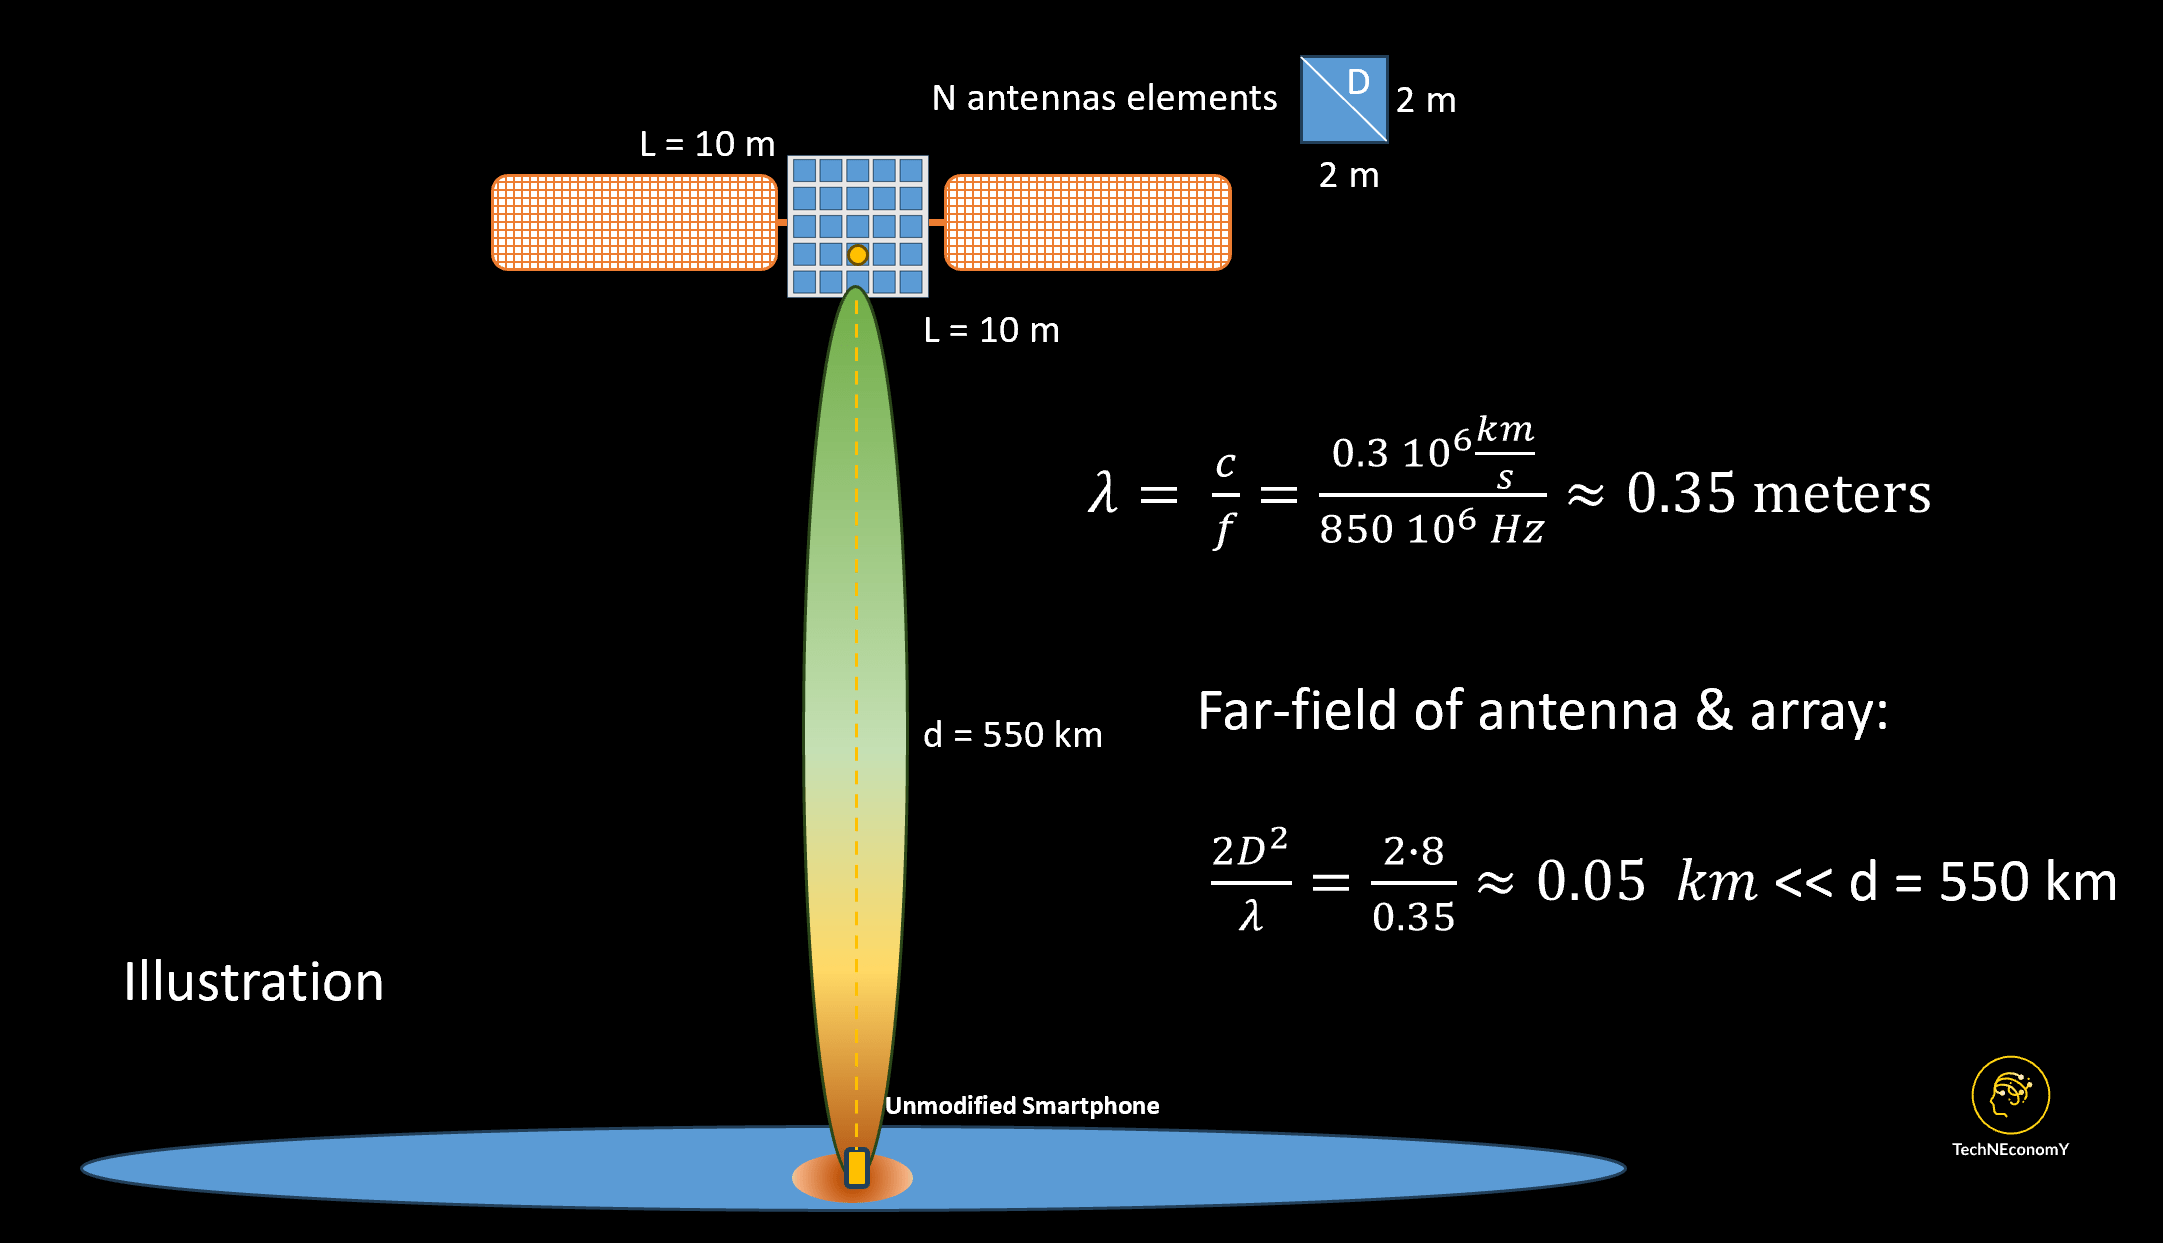


 and
and 


![CV_X \; - \; CV_Y \; = \; \Delta Capex \; \left[ \frac{1 \; - \; g}{\; WACC \; - \; g \;} \right]](https://s0.wp.com/latex.php?latex=CV_X+%5C%3B+-+%5C%3B+CV_Y+%5C%3B+%3D+%5C%3B+%5CDelta+Capex+%5C%3B+%5Cleft%5B+%5Cfrac%7B1+%5C%3B+-+%5C%3B+g%7D%7B%5C%3B+WACC+%5C%3B+-+%5C%3B+g+%5C%3B%7D+%5Cright%5D&bg=ffffff&fg=333333&s=0&c=20201002)


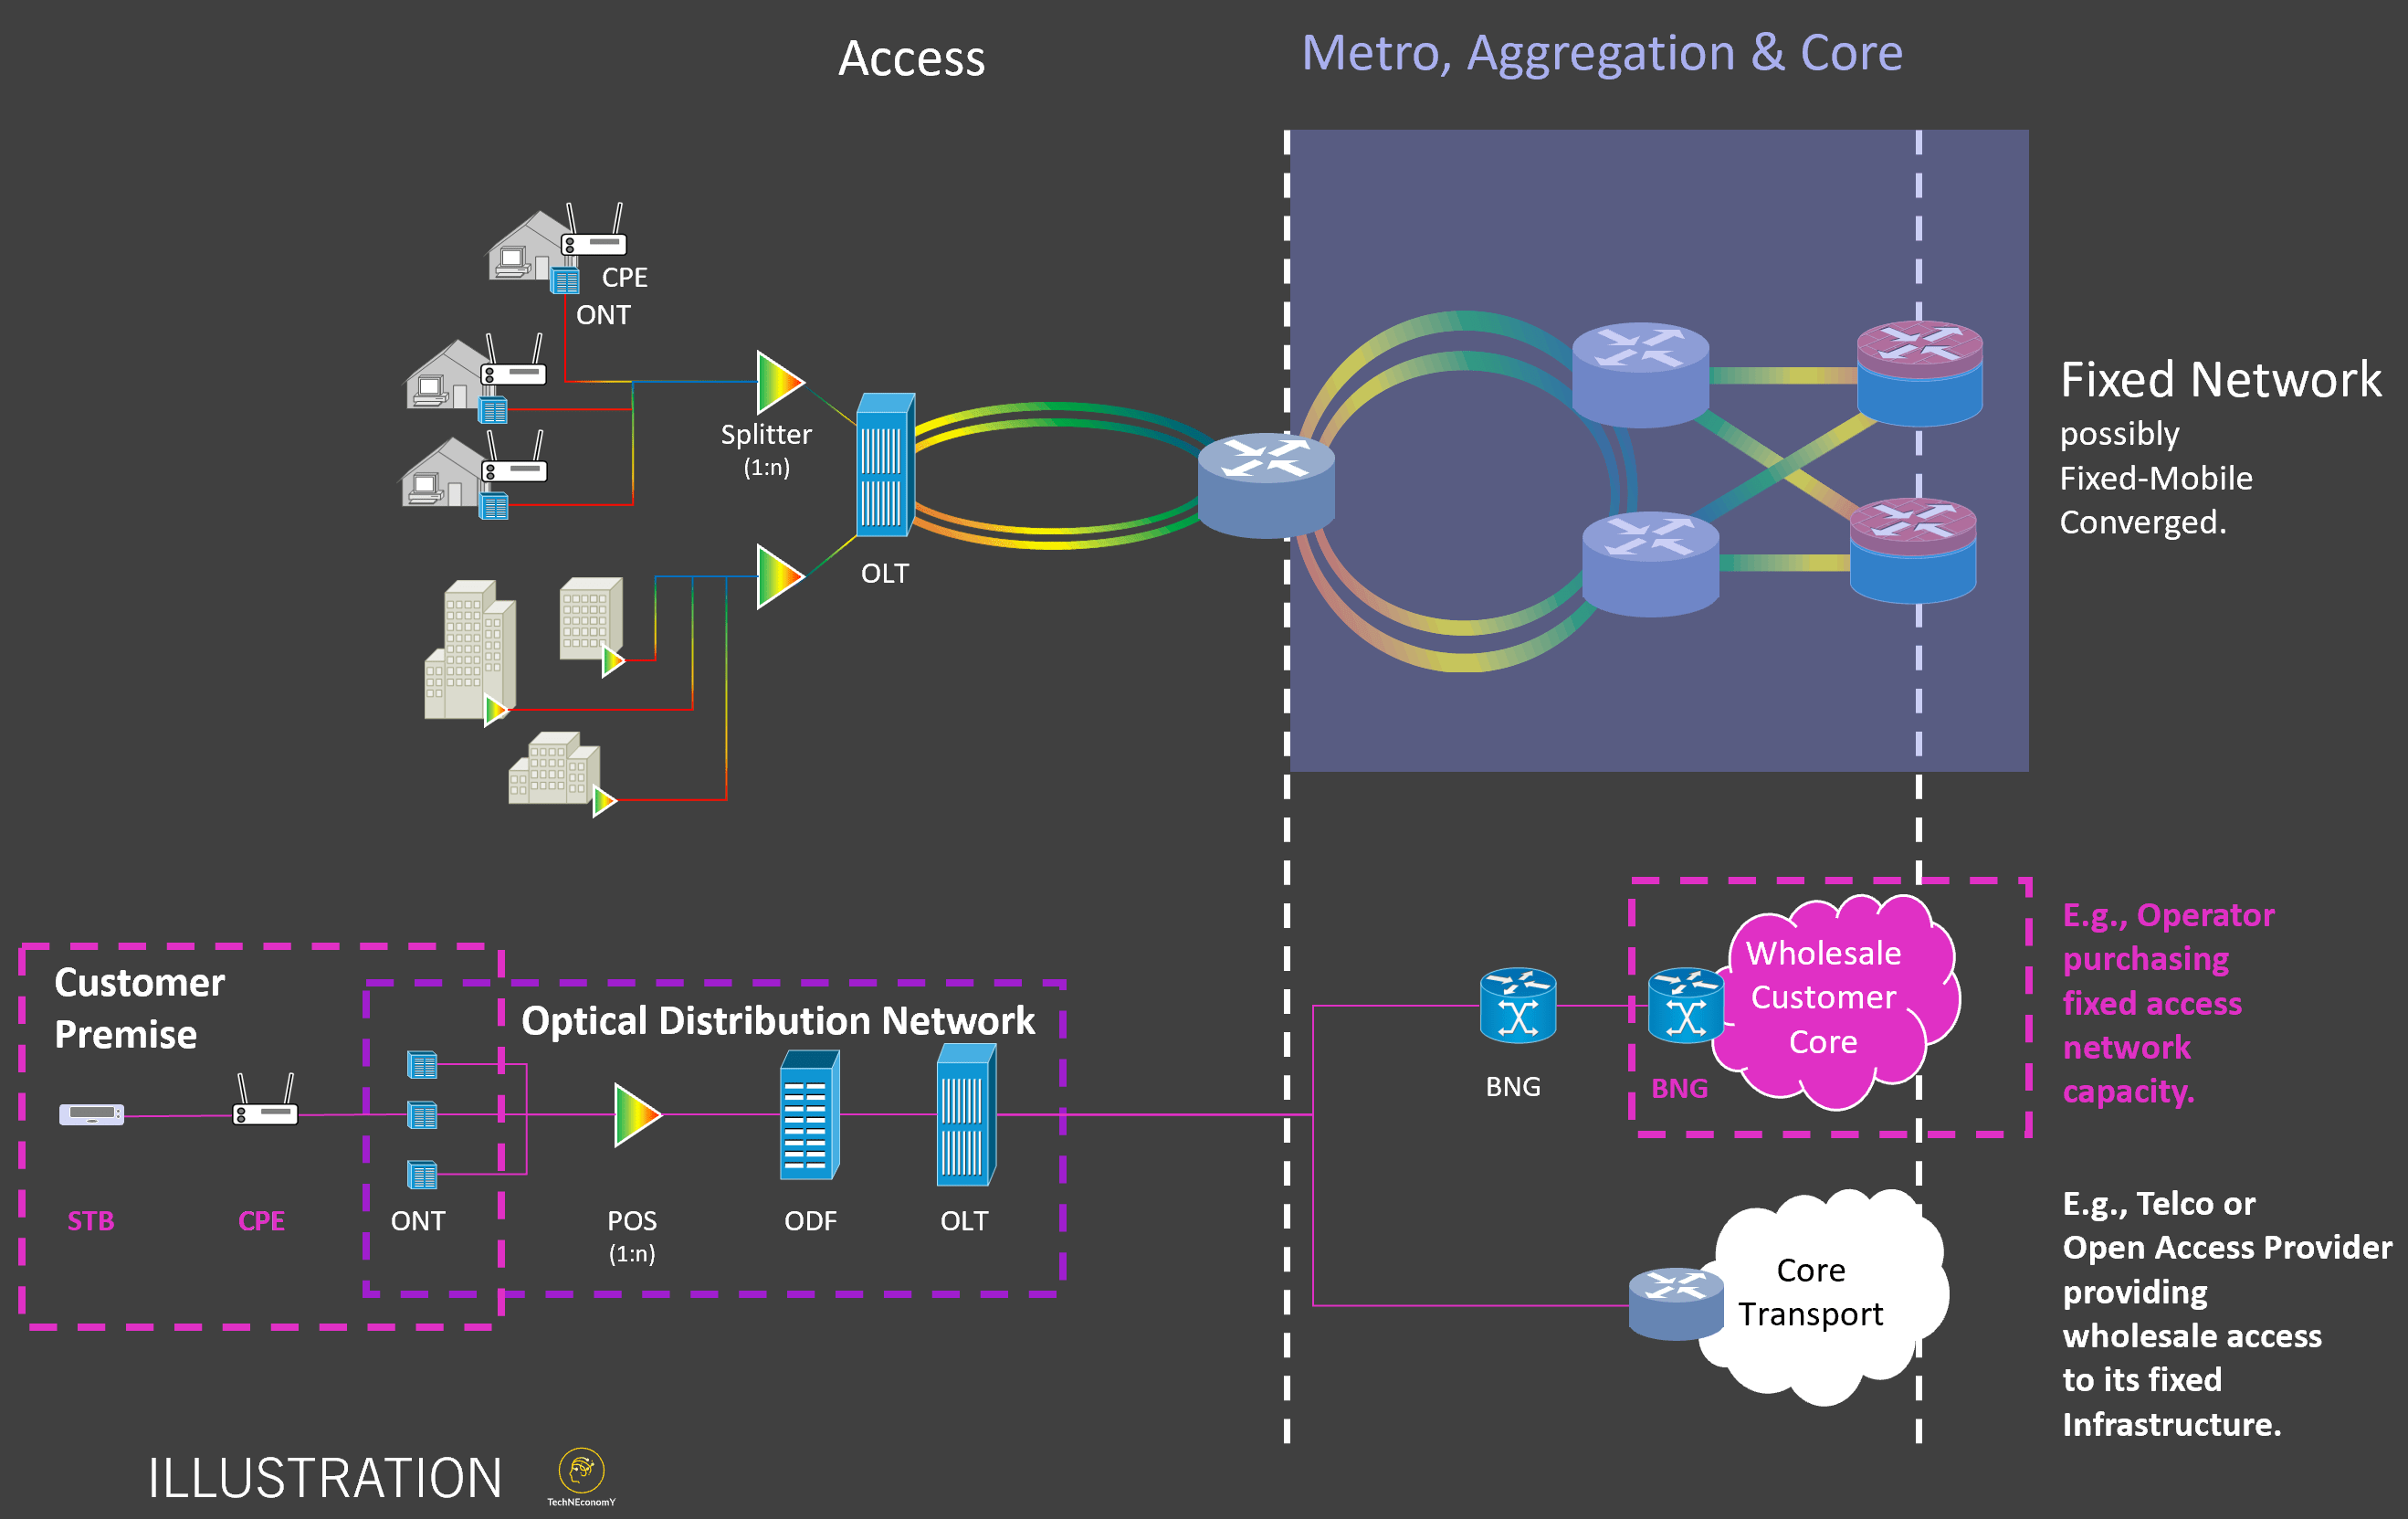


 or
or  ) is the direct driver of network load, and thus, network investments, the volumetric demand, is a manifestation of that throughput demand.
 being the number of active users in a given radio cell at the time-instant of unit t taken within a day.
  is the Bytes consumed in a time instant (e.g., typically a second); thus, 8
  bits/sec) in the same instant and take the maximum across. For example, a day provides the busiest hour throughput for the whole network. Each radio cell drives its capacity provision and supply (in bits/sec) and the investments required to provide that demanded capacity in the air interface and front- and back-haul.
 ) given in bits per second, the basic building block of quality, is relatively easy to estimate. The cellular throughput (per unit cell) is provided by the amount of committed frequency spectrum to the air interface, what your radio access network and antenna support are, multiplied by the so-called spectral efficiency in bits per Hz per cell. The spectral efficiency depends on the antenna technology and the underlying software implementation of signal processing schemes enabling the details of receiving and sending signals over the air interface.
 of ca. 20 Mbps/MHz/cell (i.e.,
  ), we should expect to have a cell throughput on average at 1,000 Mbps (1 Gbps).


