Cold winds cut like knives, Mountains rise in solitude, Life persists in ice. (Aqqaluk Lynge, “Harsh Embrace” ).
I have been designing, planning, building, and operating telecommunications networks across diverse environmental conditions, ranging from varied geographies to extreme climates. I sort of told myself that I most likely had seen it all. However (and luckily), the more I consider the complexities involved in establishing robust and highly reliable communication networks in Greenland, the more I realize the uniqueness and often extreme challenges involved with building & maintaining communications infrastructures there. The Greenlandic telecommunications incumbent Tusass has successfully built a resilient and dependable transport network that connects nearly every settlement in Greenland, no matter how small. They manage and maintain this network amidst some of the most severe environmental conditions on the planet. The staff of Tusass is fully committed to ensuring connectivity for these remote communities, recognizing that any service disruption can have severe repercussions for those living there.
As an independent board member of Tusass Greenland since 2022, I have witnessed Tusass’s dedication, passion, and understanding of the importance of improving and maintaining their network and connections for the well-being of all Greenlandic communities. To be clear, the opinions I express in this post are solely my own and do not necessarily reflect the views or opinions of Tusass. I believe that my opinions have been shaped by my Tusass and Greenlandic experience, by working closely with Tusass as an independent board member, and by a deep respect for Tusass and its employees. All information that I am using in this post is publicly available through annual reports (of Tusass) or, in general, publicly available on the internet.

Greenland’s strategic location, its natural resources, environmental significance, and broader geopolitical context make it geopolitically a critical country. Thus, protecting and investing in Greenland’s critical infrastructure is obviously important. Not only from a national and geopolitical security perspective but also with respect to the economic development and stability of Greenland and the Arctic region. If a butterfly’s movements can cause a hurricane, imagine what an angry “polar bear” will do to the global weather and climate. The melting ice caps are enabling new shipping routes and making natural resources much more accessible, and they may also raise the stakes for regional security. For example, with China’s Polar Silk Road initiative where, China seeks to establish (or at least claim) a foothold in the Arctic in order to increase its trade routes and access to resources. This is also reflected in their 2018 declaration stating that China sees itself as a “Near-Arctic State” and concludes that China is one of the continental states that are closest to the Arctic Circle. Russia, which is a real neighboring country to the Arctic region and Circle, has also increased its military presence and economic activities in the Arctic. Recently, Russia has made claims in the Arctic to areas that overlap with what Denmark and Canada see as their natural territories, aiming to secure its northern borders and exploit the region’s resources. Russia has also added new military bases and has conducted large-scale maneuvers along its own Arctic coastline. The potential threats from increased Russian and Chinese Arctic activities pose significant security concerns. Identifying and articulating possible threat scenarios to the Arctic region involving potential hostile actors may indeed justify extraordinary measures and also highlight the need for urgent and substantial investments in and attention to Greenland’s critical infrastructure.
In this article, I focus very much on what key technologies should be considered, why specific technologies should be considered, and how those technologies could be implemented in a larger overarching security and defense architecture driving towards enhancing the safety and security of Greenland:
- Leapfrog Quality of Critical Infrastructure: Strengthening the existing critical communications infrastructure should be a priority. With Tusass, this is the case in terms of increasing the existing transport network’s reliability and availability by adding new submarine cables and satellite backbone services and the associated satellite infrastructure. However, the backbone of the Tusass economy is a population of 57 thousand. The investments required to quantum leap the robustness of the existing critical infrastructure, as well as deploying many of the technologies discussed in this post, will not have a positive business case or a reasonable return on investment within a short period (e.g., a couple of years) if approached in the way that is the standard practice for most private corporations around the worlds. External subsidies will be required. The benefit evaluation would need to be considered over the long term, more in line with big public infrastructure projects. Most of these critical infrastructure and technology investments discussed are based on particular geopolitical assumptions and serve as risk-mitigating measures with substantial civil upside if we maintain a dual-use philosophy as a boundary condition for those investments. Overall I believe that a positive case might be made from the perspective of the possible loss of not making them rather than a typical gain or growth case expected if an investment is made.
- Smart Infrastructure Development: Focus on building smart infrastructure, integrating sensor networks (e.g., DAS on submarine cables), and AI-driven automation for critical systems like communication networks, transportation, and energy management to improve resilience and operational efficiency. As discussed in this post, Tusass already has a strong communications network that should underpin any work on enhancing the Greenlandic defense architecture. Moreover, Tusass are experts in building and operating critical communications infrastructures in the Arctic. This is critical know-how that should be heavily relied upon in what has to come.
- Automated Surveillance and Monitoring Systems: Invest in advanced automated surveillance technologies, such as aquatic and aerial drones, satellite-based monitoring (SIGINT and IMINT), and IoT sensors, to enhance real-time monitoring and protection of Greenland.
- Autonomous Defense Systems: Deploy autonomous systems, including unmanned aerial vehicles (UAVs) and unmanned underwater vehicles (UUVs), to strengthen defense capabilities and ensure rapid response to potential threats in the Arctic region. These systems should be the backbone of ad-hoc private network deployments serving both defense and civilian use cases.
- Cybersecurity and AI Integration: Implement robust cybersecurity measures and integrate artificial intelligence to protect critical infrastructure and ensure secure, reliable communication networks supporting both military and civilian applications in Greenland.
- Dual-Use Infrastructure: Prioritize investments in infrastructure solutions that can serve both military and civilian purposes, such as communication networks and transportation facilities, to maximize benefits and resilience.
- Local Economic and Social Benefits: Ensure that defense investments support local economic development by creating new job opportunities and improving essential services in Greenland.
I believe that Greenland needs to build a solid Greenlandic-centered know-how on a foundational level around autonomous and automated systems. In order to get there Greenland will need close and strong alliances that is aligned with the aim of achieving a greater degree of independence through clever use of the latest technologies available. Such local expertise will be essential in order to reduce the dependency on external support (e.g., from Denmark and Allies) and ensure that they can maintain operational capabilities independently, particularly during a security crisis. Automation, enabled by digitization and AI-enabled system architectures, would be key to managing and monitoring Greenland’s remote and inaccessible geography and resources efficiently and securely, minimizing the need for extensive human intervention. Leveraging autonomous defense and surveillance technologies and stepping up in digital maturity is an important path to compensating for Greenland’s small population. Additionally, implementing robust, with respect to hardware AND software, automated systems will allow Greenland to protect and maintain its critical infrastructure and services, mitigating the risks associated with (too much) reliance on Denmark or allies during a time of crisis where such resources may be scarce or impractical to timely move to Greenland.

GREENLAND – A CONCISE INTRODUCTION.
Greenland, or Kalaallit Nunaat as it is called in Greenlandic, has a surface area of about 2.2 million square kilometers with ca. 80% covered by ice and is the world’s largest island. It is an autonomous territory of Denmark with a population of approximately 57 thousand. Its surface area is comparable to that of Alaska (1.7 million km2) or Saudi Arabia (2.2 million km2). It is predominantly covered by ice, with a population scattered in smaller settlements along the western coastlines where the climate is milder and more hospitable. Greenland’s extensive coastline measures ca. 44 thousand kilometers and is one of the most remote and sparsely populated coastlines in the world. This remoteness contrasts with more densely populated and developed coastlines like the United States. The remoteness of Greenland’s coastline is further emphasized by a lack of civil infrastructure. There are no connecting roads between settlements, and most (if not all) travel between communities relies on maritime or air transport.
Greenland’s coastline presents several unique security challenges due to its particularities, such as its vast length, rugged terrain, harsh climate, and limited population. These factors make Greenland challenging to monitor and protect effectively, which is critical for several reasons:
- The vast and inaccessible terrain.
- Harsh climate and weather conditions.
- Sparse population and limited infrastructure.
- Maritime and resource security challenges.
- Communications technology challenges.
- Geopolitical significance.
The capital and largest city is Nuuk, located on the southwestern coast. With a population of approximately 18+ thousand or 30+% of the total, Nuuk is Greenland’s administrative and economic center, offering modern amenities and serving as the hub for the island’s limited transportation network. Sisimiut, north of Nuuk on the western coast. It is the second-largest town in Greenland, with a population of around 5,500+. Sisimiut is known for its fishing industry and serves as a base for much of the Greenlandic tourism and outdoor activities.
On the remote and inhospitable eastern coast, Tasiilaq is the largest town in the Ammassalik area, with a population of little less than 2,000. It is relatively isolated compared to the western settlements and is known for its breathtaking natural scenery and opportunities for adventure tourism (check out https://visitgreenland.com/ for much more information). In the far north, on the west coast, we have Qaanaaq (also known as Thule), which is one of the world’s most northern towns, with a population of ca. 600. Located near Qaanaaq, is the so-called Pituffik Space Base which is the United States’ northernmost military base, established in 1951, and a key component of NATO’s early warning and missile defense systems. The USA have had a military presence in Greenland since the early days of the World War II and strengthened during the Cold War. It also plays an important role in monitoring Arctic airspace and supporting the region’s avionics operations.
As of 2023, Greenland has approximately 56 inhabited settlements. I am using the word “settlement” as an all-inclusive covering communities with a population of 10s of thousands (Nuuk) down to 100s or lower. With few exceptions, there are no settlements with connecting roads or any other overland transportation connections with other settlements. All person- and goods transportation between the different settlements is taken by plane or helicopter (provided by Air Greenland) or seaborne transportation (e.g., Royal Artic Line, RAL).
Greenland is rich in natural resources. Apart from water (for hydropower), this includes significant mining, oil, and gas reserves. These natural resources are largely untapped and present substantial opportunities for economic development (and temptation for friendly as well as unfriendly actors). Greenland is believed to have one of the world’s largest deposits of rare earth elements (although by far not comparable to China), extremely valuable as an alternative to the reliance of China and critical for various high-tech applications, including electronics (e.g., your smartphone), renewable energy technologies (e.g., wind turbines and EVs), and defense systems. Graphite and platinum are also present in Greenland and are important in many industrial processes. Some estimates indicate that northeast Greenland’s waters could hold large reserves of (yet) undiscovered oil and gas reserves. Other areas are likewise believed to contain substantial hydrocarbon reserves. However, Greenland’s arctic environment presents severe exploration and extraction challenges, such as extreme cold, ice cover, and remoteness, that so far has made it also very costly and complicated to extraxt its natural resources. With the global warming the economical and practical barrier for exploitation is contineously reducing.
FROM STRATEGIC OUTPOST TO ARCTIC STRONGHOLD: THE EVOLVING SECURITY SIGNIFICANCE OF GREENLAND.

From a security perspective Greenland has evolved significantly since the Second World War. During World War II, its importance was primarily based on its location as a midway point between North America and Europe serving as a refueling and weather station for allied aircrafts crossing the Atlantic to and from Europe. Additionally, its remote geographical location combined with its harsh climate provided a “safe haven” for monitoring and early warning installations.
During the Cold War era, Greenland’s importance grew (again) due to its proximity to the Soviet Union (and Russia today). Greenland became a key site for early warning radar systems and an integral part of the North American Aerospace Defense Command (NORAD) network designed to detect Soviet bombers and missiles heading toward North America. In 1951, the USA-controlled Thule Air Base, today it is called Pituffik Space Base, located in northwest Greenland, was constructed with the purpose of hosting long-range bombers and providing an advanced point (from a USA perspective) for early warning and missile defense systems.
As global tensions eased in the post-Cold War period, Greenland’s strategic status diminished somewhat. However, its status is now changing again due to Russia’s increased aggression in Europe (and geopolitically) and a more assertive China with expressed interest in the Arctic. The arctic ice is melting due to climate change and has resulted in new maritime routes being possible, such as the Northern Sea Route. Also, making Arctic resources more accessible. Thus, we now observe an increased interest from global powers in the Arctic region. And as was the case during the cold-War period (maybe with much higher stakes), Greenland has become strategically critical for monitoring and controlling these emerging routes, and the Arctic in general. Particularly with the observed increased activity and interest from Russia and China.
Greenland’s position in the North Atlantic, bridging the gap between North America and Europe, has become a crucial spot for monitoring and controlling the transatlantic routes. Greenland is part of the so-called Greenland-Iceland-UK (GIUK) Gap. This gap is a critical “chokepoint” for controlling naval and submarine operations, as was evident during the Second World War (e.g., read up on the Battle of the Atlantic). Controlling the Gap increases the security of maritime and air traffic between the continents. Thus, Greenland has again become a key component in defense strategies and threat scenarios envisioned and studied by NATO (and the USA).
GREENLANDS GEOPOLITICAL ROLE.
Greenland’s recent significance in the Arctic should not be underestimated. It arises, in particular, from climate change and, as a result, melting ice caps that have and will enable new shipping routes and potential (easier) access to Greenland’s untapped natural resources.
Greenland hosts critical military and surveillance assets, including early warning radar installations as well as air & naval bases. These defense assets actively contributes to global security and is integral to NATO’s missile defense and early warning systems. They provide data for monitoring potential missile threats and other aerial activities in the North Atlantic and Arctic regions. Greenland’s air and naval bases also support specialized military operations, providing logistical hubs for allied forces operating in the Arctic and North Atlantic.
From a security perspective, Greenland’s control is not only about monitoring and defense. It is also about deterring potential threats from potential hostile actors. It allows for effective monitoring and defense of the Arctic and North Atlantic regions. Enabling the detection and tracking of submarines, ships, and aircraft. Such capabilities enhance situational awareness and operational readiness, but more importantly, it sends a message to potential adversaries (e.g., maybe unaware, as unlikely as it may be, about the deficiencies of Danish Arctic patrol ships). The ability to project power and maintain a military presence in this area is necessary for deterring potential adversaries and protecting he critical communications infrastructure (e.g., submarine cables), maritime routes, and airspace.
The strategic location of Greenland is key to contribute to the global security dynamics. Ensuring Greenland’s security and stability is essential for also maintaining control over critical transatlantic routes, monitoring Arctic activities, and protecting against potential threats from hostile actors. Making Greenland a cornerstone of the defense infrastructure and an essential area for geopolitical strategy in the North Atlantic and Arctic regions.
INFRASTRUCTURE RECOMMENDATIONS.
Recent research has focused on Greenland in the context of Arctic security (see “Greenland in Arctic Security: (De)securitization Dynamics under Climatic Thaw and Geopolitical Freeze” by M. Jacobsen et al.). The work emphasizes the importance of maintaining and enhancing surveillance and early warning systems. Greenland is advised to invest in advanced radar systems and satellite monitoring capabilities. These systems are relevant for detecting potential threats and providing timely information, ensuring national and regional security. I should point to the following traditional academic use of the word “securitization,” particularly from the Copenhagen School, which refers to framing an issue as an existential threat requiring extraordinary measures. Thus, securitization is the process by which topics are framed as matters of security that should be addressed with urgency and exeptional measures.
The research work furthermore underscores the Greenlandic need for additional strategic infrastructure development, such as enhancing or building new airport facilities and the associated infrastructure. This would for example include expanding and upgrading existing airports to improve connectivity within Greenland and with external partners (e.g., as is happening with the new airport in Nuuk). Such developments would also support economic activities, emergency response, and defense operations. Thus, it combines civic and military applications in what could be defined as dual-purpose infrastructure programs.
The above-mentioned research argues for the need to develop advanced communication systems, Signals Intelligence (SIGINT), and Image Intelligence (IMINT) gathering technologies based on satellite- and aerial-based platforms. These wide-area coverage platforms are critical to Greenland due to its vast and remote areas, where traditional communication networks may be insufficient or impractical. Satellite communication systems such as GEO, MEO, and LEO (and combinations thereof), and stratospheric high-altitude platform systems (HAPS) are relevant for maintaining robust surveillance, facilitating rapid emergency response, and ensuring effective coordination of security as well as search & rescue operations.
Expanding broadband internet access across Greenland is also a key recommendation (that is already in progress today). This involves improving the availability and reliability of communications-related connectivity by additional submarine cables and by new satellite internet services, ensuring that even the most remote communities have reliable broadband internet connectivity. All communities need to have access to broadband internet, be connected, enable economic development, improve quality of life in general, and integrate remote areas into the national and global networks. These communication infrastructure improvements are important for civilian and military purposes, ensuring that Greenland can effectively manage its security challenges and leverage new economic opportunities for its communities. It is my personal opinion that most communities or settlements are connected to the wider internet, and the priority should be to improve the redundancy, availability, and reliability of the existing critical communications infrastructure. With that also comes more quality in the form of higher internet speeds.
The applicability of at least some of the specific securitization recommendations for Greenland, as outlined in Marc Jacobsen’s “Greenland in Arctic Security: (De)securitization Dynamics Under Climatic Thaw and Geopolitical Freeze,” may be somewhat impractical given the unique characteristics of Greenland with its vast area and very small population. Quite a few recommendations (in my opinion), even if in place “today or tomorrow,” would require a critical scale of expertise, human, and industrial capital that Greenland does not have available on its own (and also is unlikely to have in the future). Thus, some of the recommendations depend on such resources to be delivered from outside Greenland, posing inherent availability risks to provide in a crisis (assuming that such capacity would even be available under normal circumstances). This dependency on external actors, particularly Danish and International investors, complicates Greenland’s ability to independently implement policies recommended by the securitization framework. It could lead to conflicts between local priorities and the interests of external stakeholders, particularly in a time of a clear and present security crisis (e.g., Russia attempting to expand west above and beyond Ukraine).
Also, as a result of Greenland’s small population there will be a limited pool of available local personnel with the needed skills to draw upon for implementing and maintaining many of the recommendations in “Greenland in Arctic Security: (De)securitization Dynamics under Climatic Thaw and Geopolitical Freeze”. Training and deploying enough high-tech skilled individuals to cover Greenland’s vast territory and technology needs is a very complex challenge given the limited human resources and challenges in getting external high-tech resouces to Greenland.
I believe Greenland should focus on establishing a comprehensive security strategy that minimizes its dependency on its natural allies and external actors in general. The dual-use approach should be integral to such a security strategy, where technology investments serve civil and defense purposes whenever possible. This approach ensures that Greenlandic society benefits directly from investments in building a robust security framework. I will come back to the various technologies that may be relevant in achieving more independence and less reliance on the external actors that are so prevalent in Greenland today.
HOW CRITICAL IS CRITICAL INFRASTRUCTURE TO GREENLAND
Communications infrastructure is seen as critical in Greenland. It has to provide a reliable and good quality service despite Greenland having some of the most unfavorable environmental conditions in which to build and operate communications networks. Greenland is characterized by vast distances between relatively small, isolated communities. Thus, this makes effective communication essential for bridging those gaps, allowing people to stay connected with each other and as well as the outside world irrespective of weather or geography. The lack of a comprehensive road network and reliance on sea and air travel further emphasize the importance of reliable and available telecommunications services, ensuring timely communication and coordination across the country.
Telecommunications infrastructure is a cornerstone of economic development in Greenland (as it has been elsewhere). It is about efficient internet and telephony services and its role in business operations, e-commerce activities, and international market connections. These aspects are important for the economic growth, education, and diversification of the many Greenlandic communities. The burgeoning tourism industry will also depend on (maybe even demand) robust communication networks to serve those tourists, ensure their safety in remote areas, and promote tourism activities in general. This illustrates very firmly that the communications infrastructure is critical (should there be any doubts).
Telecommunications infrastructure also enables distance learning in education and health services, providing people in remote areas with access to high-quality education that otherwise would not be possible (e.g., Coursera, Udemy Academy, …). Telemedicine has obvious benefits for healthcare services that are often limited in remote regions. It allows residents to receive remote medical consultations and services (e.g., by video conferencing) without the need for long-distance and time-consuming travels that often may aggravate a patient’s condition. Emergency response and public safety are other critical areas in which our communications infrastructure plays a crucial role. Greenland’s harsh and unpredictable weather can lead to severe storms, avalanches, and ice-related incidents. It is therefore important to have a reliable communication network that allows for timely warnings, supporting rescue operations & coordination, and public safety. Moreover, maritime safety also depends on a robust communication infrastructure, enabling reliable communication between ships and coastal stations.
A strong communication network can significantly enhance social connectivity, and help maintaining social ties, such as among families and communities across Greenland. Thus reduce the feeling of isolation. Supporting social cohesion in communities as well as between settlements. Telecommunications can also facilitate sharing and preserving the Greenlandic culture and language through digital media (e.g., Tusass Music), online platforms, and social networks (e.g., Facebook used by ca. 85% of the eligible population, that number is ca. 67% in Denmark).
For a government and its administration, maintaining effective and reliable communication is essential for well-functioning public services and its administration. It should facilitate coordination between different levels of government and remote administration. Additionally, environmental monitoring and research benefit greatly from a reliable and available communication infrastructure. Greenland’s unique environment attracts scientific research, and robust communication networks are essential for supporting data transmission (in general), coordination of research activities, and environmental monitoring. Greenland’s role in global climate change studies should also be supported by communication networks that provide the means of sharing essential climate data collected from remote research stations.
Last but not least. A well-protected (i.e., redundant) and highly available communications infrastructure is a cornerstone of any national defense or emergency situation. If it is well functioning, the critical communications infrastructure will support the seamless operation of military and civilian coordination, protect against cyber threats, and ensure public confidence during a crisis situation (natural or man-made). The importance of investing in and maintaining such a critical infrastructure cannot be underestimated. It plays a critical role in a nation’s overall security and resilience.
TUSASS: THE BACKBONE OF GREENLANDS CRITICAL COMMUNICATIONS INFRASTRUCTURE.
Tusass is the primary telecommunications provider in Greenland. It operates a comprehensive telecom network that includes submarine cables with 5 landing stations in Greenland, very long microwave (MW) radio chains (i.e., long-haul backbone transmission links) with MW backhaul branches to settlements along its way, and broadband satellite connections to deliver telephony, internet, and other communication services across the country. The company is wholly owned by the Government of Greenland (Naalakkersuisut). Positioning Tusass as a critical company responsible for the nation’s communications infrastructure. Tusass faces unique challenges due to the vast, remote, and rugged terrain. Extreme weather conditions make it difficult, often impossible, to work outside for at least 3 – 4 months a year. This complicates the deployment and maintenance of any infrastructure in general and a communications network in particular. The regulatory framework mandates that Tusass fulfills a so-called Public Service Obligation, or PSO. This requires Tusass to provide essential telecommunications services to all of Greenland, even the most isolated communities. This requires Tusass to continue to invest heavily in expanding and enhancing its critical infrastructure, providing reliable and high-quality services to all residents throughout Greenland.
Tusass is the main and, in most areas, the only telecommunications provider in Greenland. The company holds a dominant market position where it provides essential services such as fixed-line telephony, mobile networks, and internet services. The Greenlandic market for internet and data connections was liberalized in 2015. The liberalization allowed private Internet Service Providers (ISPs) to purchase wholesale connections from Tusass and resell them. Despite liberalization, Tusass remains the dominant force in Greenland’s telecommunications sector. Tusass’s market position can be attributed to its extensive communications infrastructure and its government ownership. With a population of 57 thousand and its vast geographical size, it would be highly uneconomical and human-resource wise very chalenging to have duplicate competing physical communications infrastructures and support organizations in Greenland. Not to mention that it would take many years before an alternative telco infrastructure could be up an running matching what is already in place. Thus, while there are smaller niche service providers, Tusass effectively operates as Greenland’s sole telecom provider.

CURRENT STATE OF CRITICAL COMMUNICATIONS INFRASTRUCTURE.
The illustration below provides an overview of some of the major and critical infrastructures available in Greenland, with a focus on the communications infrastructure provided by Tusass, such as submarine cables, microwave (MW) radios radio chains, and satellite ground stations, which all connect Greenland and give access to the Internet for all of Greenland.

From the south of Nanortalik up to above Upernavik on the west coast, Tusass has a 1,700+ km long microwave radio chain connecting all settlements along Greenland’s west coast from the south to the north distributed, supported by 67 microwave (MW) radio sites. Thus, have a microwave radio equipment located for every ca. 25 km ensuring very high performance and availability of connectivity to the many settlements along the West Coast. This setup is called a long-haul microwave chain that uses a series of MW radio relay stations to transmit data over long distances (e.g., up to thousands of kilometers). The harsh climate with heavy rain, snow, and icing makes it very challenging to operate high-frequency, high-bandwidth microwaves (i.e., the short distances between the radio chain sites). The MW radio sites are mainly located on remote peaks in the harsh and unforgiving coastal landscape (ensuring line-of-site), making helicopters the only means of accessing these locations for maintenance and fueling. The field engineers here are pretty much superheroes maintaining the critical communications infrastructure of Greenland and understanding its life-and-death implications for all the remote communities if it breaks down (with the additional danger of meeting a very hungry polar bear and being stuck for several days on a location due to poor weather preventing the helicopter from picking the engineers up again).

Greenland relies on the “Greenland Connect” submarine cable to connect to the rest of the world and the wider internet with a modern-day throughput. The submarine cable connecting Greenland to Canada and Iceland runs from Newfoundland and Labrador in Canada to Nuuk and continues from Qaqortoq in Greenland to land in Iceland (that connects further to Copenhagen and the wider internet). Tusass, furthermore, has deployed submarine cables between 5 of the major Greenlandic settlements, including Nuuk, up the west coast and down to the south (i.e., Qaqortoq). The submarine cables provide some level of redundancies, increased availability, and substantial capacity & quality augmentation to the long-haul MW chain that carries the traffic from surrounding settlements. The submarine cables are critical and essential for the modernization and digitalization of Greenland. However, there are only two main submarine broadband cable connection points, the Canada – Nuuk and Qaqortoq – Iceland submarine connections, to and from Greenland. From a security perspective, this poses substantial and unique risks to Greenland, and its role and impact need to be considered in any work on critical infrastructure strategy. If both international submarine cables were compromised, intentionally or otherwise, it would become challenging, if possible, to sustain today’s communications demand. Most traffic would have to be supported by existing satellite capacity, which is substantially lower than the existing submarine cables can support, leaving the capacity mainly for mission-critical communications. Allowing little spare capacity for consumer and non-critical business communication needs. This said, as long as Greenlandic submarine cables, terrestrial transport, and switching infrastructure are functional, it would be possible to internally to Greenland maintain a resemblance of internet services and communication means between connected settlements using modern day network design thinking.
Moreover, while the submarine cables along the west coast offer redundancy to the land-based long-haul transport solution, there are substantial risks to settlements and their populations where the long-haul MW solution is the only means of supporting remote Greenlandic communities. Given Greenland’s unique geographic and climate challenges it is not only very costly but also time-consuming to reduce the risk of disruption to the existing lesser redundant critical infrastructure already in place (e.g., above Aasiaat north of the Arctic Circle).
Using satellites is an additional dimension, and part of the connectivity toolkit, that can be used to improve the redundancy and availability of the land- and water-based critical communications infrastructures. However, the drawback of satellite systems is that they generally are bandwidth/throughput limited and have longer signal delays (latency and round-trip time) than terrestrial-based communications systems. These issues could pose some limitations on how well some services can be supported or will function and would require a versatile traffic management & prioritization system in case the satellite solution would be the only means of connecting a relatively high-traffic area (e.g., Tasiilaq) used to ground-based support of broadband transport means with substantial more available bandwidth than accessible to the satellite solution. Particular for GEO stationary satellite services, with the satellite located at 36 thousand kilometer altitude, the data traffic flow needs to be carefully optimized in order to function well irrespective of the substantial latency experienced on such connections that at the very best can be 239 milliseconds and in practice might be closer to twice that or more. This poses significant challenges to particular TCP/IP data flows on such response-time-challenged connections and applications sensitivity short round trip times.
Optimizing and stabilizing TCP/IP data flows over GEO satellite connections requires a multi-faceted approach involving enhancements to the TCP protocol (e.g., window scaling, SACK, TCP Hypla, …), the use of hybrid and proxy solutions, application-layer adjustments, error correction mechanisms, Quality of Service (QoS) and traffic shaping, DNS optimizations, and continuous network monitoring. Combining these strategies makes it possible to mitigate some of the inherent challenges of high-latency satellite links and ensure more effective and efficient IP flows and better utilization of the available satellite link bandwidth. Optimizing control signals and latency-sensitive data flows over GEO and LEO satellite connections may also substantially reduce the sensitivity to the prohibitive long delays experienced on GEO connections, using the lower latency LEO connection (RTT < ~ 50 ms @ 500 km altitude), or, if available as a better alternative a long-haul microwave link or submarine connection.
Tusass, in collaboration with the Spanish satellite company Hispasat, make use of the Greenland geostationary satellite, Greensat. Tusass signed an agreement with Hispasat to lease space capacity (800 MHz @ Ku-band) on the Amazonas Nexus satellite until the end of its lifetime (i.e., 2038+/-). Greensat was taken into operation in the last quarter of 2023 (note: it was launched in February 2023), providing services to the satellite-only settlement areas around Qaanaaq, the northernmost settlement on the west coast of Greenland, and Tasiilaq and Ittoqortormiut (north of Tasiilaq), on the remote east coast. All mobile and fixed traffic from a satellite-only area is routed to a satellite ground station that is connected to the geostationary satellite (see the illustration below). The satellite’s primary mission is to provide broadband services to areas that, due to geography & climate and cost, are impractical to connect by submarine cable or long-haul microwave links. The Greensat satellite closes the connection to the rest of the world and the internet via a ground station on Gran Canaria. It also connects to Greenland via submarine cables in Nuuk (via Canada and Qaqortoq).

In addition, Tusass also makes use of UK-based OneWeb (Eutelsat) LEO satellite backhaul services at several locations where an area fixed and mobile traffic is routed to a point-of-presence connected to a satellite ground station that connects to a OneWeb satellite that connects to the central switching center in Nuuk (connected to another ground station).
CRITICAL PROPERTIES FOR RELIABLE AND SECURE TRANSPORT NETWORKS.
A physical transport network comprises many tangible components, such as cables, routers, and switches, which form an interconnected system capable of transmitting data. The network is designed and planned according to a given expected coverage, use and level of targeted quality (e.g., speed, latency, priority and security). Moreover, we are also concerned about such a networks availability as well as reliability. We design the physical and logical (i.e., related to higher levels of the OSI stack than the physical) network according to a given target availability, that is how many hours in a year should the network minimum be operational and available to our customers. You will see availability given in percentage of the total hours in a year (e.g., 8,760 hours in a normal year and 8,784 hours in a leap year). So an availability of 99.9% means that we target a minimum operational time of our network of 8,751 hours, or, alternatively, accept a maximum of 9 hours of downtime. The reliability of a network refers to the probability hat the network will continue to function without failure for a given period. For example, say you have a mean time between failures (MTBF) of 8750 hours and you want to figure out what the likelihood is of operating without failure for 4,380 hours (half a year), you find that there is a ca. 60% chance of operating without a failure (or 40% that a failure may occur within the next 6 months). For a critical infrastructure the availability and reliability metrics are very important to consider in any design and planning process.
In contrast to the physical network depiction, a network graph representation abstracts the physical transport network into a mathematical model where graph nodes (or vertexes) represent the network’s many components and edges (or links) represent the physical and logical connections between these network’s many components. Modellizing the physical (and logical) network allows designers and planners to study in detail a networks robustness against many types of disruptions as well as its general functioning and performance.
Suppose we are using a graph approach in our design of a critical communications network. We then need to carefully consider various graph properties critical for the network’s robustness, security, reliability, and efficiency. To achieve this, one must strive for resilience and fault tolerance by designing for increased redundancy and availability involving multiple paths, edges, or connections between nodes, preventing single points of failure (SPoF). This involves creating a network where the number of independent paths between any two nodes is maximized (often subject to economics and feasibility boundary conditions). An optimal average degree of nodes should also be a design criterion. A higher degree of nodes enhances the graph’s, and thus the underlying network’s, resilience, thus avoiding increased vulnerability.
Scalability is a crucial network property. This is best achieved through a hierarchical structure (or topology) that allows for efficient network management as the network expands. The Modularity, which is another graph KPI, ensures that the network can integrate new nodes and edges without major reconfigurations, supporting civilian expansion and military operations or dual-purpose operations. To meet low-latency and high-throughput requirements, the shortest-path routing algorithms should be applied to allow us to minimize the latency or round-trip time (and thus increase throughput). Moreover, bandwidth management should be implemented, allowing the network to handle large data volumes in a prioritized manner (if required). This also ensures that the network can accommodate peak loads and prioritize critical communication when it is compromised.
Security is a paramount property of any communications network. In today’s environment with many real and dangerous cyber threats, it may be one of the most important topics to consider. Each node and link (or edge) in a network requires robust defenses against cyber threats. In our design, we need to think about encryption, authentication, intrusion, and anomaly detection systems. Network segmentation will help isolate critical defense communications from civilian traffic, preventing breaches from compromising the entire network. Survivability is enhanced by minimizing the Network Diameter, a graph property. A low (or lower) network diameter ensures that a network can quickly reroute traffic in case of failures and is an important design element for robustness against targeted attacks and random failures.
Likewise, interoperability is essential for seamless integration between civilian and military communication systems. Flexible protocols and specifications (e.g., Open API) enable different types of traffic and varying security requirements. These frameworks provide the structure, tools, and best practices needed to build and maintain secure communication systems. Thereby protecting against the various cyber threats we have today and expect in the future. Efficiency is achieved through effective load balancing (e.g., on a logical as well as physical level) to distribute traffic evenly across the network, prevent bottlenecks, optimize performance, and design for energy-efficient operations, particularly in remote or harsh environments or in case a part of the network has been compromised.
In order to support both civilian services and defense operations, accessibility and high availability are very important design requirements to consider when having a network with extensive large-scale coverage, including in very remote areas. Incorporating redundant communication links, such as satellite, fiber optic, and wireless, are design choices that allow for high availability even under adverse and disruptive conditions. It makes good sense in an environment such as Greenland to ensure that long-haul microwave links have a given level of redundancy either by satellite backhaul, submarine cable, or additional MW redundancy. While we always strive for our designs to be cost-effective, it may be a challenge if the circumstances dictate that the best redundancy (availability) solution is solved by non-terrestrial means (e.g., by satellite or submarine means). However, efficiency should be addressed by optimizing resource allocation to balance cost with performance, ensuring civil and defense needs are met without excessive expenditure, and sharing infrastructure where feasible to reduce costs while maintaining security through logical separation.
Ultra-secure transport networks are designed to meet stringent reliability, resilience, and security requirements. These type of networks are critical for civil and defense applications, ensuring continuous operation and protection against various threats. The important graph properties that such networks should exhibit include high connectivity, redundancy, low diameter, high node degree, network segmentation, robustness to attacks, scalability, efficient load balancing, geographical diversity, and adaptive routing.
High connectivity ensures multiple independent paths between any pair of nodes in the network, which is crucial for a communication network’s resilience and fault tolerance. This allows the network to maintain functionality even if several nodes or links fail, making it capable of withstanding targeted attacks or random failures without significant performance degradation. Redundancy, which involves having multiple backup paths and nodes, enhances fault tolerance and high availability by providing alternative routes for data transmission if primary paths fail. Redundancy also applies to critical network components such as switches, routers, and communication links, ensuring no or uncritical single point of failure.
A low diameter, the longest-shortest path between any two nodes, ensures data can travel quickly across the network, minimizing latency. This is especially important in time-sensitive applications. High node degree, meaning nodes are connected to many other nodes, increases the network’s robustness and allows for multiple paths for data to traverse, contributing to security and availability. However, it is essential to manage the trade-off between having a high node degree and the complexity of the network.
Network segmentation and compartmentalization will enhance security by limiting the impact of breaches or failures on a small part of the network. This is of particular importance when having a dual-use network design. Network segmentation divides the network into multiple smaller subnetworks. Each segment may have its own security and access control policies. Network compartmentalization involves designing isolated environments where, for example, data and functionalities are separated based on their criticality and sensitivity (this is, in general, a logical separation). Both strategies help contain cyber threats as well as prevent them from spreading across an entire network. Moreover, it also allows for a more granular control over network traffic and access. With this consideration, we should have a network that is robust against various types of attacks, including both physical and cyber attacks, by using secure protocols, encryption, authentication mechanisms, and intrusion detection systems. The aim of the network topology should be to minimize the impact of potential attacks on critical network nodes and links.
In a country such as Greenland, with settlements spread out over a very long distance and supported by very long and exposed transmission links (e.g., long-haul microwave links), geographical diversity is an essential design consideration that allows us to protect the functioning of services against localized disasters or failures. Typically, this involves distributing switching and management nodes, including data centers, across different geographic locations, ensuring that a failure in one area or with a main transport link does not disrupt the major parts of a network. This is particularly important for disaster recovery and business continuity. Finally, the network should support adaptive and dynamic routing protocols that can quickly respond to changes in the network topology, such as node failures or changes in traffic patterns. Such protocols will enhance the network’s resilience by automatically finding the best real-time data transmission paths.
TUSASS NETWORK AS A GRAPH.
Real maps, such as the Greenland map shown below at the left side of Figure 8, provide valuable geographical context and are essential for understanding the physical layout and extent of, for example, a transport network. A graph representation, as shown on the right side of Figure 8, on the other hand, offers a powerful and complementary perspective of the real-world network topology. It can emphasize the structural properties (and qualities) without those disappearing in geographical details that often are not relevant to the network functioning (if designed appropriately). A graph can contain many layers of network information that pretty much describe the network stack if required (e.g., from physical transport up through IP, TCP/IP, and to the application layers). It also supports many types of advanced analysis, design scenarios, and different types of simulations. A graph representation of a communications network is an invaluable tool for network design, planning, troubleshooting, analysis, and management.
Thus, the network graph approach offers several benefits for planning and operations. Firstly, the approach can often visualize the network’s topology better than a geographical map. It facilitates the understanding of various network (and graph) relationships and interconnections between the various network components. Secondly, the graph algorithms can be applied to the network graph and support the analysis of its characteristics, such as availability and redundancy scores, connectivity in general, the shortest paths, and so forth. This kind of analysis helps us identify critical nodes or links that may be sensitive to network and service disruption. It can also help significantly in maintaining and optimizing a network’s operation.
So, analyzing the our communication network’s graph representation makes it possible to identify potential weaknesses in the physical transport network, such as single points of failure (SPoF), bottlenecks, or areas with limited or weak redundancy. These identified weaknesses can then be addressed to enhance the network’s resilience, e.g., improving our network’s redundancy, availability and thus its overall reliability.

In the following, it is important to understand that due to Greenland’s specific conditions, such as weather and geography, building a robust transport network regarding reliability and redundancy will always be challenging, particularly when relying on the standard toolbox for designing, planning, and creating such networks. With geographical challenges should for example be understood the resulting lack of civil infrastructure connecting settlements … such as the lack of a road network.
The Table below provides key performance indicators (KPIs) for the Greenlandic (Tusass) transport network graph, as illustrated in Figure 8 above. It represents various aspects of the transport network’s structure and connectivity. This graph consists of 93 vertices (e.g., settlements and other connection points, such as long-haul MW radio sites) and 101 edges (transport connections), and it is fully connected, meaning all nodes are reachable within the network. There is only one subgraph, indicating no isolated segments as expected.
The Average Path Length suggests that it takes on average 39 steps to travel between any two nodes. This is a relatively high number, which may indicate a less efficient network. The Diameter of a network is defined as the longest shortest path between any two nodes. It can be shown that the value of the diameter lies between the value of the radius and twice that value (and not higher;-). The diameter is found to be 32, indicating a quite high maximum distance between the most distant nodes. This suggests that the network has a quite extensive reach, as is also obvious from the various illustrations of the transport network above (Figure 8) and below (Figure 11 & 12). Apart from the fact that such a high diameter may indicate potential inefficiencies, a large diameter can also mean that, in the worst-case scenarios, such as a compromised link or connectivity issues in general, communication between some nodes involves many steps (or hops), potentially leading to higher latency and slower data transmission. Related to the Diameter, the network Radius is the minimum eccentricity of any node, which is the shortest path from the most central node to the farthest node. Here, we find the radius to be 16, which means that even the most centrally located node is relatively far from some other nodes in the network. Something that is also very obvious from the various illustrations of the transport network. This emphasizes that the network has nodes that are significantly far apart. Without sufficient redundancy in place, such a transport network may be more sensitive to disruption of the connectivity.
From the perspective of redundancy, a large diameter and radius may imply that the network has fewer alternative paths between distant nodes (i.e., a lower redundancy score). This is, for example, the case between the northern point of Kullorsuaq and Aasiaat. Aasiaat is the first settlement (from the North) to be connected both by microwave and submarine cable and thus has an alternative connectivity solution to the long-haul microwave chain. If a critical node or link fails, the alternative path latency might be considerably longer than the compromised connectivity, such as would be the case with the alternative connectivity being satellite-based, leading to inefficiencies and possible reduced performance. This can also suggest potential capacity bottlenecks where specific paths are heavily relied upon without having enough capacity to act as the sole connectivity for a given transmission path. Thus, the vulnerability of the network to failures increases, resulting in reduced performance for customers in the affected area.
We find a Graph Density, at 0.024. This value indicates a sparse network with relatively few connections compared to the number of possible connections. The Clustering Coefficient is 0.014 and indicates that there are very few tightly-knit groups of nodes (again easily confirmed by visual inspection of the graph itself, see the various figures). The value of the Average Betweenness (ca. 423) measures how often nodes act as bridges along the shortest path between other nodes, indicating a significant central node (i.e., Nuuk).
The Average Closeness of 0.0003 and the Average Eigenvector Centrality of 0.105 provide insights into settlements’ influence and accessibility within the transport network. The Average Closeness measures of how close, on average, nodes are to each other. A high value indicates that nodes (or settlements) are close to each other meaning that the information (e.g., user data, signaling) being transported over the network spreads quickly and efficiently. And not surprisingly the opposite would be the case for a low average value. For our Tusass network the average closeness is very low and suggests that the network may face challenges in accessibility and efficiency, with nodes (settlements) being relatively far from one another. This typically will have an impact on the speed and effectiveness of communication across the network. The Average Eigenvector Centrality measures the overall importance (or influence) of nodes within a network. The term Eigenvector is a mathematical concept from linear algebra that represents the stable state of the network and provides insights into the structure of the graph and thus the network. For our Tusass network the average eigenvector value is (very) low and indicates a distribution of influence across several nodes that may actually prevent reliance on a single point of failure and, in general, such structures are thought to enhance a network’s resilience and redundancy. An Average Degree of ca. 2 means that each node has about 2 connections on average, indicating a hierarchical network structure with fewer direct connections and with a somewhat low level of redundancy, consistent with what can be observed from the various illustrations shown in this post. This do indicate that our network may be more vulnerable to disruption and failures and have a relative high latency (thus, a high round trip time).
Say that for some reason, the connection to Ilulissat, a settlement north of Aasiaat on the west coast with a little under 5 thousand people, is disrupted due to a connectivity issue between Ilulissat and Qasigiannguit, a neighboring settlement to Ilulissat with ca. a thousand people. This would today disconnect ca. 11 thousand people from receiving communications services or ca. 20% of Tusass’s customer base as all settlements north of Ilulissat would likewise be disconnected because of the reliance on the broken connection to also transport their data towards Nuuk and the internet using the submarine cables out of Greenland. In the terminology of the network graph, a broken connection (or edge as it is called in graph theory) that breaks up the network into two (or more) disconnected parts is called a Bridge. Thus, the connection between Ilulissat and Qasigiannguit is a bridge, as if it is broken, disconnecting the northern part of the long-haul microwave network above Ilulissat. Similarly, if Ilulissat were a central switching hub disrupted, it would disconnect the upper northern network from the network south of Ilulissat, and we would call Ilulissat an Articulation Point. For example, a submarine cable between Aasiaat and Ilulissat would provide redundancy for this particular event, mitigating a disruption of the microwave long-haul network between Ilulissat and Aasiaat that would disconnect at least 20% of the population from communications services.
The transport network has 44 Articulation Points and 57 Bridges, highlighting vulnerabilities where node or link failures could significantly disrupt the connectivity between parts of the network, disconnecting major parts of the network and thus disrupting services. A Modularity of 0.65 suggests a moderately high presence of distinct communities, with the network divided into 8 such communities (see Figure below).

A Throughput (or Degree) of 202 indicates a network with an overall capacity for data transmission. The Degree is the average number of connections per node for a network graph. In a transport network, the degree indicates how many direct connections it has to other settlements. A higher degree implies better connectivity and potentially a higher resilience and redundancy. In a fully connected network with 93 nodes, the total degree would be 93 multiplied by 92, which equals 8,556. Therefore, a value of 202 is quite low in comparison, indicating that the network is far from fully connected, which anyway would be unusual for a transport network on this side. Our transport network is relatively sparse and, thus, resulting in a lower total degree, suggesting that fewer direct paths exist between nodes. This may potentially also mean less overall network redundancy. In the case of a node or link failure, there might be fewer alternative routes, which, as a consequence, can impact network reliability and resilience. Lower degree values can also indicate limited capacity for data transmission between nodes, potentially leading to congestion or bottlenecks if certain paths become over-utilized. This can, of course, then affect the efficiency and speed of data transfer within the network as traffic congestion levels increase.
The KPIs, shown in Table 1 below, collectively indicate that our Greenlandic transport network has several critical points and connections that could affect redundancy and availability. Particularly if they become compromised or experience outages. The high number of articulation points and bridges indicates possible design weaknesses, with the low density and average degree suggesting a limited level of redundancy. In fact, Tusass has, over several years, improved its transport network resilience, focusing on increasing the level of redundancy and reducing critical single points of failure. However, the changes and additions are costly and, due to the environmental conditions of Greenland, are also time-consuming, having fewer working days available for outdoor civil work projects.

In graph theory, an articulation point (see Figure 10 below) is a node that, if it is removed from the network, would split the network into disconnected parts. In our story, an articulation point would be one of our Greenlandic settlements. These types of points are thus important in maintaining network connectivity and serve as points in the network where alternative redundancy schemes might serve well. Therefore, creating additional redundancy in the network’s routing paths and implementing alternative connections will mitigate the impact of a failure of an articulation point, ensuring continued operations in case of a disruption. Basically, the more redundancy that a network has, the fewer articulation points the network will have; see also the illustration below.

Careful consideration of articulation points is crucial in preventing network partitioning, where removing a single node can disconnect the overall network into multiple sub-segments of the network. The connectivity between different segments is obviously critical for continuous data flow and service availability. Often, design and planning requirements dictate that if a network is broken into parts due to various disruption scenarios, these parts will remain functional and continue to provide a service that is possible with reduced performance. Network designers would make use of different strategies, such as increasing the physical redundancy of the transmission network as well as making use of routing algorithms on a higher level, such as multipath routing and diverse routing paths. Moreover, optimizing the placement of articulation points and routing paths (i.e., how traffic flows through the communications network) also maximizes resource utilization and may ensure optimal network performance and service availability for an operator’s customers.

In graph theory, a bridge is a network connection (or edge) whose removal would split the graph into multiple disconnected components. This type of connection is obviously critical for maintaining connectivity and facilitating communication between different network parts. In real life with real networks, the network designers would, in general, spend considerable time to ensure that such critical connections (i.e., so-called bridges) do not have an over-proportional impact on their network availability by, for example, building alternative connections (i.e., redundant connections) or ensuring that the impact of a compromised bridge would have a minimum impact in terms of the number of customers.
For our transport network in Greenland, the long-haul microwave transport network is overall less sensitive to disruption on a settlement level, as the underlying topology is like a long spine at high capacity and reasonable redundancy built-in with branches of MW radios that connect from the spine to a particular settlement. Thus, in most cases in this analysis, the long-haul MW radio site, in proximity to a given settlement, is the actual articulation point (not the settlement itself). The Nuuk data center, a central switching hub, is, by definition, an articulation point of very high criticality.
As discussed above and shown below (Figure 12), in the context of our transport network, bridges may play a crucial role in network resilience and fault tolerance. In our story, bridges represent the transport connections connecting Greenlandic settlements and the core network back in Nuuk (i.e., the master network node). In our representations, a bridge can, for example, be (1) a Microwave connection, (2) A submarine cable connection, and (3) a satellite connection provided by Tusass’s geo stationary satellite (e.g., Greensat) or by the low-earth orbiting OneWeb satellite. By identifying and managing bridges, network designers can mitigate the impact of link failures and disruptions, ensuring continuous operation and availability of services. Moreover, keeping network bridges in mind and minimizing them when planning a transport network will significantly reduce the risk of customer-affecting outages and keep the impact of transport disruption and the subsequent network partitioning to a minimum.

Network designers should deploy redundancy mechanisms that would minimize the risk of the disruptive impact of compromised articulation points and bridges. They have several choices to choose from, such as multipath routing (e.g., ring topologies), link aggregation, and diverse routing paths to enhance redundancy and availability. These mechanisms will help minimize the impact of bridge failures and improve the overall network availability by increasing the level of network redundancy on a physical and logical level. Moreover, optimizing the placement of bridges and routing paths in a transport network will maximize resource utilization and ensure optimal network performance and service availability.
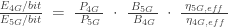
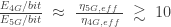
Knowing a given networks Articulation Points and Bridges will allow us to define an Availability and a Redundancy Score that we can use to evaluate and optimize a network’s robustness and reliability. Some examples of these concepts for simpler graphs (i.e., 4 nodes) are also shown in Figure 10 above. In the context of the Greenland transport network used here, these metrics can help us understand how resilient the network is to failures.
The Availability Score measures the proportion of nodes that are not articulation points, which might compromise our network’s overall availability if compromised. This score measures the risk of exposure to service disruption in case of a disconnection. As a reminder, the articulation point, or cut-vertex, is a node that, when removed, increases the number of components of the network and, thus, potentially the amount of disconnecting parts. The formula that is used to calculate the availability score is given by the total number of settlements (e.g., 93) minus the number of articulation points (e.g., 44) divided by the total number of settlements (e.g., 93). In this context, a higher availability score indicates a more robust network where fewer nodes are critical points of failure. Suppose we get a score that is close to one. In that case, this indicates that most nodes are not articulation points, suggesting that the network can sustain multiple node failures without significant loss of connectivity (see Figure 10 for a relatively simple illustration of this).
The Redundancy Score measures the proportion of connections that are not bridges, which could result in severe service disruptions to our customers if compromised. When a bridge is compromised or removed, it increases the number of network parts. The formula for the redundancy score is the total number of transport connections (edges, e.g., 101) minus the number of bridges (e.g., 57) divided by the total number of transport connections (edges, e.g., 101). Thus, in this context of redundancy, a higher redundancy score indicates a more resilient network where fewer edges are critical points of failure. If we get a redundancy score that is close to 100%, it would indicate that most of our (transport) connections cannot be categorized as bridges. This also suggests that our network can sustain multiple connectivity failures without it, resulting in a significant loss of overall connectivity and a severe service interruption.
Having more switching centers, or central hubs, can significantly enhance a communications network’s resilience, availability, and redundancy. It also reduces the consequences and impact of disruption to critical bridges in the network. Moreover, by distributing traffic, isolating failures, and providing multiple paths for data transmission, these central hubs may ensure continuous service to our customers and improve the overall network performance. In my opinion, implementing strategies to support multiple switching centers is essential for maintaining a robust and reliable communications infrastructure capable of withstanding various disruptions and enabling scaling to meet any future demands.
For our Greenlandic transport network shown above, we find an Availability Score of 53% and a Redundancy Score of 44%. While the scores may appear on the low side, we need to keep in mind that we are in Greenland with a population of 57 thousand mainly distributed along the west coast (from south to the north) in about 50+ settlements with 30%+ living in Nuuk. Tusass communications network connects to pretty much all settlements in Greenland, covering approximately 3,500+ km on the west coast (e.g., comparable to the distance from the top of Norway all the way down to the most southern point of Sicily), and irrespective of the number of people living in them. This is also a very clear desire, expectation, and direction that has been given by the Greenlandic administration (i.e., via the universal service obligation imposed on Tusass). The Tusass transport network is not designed with strict financial KPIs in mind and with the financial requirement that a given connection to a settlement would need to have a positive return on investment within a few years (as is the prevalent norm in our Industry). The transport network of Tusass has been designed to connect all communities of Greenland to an adequate level of quality and availability, prioritizing the coverage of the Greenlandic population (and the settlements they live in) rather than whether or not it makes hard financial sense. Tusass’s network is continuously upgraded and expanded as the demand for more advanced broadband services increases (as it does anywhere else in the world).
CRITICAL TECHNOLOGIES RELEVANT TO GREENLAND AND THE WIDER ARCTIC.
Greenland’s strategic location in the Arctic and its untapped natural resources, such as rare earth elements, oil, and gas, has increasingly drawn the attention of major global powers like the United States, Russia, and China. The melting Arctic ice due to climate change is opening new shipping routes and making these resources more accessible, escalating the geopolitical competition in the region.
Greenland must establish a defense and security strategy that minimizes its dependency on its natural allies and external actors to mitigate a situation where such may not be available or have the resources to commit to Greenland. An integral part of such a security strategy should be a dual-use, civil, and defense requirement whenever possible. Ensuring that Greenlandic society gets an immediate and sustainable return on investments in establishing a solid security framework.
5G technology offers significant advancements over previous generations of wireless networks, particularly in terms of private networking, speed, reliability, and latency across a variety of coverage platforms, e.g., (normal fixed) terrestrial antennas, vehicle-based (i.e., Cell on Wheels), balloon-based, drone-based, LEO-satellite based. This makes 5G ideal for setting up ad-hoc mobile coverage areas for military and critical civil applications. One of the key capabilities of 5G that supports these use cases is network slicing, which allows for the creation of dedicated virtual networks optimized for specific requirements.
Telia Norway has conducted trials together with the Norwegian Armed Forces in Norway to demonstrate the use of 5G for military applications (note: I think this is one of the best examples of an operator-defense collaboration on deployment innovation and directly applies to Arctic conditions). These trials included setting up ad-hoc 5G networks to support various military scenarios (including in an Arctic-like climate). The key findings demonstrated the ability to provide high-speed, low-latency communications in challenging environments, supporting real-time situational awareness and secure communications for military personnel. Ericsson has also partnered with the UK Ministry of Defense to trial 5G applications for military use. These trials focused on using 5G to support secure communications, enhance situational awareness, and enable the use of autonomous systems in military operations. NATO has conducted exercises incorporating 5G technology to evaluate its potential for improving command and control, situational awareness, and logistics in multi-national military operations. These exercises have shown the potential of 5G to enhance interoperability and coordination among allied forces. It is a very meaningful dual-use technology.
5G private networks offer a dedicated and secure network environment for specific organizations or use cases, which can be particularly beneficial in the Arctic and Greenland. These private networks can provide reliable communication and data transfer in remote and harsh environments, supporting military and civil applications. For instance, in Greenland, 5G private networks can enhance communication for scientific research stations, ensuring that data from environmental monitoring and climate research is transmitted securely and efficiently. They can also support critical infrastructure, such as power grids and transportation networks, by providing a reliable communication backbone. Moreover, in Greenland, the existing public telecommunications network may be designed in such a way that it essentially could operate as a “private” network in case transmission lines connecting settlements would be compromised (e.g., due to natural or unnatural causes), possibly a “thin” LEO satellite connection out of the settlement.
5G provides ultra-fast data speeds and low latency, enabling (near) real-time communication and data processing. This is crucial for military operations and emergency response scenarios where timely information is vital. Network slicing allows a single physical 5G network to be divided into multiple virtual networks, each tailored to specific applications or user groups. This ensures that critical communications are prioritized and reliable even during network congestion. It should be considered that for Greenland, the transport network (e.g., long-haul microwave network, routing choices, and satellite connections) might be limiting how fast the ultra-fast data speeds can become and may, at least along some transport routes, limit the round trip time performance (e.g., GEO satellite connections).
5G Enhanced Mobile Broadband (eMBB) provides high-speed internet access to support applications such as video streaming, augmented reality (AR), and virtual reality (VR) for situational awareness and training. Massive Machine-Type Communications (mMTC) supports a large number of IoT devices for monitoring and controlling equipment, sensors, and vehicles in both military and civil scenarios. Ultra-Reliable (Low-Latency) Communications (URLLC) ensures dependable and timely communication for critical applications such as command and control systems as well as unmanned and autonomous communication platforms (e.g., terrestrial, aerial, and underwater drones). I should note that designing defense and secure systems for ultra-low latency (< 10 ms) requirements would be a mistake as such cannot be guaranteed under all scenarios. The ultra-reliability (and availability) of transport connectivity is a critical challenge as it ensures that a given system has sufficient autonomy. Ultra-low latency of a given connectivity is much less critical.
For military (defense) applications, 5G can be rapidly deployed in the field using portable base stations to create a mobile (private) network. This is particularly useful in remote or hostile environments where traditional infrastructure is unavailable or has been compromised. Network slicing can create a secure, dedicated network for military operations. This ensures that sensitive data and communications are protected from interception and jamming. The low latency of 5G supports (near) real-time video feeds from drones, body cameras, and other surveillance equipment, enhancing situational awareness and decision-making in combat or reconnaissance missions.

In critical civil applications, 5G can provide reliable communication networks for first responders during natural disasters or large-scale emergencies. Network slicing ensures that emergency services have priority access to the network, enabling efficient coordination and response. 5G can support the rapid deployment of communication networks in disaster-stricken areas, ensuring that affected populations can access critical services and information. Network slicing can allocate dedicated resources for smart city applications, such as traffic management, public safety, and environmental monitoring, ensuring that these services remain operational even during peak usage times. Thus, for Greenland, ensuring 5G availability would be through coastal settlements and possibly coastal coverage (outside settlements) of 5G at a lower frequency range (e.g., 600 – 900 MHz), prioritizing 5G coverage rather than 5G enhanced mobile broadband (i.e., any coverage at a high coverage probability is better than no coverage at certainty).
Besides 5G, what other technologies would otherwise be of importance in a Greenland Technology Strategy as it relates to its security and ensuring its investments and efforts also return beneficially to its society (e.g., a dual-use priority):
- It would be advisable to increase the number of community networks within the overall network that can continue functioning if cut off from the main communications network. Thus, communications services in smaller and remote settlements depend less on a main or very few central communications control and management hubs. This requires on a local settlement level, or grouping of settlements, self-healing, remote (as opposed to a central hub) management, distributed databases, regional data center (typically a few racks), edge computing, local DNS, CDNs and content hosting, satellite connection, … Most telecom infrastructure manufacturing companies have today network in a box solutions that allow for such designs. Such solutions enable private 5G networks to function isolated from a public PLMN and fixed transport network.
- It is essential to develop a (very) highly available and redundant digital transport infrastructure leveraging the existing topology strengthened by additional submarine cables (less critical than some of the other means of connectivity), increased transport ring- & higher-redundancy topologies, multi-level satellite connections (GEO, MEO & LEO, supplier redundancy) with more satellite ground gateways on Greenland (e.g., avoiding “off-Greenland” traffic routing). In addition, a remotely controlled stratospheric drone platform could provide additional connectivity redundancy at very high broadband speeds and low latencies.
- Satellite backhaul solutions, operating, for example, from a Low Earth Orbit (LEO), such as shown in Figure below, are extending internet services to the farthest reaches of the globe. These satellites offer many benefits, as already discussed above, in connecting remote, rural, and previously un- and under-served areas with reliable internet services. Many remote regions lack foundational telecom infrastructure, particularly long-haul transport networks for carrying traffic away from remote populated areas. Satellite backhauls do not only offer a substantially better financial solution for enhancing internet connectivity to remote areas but are often the only viable solution for connectivity. The satellite backhaul solution is an important part of the toolkit to improve on redundancy and availability of particular very long and extensive long-haul microwave transport networks through remote areas (e.g., Greenland’s rugged and frequently hostile harsh coastal areas) where increasing the level of availability and redundancy with terrestrial means may be impractical (due to environmental factors) or incredibly costly.
– LEO satellites provide several security advantages over GEO satellites when considering resistance to hostile actions to disrupt satellite communications. One significant factor is the altitude at which LEO satellites operate, which is between 500 and 2,000 kilometers, compared to GEO satellites, which are positioned approximately 36,000 kilometers above the equator. The lower altitude makes LEO satellites less vulnerable to long-range anti-satellite (ASAT) missiles.
– LEO satellite networks are usually composed of large constellations with many satellites, often numbering in the dozens to hundreds. This extensive LEO network constellation provides some redundancy, meaning the network can still function effectively if some satellites are “taken out.” In contrast, GEO satellites are typically much fewer in number, and each satellite covers a much larger area, so losing even one GEO satellite will have a significant impact.
– Another advantage of LEO satellites is their rapid movement across the sky relative to the Earth’s surface, completing an orbit in about 90 to 120 minutes. This constant movement makes it more challenging for hostile actors to track and target individual satellites for extended periods. In comparison, GEO satellites remain stationary relative to a fixed point on Earth, making them easier to locate and target.
LEO satellites’ lower altitude also results in lower latency than GEO satellites. This can benefit secure, time-sensitive communications and is less susceptible to interception and jamming due to the reduced time delay. However, any security architecture of the critical transport infrastructure should not only rely on one type of satellite configuration.
– Both GEO and LEO satellites have their purpose and benefits. Moreover, a hierarchical multi-dimensional topology, including stratospheric drones and even autonomous underwater vehicles, is worth considering when designing critical communications architecture. It is also worth remembering that public satellite networks may offer a much higher degree of communications redundancy and availability than defense-specific constellations. However, for SIGINT & IMINT collection, the defense-specific satellite constellations are likely much more advanced (unfortunately, they are also not as numerous as their civilian “cousins”). This said, a stratospheric aerial platform (e.g., HAP) would be substantially more powerful in IMINT and possibly also for some SIGINT tasks (or/and less costly & versatile) than a defense-specific satellite solution.

- Establish collaboration and agreements with LEO direct to cellular device satellite providers (i.e., there are many more than StarLink (US) around, e.g., AST Spacemobile (US), Lynk Mobile (US), Sateliot (Spain),…) that would offer cellular services across Greenland. A possible concern is to what degree such systems can be relied upon in a crisis, as these are controlled by external commercial companies operating satellites outside the control and influence of Greenlandic interests. For more details about LEO satellites, see my recent article “The Next Frontier: LEO Satellites for Internet Services.”.

- Establish an unmanned (remotely operated) stratospheric High Altitude Platform System (HAPS) (i.e., an advanced drone-based platform) or Unmanned Aerial Vehicles (UAV) over Greenland (or The Arctic region) with payload agnostic capabilities. This could easily be run out of existing Greenlandic ground-based aviation infrastructure (e.g., Kangerlussuaq, Nuuk, or many other community airports across Greenland). This platform could eventually become autonomous or require little human intervention. The high-altitude platform could support mission-critical ad-hoc networking for civil and defense applications (over Greenland). Such a multi-purpose platform can be used for IMINT and SIGINT (i.e., for both civil & defense) and civil communication means, including establishing connectivity to the ground-based transport network in case of disruptions. Lastly, a HAPS may also permanently offer high-quality and capacity 5G mobile services or act as a private ultra-secure 5G network in an ad-hoc mission-specific scenario. For a detailed account of stratospheric drones and how these compared with low-earth satellites, see my recent article “Stratospheric Drones & Low Earth Satellites: Revolutionizing Terrestrial Rural Broadband from the Skies?”.
– Stratospheric drones, which operate in the stratosphere at altitudes around 20 to 50 kilometers, offer several security advantages over traditional satellite communications and submarine communication cables, especially from a Greenlandic perspective. These drones are less accessible and harder to target due to their altitude, which places them out of reach for most ground-based anti-aircraft systems and well above the range of most manned aircraft. This makes them less vulnerable to hostile actions compared to satellites, which can be targeted by anti-satellite (ASAT) missiles, or submarine cables, which can be physically cut or damaged by underwater operations. The drones would stay over Greenlandic, or NATO, territory while by nature, design, and purpose, submarine communications cables and satellites, in general, are extending far beyond the territory of Greenland.
– The mobility and flexibility of stratospheric drones allow them to be quickly repositioned as needed, making it difficult for adversaries to consistently target them. Unlike satellites that follow predictable orbits or submarine cables with fixed routes, these drones can change their location dynamically to respond to threats or optimize their coverage. This is particularly advantageous for Greenland, whose vast and harsh environment makes maintaining and protecting fixed communication infrastructure challenging.
– Deploying a fleet of stratospheric drones provides redundancy and scalability. If one drone is compromised or taken out of service, others can fill the gap, ensuring continuous communication coverage. This distributed approach reduces the risk of a single point of failure, which is more pronounced with individual satellites or single submarine cables. For Greenland, this means a more reliable and resilient communication network that can adapt to disruptions.
– Stratospheric drones can be rapidly deployed and recovered, making it an easier platform to maintain and upgrade them as needed compared to for example satellite based platforms and even terrestrial deployed networks. This quick deployment capability is crucial for Greenland, where harsh weather conditions can complicate the maintenance and repair of fixed infrastructure. Unlike satellites that require expensive and complex launches or submarine cables that involve extensive underwater laying and maintenance efforts, drones offer a more flexible and manageable solution.
– Drones can also establish secure, line-of-sight communication links that are less susceptible to interception and jamming. Operating closer to the ground compared to satellites allows the use of higher frequencies narrower beams that are more difficult to jam. Additionally, drones can employ advanced encryption and frequency-hopping techniques to further secure their communications, ensuring that sensitive data remains protected. Stratospheric drones can also be equipped with advanced surveillance and countermeasure technologies to detect and respond to threats. For instance, they can carry sensors to monitor the electromagnetic spectrum for jamming attempts and deploy countermeasures to mitigate these threats. This proactive defense capability enhances their security profile compared to passive communication infrastructure like satellites or cables.
– From a Greenlandic perspective, stratospheric drones offer significant advantages. They can be deployed over specific areas of interest, providing targeted communication coverage for remote or strategically important regions. This is particularly useful for covering Greenland’s vast and sparsely populated areas. Modern stratospheric drones are designed to support multi-dimensional payloads, or as it might also be called, payload agnostic (e.g., SIGINT & IMINT equipment, 5G base station and advanced antenna, laser communication systems, …) and stay operational for extended periods, ranging from weeks to months, ensuring sustained communication coverage without the need for frequent replacements or maintenance.
– Last but not least, Greenland may be an ideal safe testing ground due to its vast, remote and thinly populated regions.

- Unmanned Underwater Vehicles (UUV), also known as Autonomous Underwater Vehicles (AUV), are obvious systems to deploy for underwater surveillance & monitoring that may also have obvious dual-use purposes (e.g., fisheries & resource management, iceberg tracking and navigation, coastal defense and infrastructure protection such as for submarine cables). Depending on the mission parameters and type of AUV, the range is between up to 100 kilometers (e.g., REMUS100) to thousands of kilometers (e.g., SeaBed2030) and an operational time (endurance) from max. 24 hours (e.g., REMUS100, Bluefin-21), to multiple days (e.g., Boing Echo Voyager), to several months (SeaBed2030). A subset of this kind of underwater solution would be swarm-like AUV constellations. See Figure 17 below for an illustration.
- Increase RD&T (Research, Development & Trials) on Arctic Internet of Things (A-IOT) (note: require some level of coverage, minimum satellite) for civil, defense/military (e.g., Military IOT nor M-IOT) and dual-use applications, such as surveillance & reconnaissance, environmental monitoring, infrastructure security, etc… (note: IOTs are not only for terrestrial use cases but also highly interesting for aquatic applications in combination with AUV/UUVs). Military IoT refers to integrating IoT technologies tailored explicitly for military applications. These devices enhance operational efficiency, improve situational awareness, and support decision-making processes in various military contexts. Military IoT encompasses various connected devices, sensors, and systems that collect, transmit, and analyze data to support defense and security operations. In the vast and remote regions of Greenland and the Arctic, military IoT devices can be deployed for continuous surveillance and reconnaissance. This includes using drones, such as advanced HAPS, equipped with cameras and sensors to monitor borders, track the movements of ships and aircraft, and detect any unauthorized activities. Military IoT sensors can also monitor Arctic environmental conditions, tracking ice thickness changes, weather patterns, and sea levels. Such data is crucial for planning and executing military operations in the challenging Arctic environment but is also of tremendous value for the Greenlandic society. The importance of dual-use cases, civil and defense, cannot be understated; here are some examples:
– Infrastructure Monitoring and Maintenance: (Military Use Case) IoT sensors can be deployed to monitor the structural integrity of military installations, such as bases and airstrips, ensuring they remain operational and safe for use. These sensors can detect stress, wear, and potential damage due to extreme weather conditions. These IoT devices and networks can also be deployed for perimeter defense and monitoring. (Civil Use Case) The same technology can be applied to civilian infrastructure, including roads, bridges, and public buildings. Continuous monitoring can help maintain these civil infrastructures by providing early warnings about potential failures, thus preventing accidents and ensuring public safety.
– Secure Communication Networks – Military Use Case: Military IoT devices can establish secure communication networks in remote areas, ensuring that military units can maintain reliable and secure communications even in the Arctic’s harsh conditions. This is critical for coordinating operations and responding to threats. Civil Use Case: In civilian contexts, these communication networks can enhance connectivity in remote Greenlandic communities, providing essential services such as emergency communications, internet access, and telemedicine. This helps bridge the digital divide and improve residents’ quality of life.
– Environmental Monitoring and Maritime Safety – Military Use Case: Military IoT devices, such as underwater sensor networks and buoys, can be deployed to monitor sea conditions, ice movements, and potential maritime threats. These devices can provide real-time data critical for naval operations, ensuring safe navigation and strategic planning. Civil Use Case: The same sensors and buoys can be used for civilian purposes, such as ensuring the safety of commercial shipping lanes, fishing operations, and maritime travel. Real-time monitoring of sea conditions and icebergs can prevent maritime accidents and enhance the safety of maritime activities.
– Fisheries Management and Surveillance – Military Use Case: IoT devices can monitor and patrol Greenlandic waters for illegal fishing activities and unauthorized maritime incursions. Drones and underwater sensors can track vessel movements, ensuring that military forces can respond to potential security threats. Civil Use Case: These monitoring systems can support fisheries management by tracking fish populations and movements, helping to enforce sustainable fishing practices and prevent overfishing. This data is important for the local economy, which heavily relies on fishing. - Implement Distributed Acoustic Sensing (DAS) on submarine cables. DAS utilizes existing fiber-optic cables, such as those used for telecommunications, to detect and monitor acoustic signals in the underwater environment. This innovative technology leverages the sensitivity of fiber-optic cables to vibrations and sound waves, allowing for the detection of various underwater activities. This could also be integrated with the AUV and A-IOTs-based sensor systems. It should be noted that jamming a DAS system is considerably more complex than jamming traditional radio-frequency (RF) or wireless communication systems. DAS’s significant security and defense advantages might justify deploying more submarine cables around Greenland. This investment is compelling because of enhanced surveillance and security, improved connectivity, and strategic and economic benefits. By leveraging DAS technology, Greenland could strengthen its national security, support economic development, and maintain its strategic importance in the Arctic region.
- Greenland should widely embrace autonomous systems deployment and technologies based on artificial intelligence (AI). AI is a technology that could compensate for the challenges of having a vast geography, a hostile climate, and a small population. This may, by far, be one of the most critical components of a practical security strategy for Greenland. Getting experience with autonomous systems in a Greenlandic and Arctic setting should be prioritized. Collaboration & knowledge exchange with Canadian and American universities should be structurally explored, as well as other larger (friendly) countries with Arctic interests (e.g., Norway, Iceland, …).
- Last but not least, cybersecurity is an essential, even foundational, component of the securitization of Greenland and the wider Arctic, addressing the protection of critical infrastructure, the integrity of surveillance and monitoring systems, and the defense against geopolitical cyber threats. The present state and level of maturity of cybersecurity and defense (against cyber threats) related to Greenland’s critical infrastructure has to improve substantially. Prioritizing cybersecurity may have to be at the expense of other critical activities due to limited resources with relevant expertise available to businesses in Greenland). Today, international collaboration is essential for Greenland to develop strong cyber defense capabilities, ensure secure communication networks, and implement effective incident response plans. However, it is essential for Greenland’s security that a cybersecurity architecture is tailor-made to the particularities of Greenland and allows Greenland to operate independently should friendly actors and allies not be in a position to provide assistance.

How do we frame some of the above recommendations into a context of securitization in the academic sense of the word aligned with the Copenhagen School (as I understand it)? I will structure this as the “Securitizing Actor(s),” “Extraordinary Measures Required,” and the “Geopolitical Implications”:
Example 1: Improving Communications networks as a security priority.
Securitizing Actor(s): Greenland’s government, possibly supported by Denmark and international allies (e.g., The USA’s Pituffik Space Base on Greenland), frames the lack of higher availability and reliable communication networks as an existential threat to national security, economic development, and stability, including the ability to defend Greenland effectively during a global threat or crisis.
Extraordinary Measures Required: Greenland can invest in advanced digital communication technologies to address the threat. This includes upgrading infrastructure such as fiber-optic cables, satellite communication systems, stratospheric high-altitude platform (HAP) with IMINT, SIGINT, and broadband communications payload, and 5G wireless networks to ensure they are reliable and can handle increased data traffic. Implementing advanced cybersecurity measures to protect these networks from cyber threats is also crucial. Additionally, investments in broadband expansion to remote areas ensure comprehensive coverage and connectivity.
Geopolitical Implications: By framing the reliability and availability of digital communications networks as a national security issue, Greenland ensures that significant resources are allocated to upgrade and maintain these critical infrastructures. Greenland may also attract European Union investments to leapfrogging the critical communications infrastructure. This improves Greenland’s day-to-day communication and economic activities and enhances its strategic importance by ensuring secure and efficient information flow. Reliable digital networks are essential for attracting international investments, supporting digital economies, and maintaining social cohesion.
Example 2: Geopolitical Competition in the Arctic
Securitizing Actor(s): The Greenland government, aligned with Danish and international allies’ interests, views the increasing presence of Russian and Chinese activities in the Arctic as a direct threat to Greenland’s sovereignty and security.
Extraordinary Measures Required: In response, Greenland can adopt advanced surveillance and defense technologies, such as Distributed Acoustic Sensing (DAS) systems to monitor underwater activities and Unmanned Aerial & Underwater Vehicles (UAVs & UUVs) for continuous aerial surveillance. Additionally, deploying advanced communication networks, including satellite-based systems, ensures secure and reliable information flow.
Geopolitical Implications: By framing foreign powers’ increased activities as a security threat (e.g., Russia and China), Greenland can attract NATO and European Union investments and support for deploying cutting-edge surveillance and defense technologies. This enhances Greenland’s security infrastructure, deters potential adversaries, and solidifies its strategic importance within the alliance.
Example 3: Cybersecurity as a National Security Priority.
Securitizing Actor(s): Greenland, aligned with its allies, frames the potential for cyber-attacks on critical infrastructure (such as power grids, communication networks, and military installations) as an existential threat to national security.
Extraordinary Measures Required: To address this threat, Greenland can invest in state-of-the-art cybersecurity technologies, including artificial intelligence-driven threat detection systems, encrypted communication channels, and comprehensive incident response frameworks. Establishing partnerships with global cybersecurity firms and participating in international cybersecurity exercises can also be part of the strategy.
Geopolitical Implications: By securitizing cybersecurity, Greenland ensures that significant resources are allocated to protect its digital infrastructure. This safeguards its critical systems and enhances its attractiveness as a secure location for international investments, reinforcing its geopolitical stability and economic growth.
Example 4: Arctic IoT and Dual-Use Military IoT Networks as a Security Priority.
Securitizing Actor(s): Greenland’s government, supported by Denmark and international allies, frames the lack of Arctic IoT and dual-use military IoT networks as an existential threat to national security, economic development, and environmental monitoring.
Extraordinary Measures Required: Greenland can invest in deploying Arctic IoT and dual-use military IoT networks to address the threat. These networks involve a comprehensive system of interconnected sensors, devices, and communication technologies designed to operate in the harsh Arctic environment. This includes deploying sensors for environmental monitoring, enhancing surveillance capabilities, and improving communication and data-sharing across military and civilian applications.
Geopolitical Implications: By framing the lack of Arctic IoT and dual-use military IoT networks as a national security issue, Greenland ensures that significant resources are allocated to develop and maintain these advanced technological infrastructures. This improves situational awareness and operational efficiency and enhances Greenland’s strategic importance by providing real-time data and robust monitoring capabilities. Reliable IoT networks are essential for protecting critical infrastructure, supporting economic activities, and maintaining environmental and national security.
THE DANISH DEFENSE & SECURITY AGREEMENT COVERING THE PERIOD 2024 TO 2033.
Recently, Denmark approved its new defense and security agreement for the period 2024-2033. This strongly emphasizes Denmark’s strategic reorientation in response to the new geopolitical realities. A key element in the Danish commitment to NATO’s goals includes a spending level approaching and possibly superseding the 2% of GDP on defense by 2030. It is not 2% for the sake of 2%. There really is a lot to be done, and as soon as possible. The agreement entails significant financial investments totaling approximately 190 billion DKK (or ca. 25+ billion euros) over the next ten years to quantum leap defense capabilities and critical infrastructure.
The defense agreement emphasizes the importance of enhancing security in the Arctic region, including, of course, Greenland. Thus, Greenland’s strategic significance in the current geopolitical landscape is recognized, particularly in light of Russian activities and Chinese expressed intentions (e.g., re: the “Polar Silk Road”). The agreement aims to strengthen surveillance, sovereignty enforcement, and collaboration with NATO in the Arctic. As such, we should expect investments to improve surveillance capabilities that would strengthen the enforcement of Greenland’s sovereignty. Ensuring that Greenland and Denmark can effectively monitor and protect its Arctic territories (together with its allies). The defense agreement stresses the importance of supporting NATO’s mission in the Arctic region, contributing to collective defense and deterrence efforts.
What I very much like in the new defense agreement is the expressed focus on dual-use infrastructure investments that benefit Greenland’s defense (& military) and civilian sectors. This includes upgrading existing facilities and enhancing operational capabilities in the Arctic that allow a rapid response to security threats. The agreement ensures that defense investments also bring economic and social benefits to Greenlandic society, consistent with a dual-use philosophy. In order for this to become a reality, it will involve a close collaboration with local authorities, businesses, and research institutions to support the local economy and create new job opportunities (as well as ensure that there is a local emphasis on relevant education to ensure that such investments are locally sustainable and not relying on an “army” of Danes and others of non-Greenlandic origin).
The defense agreement unsurprisingly expresses a strong commitment to enhancing cybersecurity measures as well as addressing hybrid threats in Greenland. This reflects the broader security challenges of the new technology introduction required, the present cyber-maturity level, and, of course, the current (and future expected) geopolitical tensions. The architects behind the agreement have also realized that there is a big need to improve recruitment, retention, and appropriate training within the defense forces, ensuring that personnel are well-prepared to operate in the Arctic environment in general and in Greenland in particular.
It is great to see that the Danish “Defense and Security Agreement” for 2024-2033 reflects the principles of securitization by framing Greenland’s security as an existential threat and justifying substantial investments and strategic initiatives in response. The focus of the agreement is on enhancing critical infrastructure, surveillance platforms, and international cooperation while ensuring that the benefits of the local economy align with the concept of securitization. That is to ensure that Greenland is well-prepared to address current and future security challenges and anticipated threats in the Arctic region.
The agreement underscores the importance of advanced surveillance systems, such as, for example, satellite-based monitoring and sophisticated radar systems as mentioned in the agreement. These technologies are deemed important for maintaining situational awareness and ensuring the security of Denmark’s territories, including Greenland and the Arctic region in general. In order to improve response times as well as effectiveness, enhanced surveillance capabilities are essential for detecting and tracking potential threats. Moreover, such capabilities are also important for search and rescue, and many other civilian use cases are consistent with the intention to ensure that applied technologies for defense purposes have dual-use capabilities and can also be used for civilian purposes.
There are more cyber threats than ever before. These threats are getting increasingly sophisticated with the advance of AI and digitization in general. So, it is not surprising that cybersecurity technologies are also an important topic in the agreement. The increasing threat of cyber attacks, particularly against critical infrastructure and often initiated by hostile state actors, necessitates a robust cybersecurity defense in order to protect our critical infrastructure and the sensitive information it typically contains. This includes implementing advanced encryption, intrusion detection systems, and secure communication networks to safeguard against cyber threats.
The defense agreement also highlights the importance of having access to unmanned systems or drones. There are quite a few examples of such systems as discussed in some detail above, and can be found in my more extensive article “Stratospheric Drones & Low Earth Satellites: Revolutionizing Terrestrial Rural Broadband from the Skies?“. There are two categories of drones that may be interesting. One is the unmanned version that typically is remotely controlled in an operations center at a distance from the actual unmanned platform. The other is the autonomous (or semi-autonomous) drone version that is enabled by AI and many integrated sensors to operate independently of direct human control or at least largely without real-time human intervention. Examples such as Unmanned Vehicles (UVs) and Autonomous Vehicles (AVs) are typically associated with underwater (UUV/UAV) or aerial (UAV/AAV) platforms. This kind of technology provides versatile, very flexible surveillance & reconnaissance, and defense platforms that are not reliant on a large staff of experts to operate. They are particularly valuable in the Arctic region, where harsh environmental conditions can limit the effectiveness of manned missions.
The development and deployment of dual-use technologies are also emphasized in the agreement. These technologies, which have both civilian and military applications, are necessary for maximizing the return on investment in defense infrastructure. It may also, at the moment, be easier to find funding if it is defense-related. Technology examples include advancements in satellite communications and broadband networks, enhancing military capabilities, and civilian connectivity, particularly how those various communications technologies can seamlessly integrate with one another is very important.
Furthermore, artificial intelligence (AI) has been identified as a transformative technology for defense and security. While AI is often referred to as a singular technology. However, it is actually an umbrella term that encompasses a broad spectrum of frameworks, tools, and techniques that have a common basis in models that are being trained on large (or very large) sets of data in order to offer various predictive capabilities of increasing sophistication. This leads to the expectation that, for example, AI-driven analytics and decision-making applications will enhance the operational efficiency and, not unimportantly, the quality of real-time decision-making in the field (which may or may not be correct and for sure may be somewhat optimistic expectations at least at a basic level). AI-enabled defense platforms or applications are likely to result in improved threat detection as well as being able to support strategic planning. As long as the risk of false outcomes is acceptable, such a system will enrich the defense systems and provide significant advantages in managing complex and highly dynamic security environments and time-critical threat scenarios.
Lastly, the agreement stresses the need for advanced logistics and supply chain technologies. Efficient logistics are critical for sustaining military operations and ensuring the timely delivery of equipment and supplies. Automation, real-time tracking, and predictive analytics in logistics management can significantly improve the resilience and responsiveness of defense operations.
AT THIS POINT IN MY GREENLANDIC JOURNEY.
In my career, I have designed, planned, built, and operated telecommunications networks in many places under vastly different environmental conditions (e.g., geography and climate). The more I think about building robust and highly reliable communication networks in Greenland, including all the IT & compute enablers required, the more I appreciate how challenging and different it is to do so in Greenland. Tusass has built a robust and reliable transport network connecting nearly all settlements in Greenland down to the smallest size. Tusass operates and maintains this network under some of the harshest environmental conditions in the world, with an incredible dedication to all those settlements that depend on being connected to the outside world and where a compromised connection may have dire consequences for the unconnected community.

Comparing the capital spending level of Tusass in Greenland with the averages of other Western European countries, we find that Tusass does not invest significantly more of its revenue than the telco industry’s country averages of many other Western European countries. In fact, its 5-year average Capex to Revenue ratio is close to the Western European country average (19% over the period 2019 to 2023). In terms of capital investments compared to the revenue generating units (RGUs), Tusass does have the highest level of 18.7 euros per RGU per month, based on a 5-year average over the period 2019 to 2023, in comparison with the average of several Western European markets, coming out at 6.6 euros per RGU per month, as shown in the chart below. This difference is not surprising when considering the available population in Greenland compared to the populations in the countries considered in the comparison. The variation of capital investments for Tusass also shows a much larger variation than other countries due to substantially less population to bear the burden of financing big capital-intensive projects, such as the deployment of new submarine cables (e.g., typically coming out at 30 to 50 thousand euros per km), new satellite connections (normally 10+ million euros depending on the asset arrangement), RAN modernization (e.g., 5G), and so forth … For example, the average absolute capital spend was 14.0±1.5 million euros between 2019 and 2022, while 2023 was almost 40 million euros (a little less than 4% of the annual defense and security budget of Denmark) due to, according with Tusass annual report, RAN modernization (e.g., 5G), satellite (e.g., Greensat) and submarine cable investments (initial seabed investigation). All these investments bring better quality through higher reliability, integrity, and availability of Greenland’s critical communications infrastructure although there are not a large population (e.g., millions) to spread such these substantial investments over.

The capital investments required to leapfrog Greenland’s communications network availability and redundancy scores beyond 70% (versus 53% and 44%, respectively, in 2023) would be very substantial, requiring both additional microwave connections (including redesigns), submarine cables, and new satellite arrangements, and new ground stations (e.g., to or in settlements with more than a population of 1,000 inhabitants).
Those investments would serve the interests of the Greenlandic society and that of Denmark and NATO in terms of boosting the defense and security of Greenland, which is also consistent with all the relevant parties’ expressed intent of securitization of Greenland. The required capital investments related to further leapfrogging the safety, availability, and reliability, above and beyond the current plans, of the critical communications infrastructure would be far higher than previously capital spend levels by Tusass (and Greenland) and unlikely to be economically viable using conventional business financial metrics (e.g., net present value NPV > 0 and internal rate of return IRR > a given hurdle rate). The investment needs to be seen as geopolitical relevant for the security & safety of Greenland, and with a strong focus on dual-use technologies, also as beneficial to the Greenlandic society.
Even with unlimited funding and financing to enhance Greenland’s safety and security, the challenging weather conditions and limited availability of skilled resources mean that it will take considerable time to successfully complete such an extensive program. Designing, planning and building a solid defense and security architecture meaningful to Greenlandic conditions will take time. Though, I am also convinced that there are already pieces of the puzzle operational today that is important any future work.

RECOMMENDATIONS.
A multifaceted approach is essential to ensure that Greenland’s strategic and infrastructure development aligns with its unique geographical and geopolitical context.
Firstly, Greenland should prioritize the development of dual-use critical infrastructure and the supporting architectures that can serve both civilian and defense (& military) purposes. For example expanding and upgrading airport facilities (e.g., as is happening with the new airport in Nuuk), enhancing broadband internet access (e.g., as Tusass is very much focusing on adding more submarine cables and satellite coverage), and developing advanced integrated communication platforms like satellite-based and unmanned aerial systems (UAS), such as payload agnostic stratospheric high altitude platforms (HAPs). Such dual-use infrastructure platforms could bolster the national security. Moreover it could support economic activities that would improve community connectivity, and enhance the quality of life for Greenland’s residents irrespective of where they live in Greenland. There is little doubt that securing funding from international allies (e.g., European Union, NATO, …) and public-private partnerships will be crucial in supporting the financing of these projects. Also ensuring that civil and defense needs are met efficiently and with the right balance.
Additionally, it is important to invest in critical enablers like advanced monitoring and surveillance technologies for the security & safety. Greenland should in particular focus on satellite monitoring, Distributed Acoustic Sensing (DAS) on its submarine cables, and Unmanned Vehicles for Underwater and Aerial applications (e.g., UUVs & UAVs). Such systems will enable a more comprehensive monitoring of activities around and over Greenland. This would allow Greenland to secure its maritime routes, and protecting Greenland’s natural resources (among other things). Enhanced surveillance capabilities will also provide multi-dimensional real-time data for national security, environmental monitoring, and disaster response scenarios. Collaborating with NATO and other international partners should focus on sharing technology know-how, expertise in general, and intelligence that will ensure that Greenland’s surveillance capabilities are on par with global standards.
Tusass’s transport network connecting (almost) all of Greenland’s settlements is an essential and critical asset for Greenland. It should be the backbone for any dual-use enhancement serving civil as well as defense scenarios. Adding additional submarine cables and more satellite connections are important (on-going) parts of those enhancements and will substantially increase both the network availability, resilience and hardening to disruptions natural as well as man-made kinds. However, increasing the communications networks ability to fully, or even partly, function in case of network parts being cut off from a few main switching centers may be something that could be considered. With todays technologies might also be affordable to do and fit well with Tusass’s multi-dimensional connectivity strategy using terrestrial means (e.g., microwave connections), sub-marine cables and satellites.
Last but not least, considering Greenland’s limited human resources, the technologies and advanced platforms implemented must have a large degree of autonomy and self-reliance. This will likely only be achieved with solid partnerships and strong alliances with Denmark and other natural allies, including the Nordic countries in and near the Arctic Circle (e.g., Island, Faroe Island, Norway, Sweden, Finland, The USA, and Canada). In particular, Norway has had recent experience with the dual use of ad-hoc and private 5G networking for defense applications. Joint operation of UUV and UAVs integrated with DAS and satellite constellation could be operated within the Arctic Circle. Developing and implementing advanced AI-based technologies should be a priority. Such collaborations could also make these advanced technologies much more affordable than if only serving one country. These technologies can compensate for the sparse population and vast geographical challenges that Greenland and the larger Arctic Circle pose, providing efficient and effective infrastructure management, surveillance, and economic development solutions. Achieving a very high degree of autonomous operation of the multi-dimensional technology landscape required for leapfrogging the security of Greenland, the Greenlandic Society, and its critical infrastructure would be essential for Greenland to be self-reliant and less dependent on substantial external resources that may be problematic to guaranty in times of crisis.
By focusing on these recommendations, Greenland can enhance its strategic importance, improve its critical infrastructure resilience, and ensure sustainable economic growth while maintaining its unique environmental heritage.

FURTHER READING.
- Tusass Annual Reports 2023 (more reports can be found here).
- Naalakkersuisut / Government of Greenland Ministry for Statehood and Foreign Affairs, “Greenland in the World — Nothing about us without us: Greenland’s Foreign, Security, and Defense Policy 2024-2033 – an Arctic Strategy.” (February 2024). The Danish title of this Document (also published in Greenlandic as the first language): “Grønland i Verden — Intet om os, uden os: Grønlands udenrigs-, sikkerheds- og forsvarspolitiske strategi for 2024-2033 — en Arktisk Strategi”.
- Martin Brum, “Greenland’s first security strategy looks west as the Arctic heats up.” Arctic Business Journal (February 2024).
- Marc Jacobsen, Ole Wæver, and Ulrik Pram Gad, “Greenland in Arctic Security: (De)securitization Dynamics under Climatic Thaw and Geopolitical Freeze.” (2024), University of Michigan Press. See also the video associated with the book launch. It’s not the best quality (sound/video), but if you just listen and follow the slides offline, it is actually really interesting.
- Michael Paul and Göran Swistek, “Russia in the Arctic: Development Plans, Military Potential, and Conflict Prevention,” SWP (Stiftung Wissenschaft und Politik) Research Paper, (February 2022). Some great maps are provided that clearly visualize the Arctic – Russia relationships.
- Marc Lanteigne, “The Rise (and Fall?) of the Polar Silk Road.” The Diplomat, (August 2022).
- Trym Eiterjord, “What the 14th Five-Year Plan says about China’s Arctic Interests”, The Arctic Institute, (November 2023). The link also includes references to several other articles related to the China-Arctic relationship from the Arctic Institute China Series 2023.
- Barry Buzan, Ole Wæver, and Jaap de Wilde, “Security: A New Framework for Analysis”, (1998), Lynne Rienner Publishers Inc..
- Kim Kyllesbech Larsen, The Next Frontier: LEO Satellites for Internet Services. | techneconomyblog, (March 2024).
- Kim Kyllesbech Larsen, Stratospheric Drones & Low Earth Satellites: Revolutionizing Terrestrial Rural Broadband from the Skies? | techneconomyblog, (January 2024).
- Deo, Narsingh. “Graph Theory with Applications to Engineering and Computer Science,” Dover Publications. This book is a reasonably accessible starting point for learning more about graphs. If this is new to you, I recommend going for the following Geeks for Geeks ” Introduction to Graph Data Structure” (April 2024), which provides a quick intro to the world of graphs.
- Mike Dano, “Pentagon puts 5G at center of US military’s communications future”, Light Reading (December 2020).
- Juan Pedro Tomas, “Telia to develop private 5G for Norway’s Armed Forces”, RCR Wireless (June 2022).
- Iain Morris, “Telia is building 5G cell towers for the battlefield”, Light Reading (June 2023).
- Saleem Khawaja, “How military uses of the IoT for defense applications are expanding”, Army Technology (March 2023).
- Mary Lee, James Dimarogonas, Edward Geist, Shane Manuel, Ryan A. Schwankhart, Bryce Downing, “Opportunities and Risks of 5G Military Use in Europe”, RAND (March 2023).
- Mike Dano, “NATO soldiers test new 5G tech“, Light Reading (October 2023).
- NATO publication, “5G Technology: Nokia Meets with NATO Allied Command Transformation to Discuss Military Applications”, (May 2024).
- Michael Hill, “NATO tests AI’s ability to protect critical infrastructure against cyberattacks” (January 2023).
- Forsvarsministeriet, Danmark, “Dansk forsvar og sikkerhed 2024-2033.” (June 2023): Danish Defense & Security Agreement (Part I).
- Forsvarsministeriet, Denmark, “Anden delaftale under forsvarsforliget 2024-2033“, (April 2024): Danish Defense & Security Agreement (Part II).
- The State Council Information Office of the People’s Republic of China, “China’s Arctic Policy”, (January 2018).
ACKNOWLEDGEMENT.
I greatly acknowledge my wife, Eva Varadi, for her support, patience, and understanding during the creative process of writing this article. I am incredible thankful to Tusass for providing many great pictures used in the post that illustrates the (good weather!) conditions that Tusass field technicians are faced with in the field working tirelessly on the critical communications infrastructure throughout Greenland. While the pictures shown in this post are really beautiful and breathtaking, the weather is unforgiven frequently stranding field workers for days at some of those remote site locations. Add to this picture the additional dangers of a hungry polar bear that will go to great length getting its weekly protein intake.
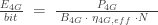 and
and